Licence Creative Commom CC
RBCDH
1 Federal University of São Paulo. Baixada Santista Campus. Interdis-ciplinary Postgraduate Program in Health Sciences. Santos, SP. Brazil.
2 Federal University of São Paulo. Baixada Santista Campus. Depart-ment of Health, Education and Society. Santos, SP. Brazil.
3 Federal University of São Paulo. Baixada Santista Campus. Department of Human Movement Sciences. Santos, SP. Brazil.
Received: 14 January 2015 Accepted: 22 March 2015
Assessment of the diet quality of team
sports athletes
Avaliação da qualidade da dieta de atletas de esportes
coletivos
Luana Pilon Jürgensen1
Natália Vilela Silva Daniel1
Ricardo da Costa Padovani2
Lara Cristina D’Avila Lourenço2
Claudia Ridel Juzwiak3
Abstract– Few studies about food consumption of athletes have assessed the quality of their food choices, and the factors that inluence these choices. he aim of this study was to assess the diet of team sports athletes through a revised version of the Healthy Eating Index (HEI-R) in order to identify their nutritional knowledge and the stage of intention to change eating behavior (SICEB) and to identify possible association with demographic and anthropometric variables. Seventy-two athletes (35 men) were evaluated for the fol-lowing variables: body mass, height, Body Mass Index (BMI), body fat percentage (BF%), nutritional knowledge (questionnaire), food intake (24-hour recall), diet quality (HEI-R) and SICEB (transtheoretical model). For statistical analysis, the Student t test and the Pearson correlation coeicient were used. None of the athletes presented diet classiied as “healthy” and 45.7% (men) and 51.4% (women) had “inadequate” diets. Low consump-tion of fruits, vegetables, whole grains, milk and dairy products was observed. he HEI-R “meats, legumes and eggs” component received the best scores. Pre-contemplation (25.0%) and action (23.6%) stages were the most frequent in the group. he mean percentage of correct answers in the nutritional knowledge questionnaire was 55.7% (men) and 57.3% (women). No association was found between HEI-R and variables age, BMI, BF%, SICEB, nutritional knowledge score and energy intake. his group presents inadequate dietary intake. he lack of association between study variables indicates the need to investigate other factors that inluence athlete’s feeding behavior.
Key words: Athletes; Cross-sectional studies; Feeding; Feeding behavior.
INTRODUCTION
Sports performance and post-exercise recovery can be optimized with
adequate feeding practices1. However, studies have detected that athletes
do not fully meet recommendations2-6. Nevertheless, there is little
knowl-edge about possible barriers and facilitators to select diets that contribute
to athletic performance7-9. In general, studies are based on the comparison
of energy and nutrients intake with speciic recommendations4-6, and few
have assessed selected foods and their quality3,9. Several tools have been
proposed to assess the quality of diets such as the Healthy Eating Index
(HEI), the Nutrient Index, and the Diet Variety Score10. HEI, published in
1995 in the US, was later adapted for Brazil11. In 2011 a revised version,
the Revised Brazilian Health Eating Index (HEI-R)12 was proposed, which
evaluates the consumption of food groups and some nutrients, comparing it to recommendations. Although not speciically designed for athletes, the HEI-R allows adjusting food servings to energy consumption, making it interesting to assess athletes, who generally have higher energy intake.
Several factors inluence food choices: biological, comprising age, health status, hunger/satiety mechanisms and lavors preferences ; experiences with food, which represent learning to like certain foods and associations, physiological, social and personal: beliefs, attitudes, knowledge, culinary skills, family/social inluences, as well as environmental factors, such as availability, accessibility and culture. hese dynamic factors interact in
determining food choices13.
Among these factors, nutritional knowledge and intention to adopt more appropriate feeding behavior are aspects that deserve attention among athletes. Although knowledge may inluence food selection and therefore
sports performance14, the relationship between knowing and doing is not
always clear13. In addition, adherence or maintenance of healthy feeding
behavior changes depending on intrinsic or extrinsic motivation that
en-courages individuals to act15.
Considering the importance of food choices for health and excellence in performance, and given the gap in research with this approach, the aim of this study was to evaluate diet through the HEI-R in order to identify nutritional knowledge, intention to change eating habits, age, Body Mass Index (BMI), body fat percentage (BF%), training hours/week and energy intake, and assess the relationship between these variables.
METHODOLOGICAL PROCEDURES
his is a cross-sectional study with a quantitative approach. Seventy-two athletes (35 male) from team sports of Santos/SP were evaluated. To charac-terize the sample, a trained health team performed the following measures:
body mass (BM) measured in digital scale (G-tec®); height, measured in a
ixed stadiometer (Sanny®) and skinfolds (triceps, subscapular, supra iliac,
Athletes were barefoot and wore light clothing. BMI was calculated and
classiied according to age by the WHO cut-of points16,17, and BF% using
equations of Slaughter et al.18 for those under 18 years of age, and Jackson
and Pollock19,20 for those over 18 years of age.
he study was approved by the Research Ethics Committee of the Federal University of São Paulo (appraisal 2087/11 on January 06, 2012). Data were collected between August/2012 and July/2013.
Nutritional knowledge assessment
Athletes answered a nutritional knowledge questionnaire, and a score was calculated (maximum = 53). he questionnaire was developed for the study “Nutritional Mapping of High-Performance Athletes” and validated by the same authors. It consisted of multiple choice questions elaborated
based on the literature21,22, addressing two categories: nutritional knowledge
(food composition, food groups and health and sports nutrition) and food beliefs. Validation took place in three stages: 1) questionnaire evaluation by six professionals; 2) application to a pilot group of athletes who did not participated in this study. hese steps showed need for adjustments; 3) Ater modiications, the questionnaire was applied to two new groups: undergraduate nutrition students at two times (before and ater
interven-tion, which was to attend the Sports Nutrition discipline in the 3rd year)
and other athletes who did not participated in this study.
he questionnaire allowed to identify changes in the scores of nutri-tion students with a diference of 6.2 [Min = 3.2 and max = 9.2] points between assessments, before and ater intervention (p = 0.005). In addi-tion, the scores discriminated individuals with some nutrition knowledge from laymen. For this, the Student t test for unrelated samples was used, verifying average diference of 12.9 [min = 9.4; max = 16.3] points among groups (p = 0.001).
Dietary assessment
A 24-hour recall of one usual day of training was applied by a trained team.
Photographic record of foods23 was used to estimate amounts ingested. To
estimate the HEI-R’s nutrient components, the Virtual NutriPlusÒ sotware
was used. Food groups were evaluated according to the Food Guide for
the Brazilian Population24. For the inal analysis, the HEI-R12 was applied,
which was composed of nine food groups, two nutrients and one component representing the energy value provided by solid fat, alcohol and sugar. he maximum score of components was obtained with intake greater than or equal to recommendation. In the absence of consumption, a score zero was
assigned, and intermediate values were proportionally calculated11 (Box 1).
he score (maximum = 100) was calculated by comparing
consump-tion to the recommended number of daily servings24 per 1000 kcal. Diet
was classiied as: “inadequate” (less than 51 points) “needs modiications”
Box 1. Score of DQI-R components
Components Maximum score Serving corresponding to maximum score
Total Fruitsb 5 1.0 serving/1.000Kcal
Whole fruitsc 5 0.5 serving /1.000Kcal
Total vegetables 5 1.0 serving /1.000Kcal
Dark green and orange vegetables and legumesd
5 0.5 serving /1.000Kcal
Total cerealsa 5 2.0 serving /1.000Kcal
Whole cereals 5 1.0 serving /1.000Kcal
Milk and dairy productse 10 1.5 serving /1.000Kcal
Meats, eggs and legumes 10 1.0 serving /1.000Kcal
Oilsf 10 0.5 serving /1.000Kcal
Saturated fat 10 7%TEV
Sodium 10 ≤0.7 g/1.000Kcal
Fat_AS 20 ≤10% of TEV
aTotal Cereals = cereals, roots and tubers; bIncludes fruit and natural fruit juices; cExcludes fruit juices; dIncludes
legumes only after maximum score of meat, eggs and legumes is reached; eIncludes milk and dairy products
and soy beverages; fIncludes mono- and polyunsaturated fats, oilseed oils and ish fat; Fat_AS: calories from
solid fat, alcohol and sugar; TEV: Total Energy Value Source: Previdelli et al, 2011.
Identiication of the stage of intention to change eating behavior (SICEB)
To identify SICEB, the transtheoretical model26 was adopted, which
cat-egorizes the individual into one of the following stages:
• Pre-contemplation: no intention of changing in the next six months;
• Contemplation: individual begins to consider the need to change
eat-ing behavior in the future with intention to change within six months;
• Preparation: individual decides to change and starts strategy planning
period. here is intention to change over the next thirty days and some steps have already been taken;
• Action: individual implements the change plan and begins performing
it consistently in less than six months;
• Maintenance: behavioral practice is solidiied and incorporated in
routine for more than six months, being characterized as the efort to prevent relapse.
• Relapse: it can happen at any stage, which is represented when the
individual returns to old habits.
Individuals completed a self-administered questionnaire28 on
inten-tion to change behavior related to healthy eating, which, by means of an algorithm, identiies at which stage the individuals is in at the time.
Statistical analysis
nutritional knowledge, SICEB, age, BMI, %BF, training hours/week and energy intake) the Pearson correlation coeicient and the 95% conidence in-terval (CI) were used. he critical level of p£0.05 was considered signiicant.
RESULTS
Initially 157 basketball, indoor soccer, handball and volleyball athletes were invited to participate, and those who did not complete the evaluation stages (n = 46; 29.3%) or have trained for less than one year and/or less than three days/week (n = 39; 24.8%) were excluded.
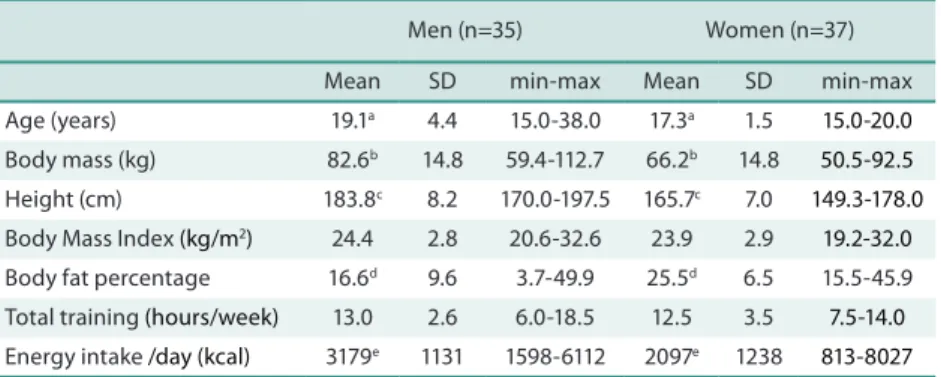
Table 1 shows the characteristics of the athletes. he sample consisted of 86.1% of adolescents. Men had higher mean values of age, body mass, height and energy intake, while women had higher %BF.
Table 1. Characteristics of athletes. Santos, 2014
Men (n=35) Women (n=37)
Mean SD min-max Mean SD min-max
Age (years) 19.1a 4.4 15.0-38.0 17.3a 1.5 15.0-20.0
Body mass (kg) 82.6b 14.8 59.4-112.7 66.2b 14.8 50.5-92.5
Height (cm) 183.8c 8.2 170.0-197.5 165.7c 7.0 149.3-178.0
Body Mass Index (kg/m2) 24.4 2.8 20.6-32.6 23.9 2.9 19.2-32.0
Body fat percentage 16.6d 9.6 3.7-49.9 25.5d 6.5 15.5-45.9
Total training (hours/week) 13.0 2.6 6.0-18.5 12.5 3.5 7.5-14.0
Energy intake /day (kcal) 3179e 1131 1598-6112 2097e 1238 813-8027
SD = standard deviation; min-max = minimum-maximum values. ap = 0.027; b, c, d, e p = 0.001;
It is noteworthy that 33.3% were overweight according to BMI. here was a moderate correlation between BMI and% BF (r = 0.62; conidence interval 95% - CI = 0.46; 0.75).
Table 2 shows the HEI-R score. None of the athletes had a healthy diet and 45.7% of men and 51.4% of women had inadequate diets.
Of the total, 45.7% and 48.6% of men and 56.8% and 59.5% of women did not consume vegetables and whole fruits on that day, respectively. Only 10.8% of women and 14.3% of men met the recommended intake of milk or dairy products and 5 athletes (three men) consumed whole grains and one met recommendations. he component “meats, legumes and eggs” showed the best score, 56.8% of women and 68.6% of men had scores above recommendation.
Table 2. HEI-R and athletes’ score per component. Santos, 2014
Men (n=35) Women (n=37)
Component Serving/
1.000Kcal
Score Serving / 1.000Kcal
Score
DCI-R Score - 52.4 (10.0)
[33-69.7]
- 51.4 (10.1)
[28.7-70.0]
Total fruits 0.6 (0.7)
[0.0-3.0] 2.2 (2.1) [0.0-5.0] 0.9 (1.2) [0.0-5.3] 2.5 (2.2) [0.0-5.0]
Whole fruits 0.3 (0.4)
[0.0-1.4] 2.1 (2.3) [0.0-5.0] 0.4 (0.6) [0.0-2.5] 1.9 (2.4) [0.0-5.0]
Total vegetables 0.4 (0.5) [0.0-2.4] 1.6 (1.8) [0.0-5.0] 0.3 (0.4) [0.0-1.4] 1.3 (1.9) [0.0-5.0]
Dark green vegetables and legumes 0.5 (0.3) [0.0-1.3] 3.2 (2.0) [0.0-5.0] 0.5 (0.6) [0.0-1.8] 2.5 (2.4) [0.0-5.0]
Total cereals 2.0 (0.6)
[1.1-3.8] 4.6 (0.6) [2.8-5.0] 2.3 (0.8) [1.0-3.9] 4.5 (0.8) [2.3-5.0]
Whole cereals 0.1 (0.2)
[0.0-1.2] 0.3 (1.0) [0.0-5.0] 0.0 (0.1) [0.0-0.6] 0.1 (0.4) [0.0-2.2]
Milk and by-products 0.8 (0.7) [0.0-2.6] 5.1 (3.6) [0.0-10.0] 0.7 (0.7) [0.0-2.5] 4.5 (3.6) [0.0-10.0]
Meats, legumes and eggs 1.4 (0.5) [0.6-2.9] 9.8 (0.9) [5.5-10.0] 1.3 (0.8) [0.0-3.8] 9.1 (2.1) [0.0-10.0]
Oils 0.6 (0.3)
[0.2-1.6] 8.6 (1.8) [4.2-10.0] 0.8 (0.4) [0.3-1.9] 9.8 (0.6) [6.9-10.0]
Saturated fat 10.4 (4.2) [3.5-19.2] 6.0 (3.8) [0.0-10.0] 10.0 (2.7) [4.8-15.1] 6.8 (3.1) [0.0-10.0]
Sodium 1.1 (0.3)
[0.5-1.8] 6.9 (2.3) [1.9-10.0] 1.2 (0.6) [0.4-3.2] 6.5 (2.7) [0.0-10.0]
Fat, sugar and alcohol 36.5 (9.4) [21.3-58.0] 2.3 (3.0) [0.0-10.3] 36.6 (9.5) [19.5-62.4] 2.3 (3.5) [0.0-11.6]
Values expressed as mean (standard deviation), [minimum-maximum values]
Only two athletes reported other supplements; one of them consumed whey protein and other BCAA and whey protein, not considered in any of the components.
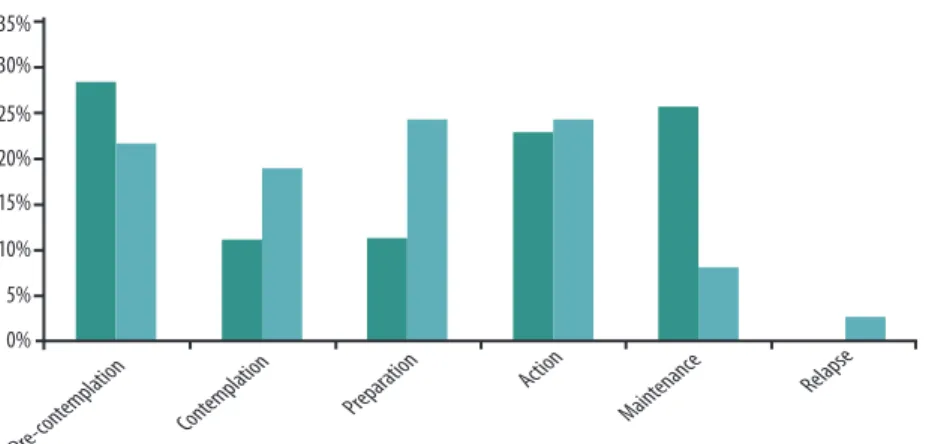
he SICEB classiication was heterogeneous. Men were mostly in the pre-contemplation and maintenance stages, while women were in the decision and action stages (Figure 1).
Considering the possible 53 points of the nutrition knowledge ques-tionnaire, men had, on average,55.7% (mean score = 29.5, SD = 7.1) and women 57.4% (mean score = 30.4, SD = 5.7) of correct answers. Questions with higher proportions of correct answers were about: pre-training snack (98.6%), healthy eating (91.6%), balanced meal (90.3%), post-training snack (84.7%), foods high in fats and food groups (both with 88.0%). he lowest proportion of correct answers was about foods rich in vitamin C (27.2%). he most common beliefs were related to the overvaluation of proteins, consumption of pure water as the best strategy for long training sessions and banana as the best strategy against cramp.
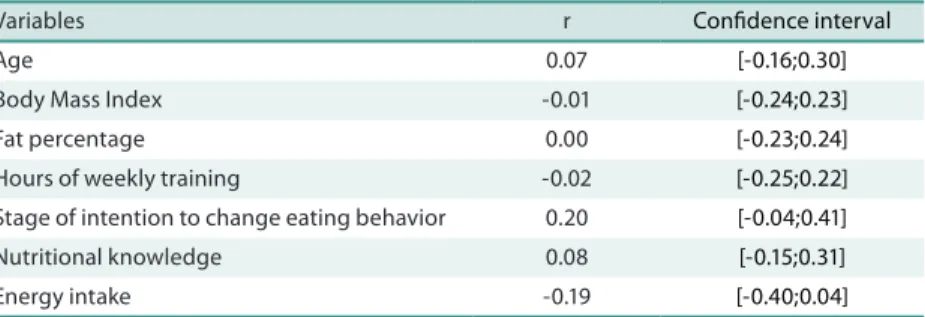
No association was found between the HEI-R score and the variables analyzed (p> 0.05) (Table 3).
Table 3. Association between HEI-R and the variables analyzed. Santos, 2014
Variables r Conidence interval
Age 0.07 [-0.16;0.30]
Body Mass Index -0.01 [-0.24;0.23]
Fat percentage 0.00 [-0.23;0.24]
Hours of weekly training -0.02 [-0.25;0.22]
Stage of intention to change eating behavior 0.20 [-0.04;0.41]
Nutritional knowledge 0.08 [-0.15;0.31]
Energy intake -0.19 [-0.40;0.04]
DISCUSSION
he average BM value found for women was higher than that found for
adolescent athletes of different sports discipline (54.7kg)2, volleyball
(57.0kg)3 and indoor soccer players (60.0kg)5. he means found are within
ranges reported in literature for height (157.7 to 165.0cm)2,3,5 and BMI
(21.5 to 22.4 kg / m2)2,3,5. he proportion of those classiied as overweight,
according to BMI, was higher than that found for adolescents of diferent
sports disciplines (28%)2. Men showed higher mean BM value compared to
adolescents of diferent sports disciplines (62.7kg)2, indoor soccer (74.2kg)5
and volleyball players (65.7kg)6, as well as for height (166.4 to 175.0cm)2,5,6
and BMI (21.3 to 24.1kg/m2)2,5,6. he proportion of overweight, according
to BMI, was lower in athletes from Santos compared to those studied by
Zimberg et al.2 (38%). he age range found in the studies could probably
explain the magnitude of values found.
In athletes, the association between body composition and BMI is es-sential to identify whether BMI is high at the expense of muscle mass or fat. he results of this study suggest that overweight, in some cases, is related to high %BF. Excess BM, mainly due to high fat can impair performance.
Conte et al.28 found that overweight resulted in lower abdominal muscle
strength, lower limb strength and agility in adolescents.
Studies on food intake have shown varied energy intake3-6. he average
volley-ball players (1447 Kcal)3 and close to the intake of handball (2102 kcal)4 and
indoor soccer players (2294 kcal)5. Men showed energy intake between values
found for indoor soccer (2796 Kcal)5 and volleyball players (3688 Kcal)6.
here are no other studies using the HEI-R to assess athletes. Bissochi
and Juzwiak3 used the HEI25 to evaluate adolescent volleyball players and
Malinauskas et al.9 used the HEI in college baseball athletes. hese authors
observed that most athletes needed changes in their diets; although the instruments adopted did not have their components adjusted to energy value and used diferent components from those of the HEI-R.
hose studies’ indings3,9 on the consumption of fruits and vegetables
are in line with this study. Although the “fruits” component of the HEI is based on servings/day, without adjustment to energy values, it was the
second worst score among baseball players9 and most volleyball players3 did
notingest recommended values. Another common feature of the studies
was that the “meats and eggs” component presented the best score. Most
of the athletes from Santos and those cited in previous studies3,9 consumed
amounts of meats and eggs equal to or greater than recommended values. his result may be related to the overvaluation of protein intake identiied in the beliefs presented by athletes, corroborating this perception among
athletes29. In addition, the age group must be considered, as this may be
one of the factors which inluence food choices13.
As a limitation, not exclusive to the HEI-R, is that the excessive intake of some groups i.e. meat, was not considered. Nevertheless, the excess of this food group relected in the low score of the saturated fat component.
Although the intake of added sugar should be restricted, in athletes, using this type of carbohydrate during prolonged exercise (30-60g/h),is an interesting strategy to help maintaining blood sugar levels and delaying
the depletion of muscle glycogen stores1. he seven athletes who consumed
sports drinks had reduced scores of this component, even being a recom-mended strategy. his characteristic must be considered when selecting this instrument to assess athletes’ diet.
he heterogeneous SICEB classiication conirms the importance of planning food and nutrition education activities (NEA) considering that
not everyone is ready for changes and of the same magnitude15. Individuals
at diferent stages beneit from diferent types of educational messages. For example, for individuals at the maintenance stage, activities can be focused on practice; while for those at the pre-contemplative stage, to stimulate
awareness may be more interesting since they do not recognize the problem15.
Although studies have indicated that food choices are inluenced by
age, body composition, body image, educational level and motivation15, the
lack of association between variables supports the principle of dynamic
interaction of biological, social, cultural and psychological components13.
he concern with excessive weight and body fat was identiied as having
inluence on the feeding behavior of soccer players7 and adolescents of
aes-thetic sports8. In addition, lack of time, inancial constraints, culinary skills
No other study has used the same nutritional knowledge questionnaire, making the comparison of results diicult. However, the average percentage of correct answers obtained by the athletes from Santos was better than the results found for volleyball players before intervention (44.9%) and close to
the results ater intervention (57.3%)30, as well as for rugby players (55.6%)21.
Nevertheless, the lack of association between knowledge and the HEI-R rein-forces that knowledge is only one of the inluencing factors and NEA strategies based only on knowledge transmission may not be efective. Furthermore, it should be considered that eating relects socio-cultural aspects and individual experiences determinants of behavior. In addition to physiological needs, eating habits acquired at diferent stages of life can have meanings and be
related to psychological, environmental, economic and cultural processes13.
Although many factors inluence food choices, as described above, this study has only assessed the efect of nutrition knowledge and SICEB on diet quality, inding no association between them. Biological and environmental factors also have fundamental importance; however, for identiication and analysis, they require longer follow-up of the target group, which was not possible in this study. Further studies should seek to evaluate and discuss these factors to better understand the complex process of food choices.
It is noteworthy that this study has limitations that may have inluenced the lack of associations between variables, such as the small sample size and application of the 24-hour recall, which does not assess the variability in daily intake and is dependent on the memory and report of subjects. Longitudinal studies and/or the use of qualitative methods such as in-depth interviews, which explore the history of life and food experiences, may clarify other issues that quantitative methods cannot measure, enabling a better understanding of food choices among athletes.
CONCLUSION
he results of the assessment allowed concluding that athletes have inad-equate dietary intake. he lack of association between variables indicates the need to investigate other factors that inluence food behavior of athletes, in order to know the determinants of their food choices. To understand these factors allows the development of NEA actions designed according to speciic need of the groups, enabling improvements in the quality of diet, nutritional knowledge, body composition, and consequently sports performance.
Acknowledgments
REFERENCES
1. American College of Sports Medicine, American Dietetic, Association, Dietitians of Canada. Nutrition and Athletic Performance. Med Sci Sports Exerc 2009;41(3):709-31.
2. Zimberg IZ, Cavalieri RB, Camargo LR, Cintra IP. Peril nutricional de adolescentes esportistas frequentadores de um ambulatório de nutrição esportiva. Braz J Sports Nutr 2012;1(1):21-9.
3. Bissochi CO, Juzwiak CR. Avaliação nutricional e da percepção da autoimagem corporal de atletas adolescentes de voleibol. Nutrire 2012;37(1):34-53.
4. Weber MH, Kehl C, Moreira JCF. Comparação do peril dietético e antropométrico de atletas de handebol durante um período de treinamento. FIEP Bulletin 2012;82 Special Edition - Article II; Available from: http://www.iepbulletin.net [2015 fev 10].
5. Quintão DF, Oliveira GC, Silva AS, Marins JCB. Estado nutricional e peril ali-mentar de atletas de futsal de diferentes cidades do interior de Minas Gerais. Rev Bras Futebol 2009;2(1):13-20.
6. Dias SX, Bonatto S. Composição corporal e peril dietético de adolescentes atletas de voleibol da universidade de Caxias do Sul – RS. RBNE 2011;5(29):417-24.
7. Long D, Perry C, Unruh SA, Lewis N, Stanek-Krogstrand K. Personal food systems of male collegiate football players: a grounded theory investigation. J Athl Train 2011;46(6):688-95.
8. Fortes LS, Neves CM, Filgueiras JF, Almeida SS, Ferreira MEC. Body dissatisfaction, psychological commitment to exercise and eating behavior in young athletes from aesthetic sports. Rev Bras Cineantropom Desempenho Hum 2013;15(6):695-704
9. Malinauskas BM, Overton RF, Cucchiara AJ, Carpenter AB, Corbett AB. Summer league college baseball players: do dietary intake and barriers to healthy eating difer between game and non-game days? Smart J 2007;3(2):23-34.
10. Cervato AM, Vieira VL. Índices dietéticos na avaliação da qualidade global da dieta. Rev Nutr 2003;16(3):347-55.
11. Fisberg RM, Slater B, Barros RR, Lima FD, Cesar CLG, Carandina L, et al. Índice de Qualidade da Dieta: avaliação da adaptação e aplicabilidade. Rev Nutr 2004;17(3):301-8.
12. Previdelli AN, Andrade SC, Pires MM, Ferreira, SRG, Fisberg, RM, Marchioni DM. Índice de Qualidade da Dieta revisado para população brasileira. Rev Saúde Pública 2011;45(4):794-8.
13. Contento IR. Nutrition education: linking research, theory, and practice. Asia Pac J Clin Nutr 2008;17(1):176-9.
14. Pessi S, Fayh APT. Avaliação do conhecimento nutricional de atletas proissionais de atletismo e triathlon. Rev Bras Med Esporte 2011;17(4):242-5.
15. Toral N, Slater B. Abordagem do modelo transteórico no comportamento alimentar. Ciênc Saúde Colet 2007;12(6):1641-50.
16. World Health Organization. WHO Reference 2007: Growth reference data for 5-19 years. 2007; Available from: <http://www.who.int/growthref/en/> [2014 oct 01].
17. World Health Organization. Obesity: preventing and managing the global epidemic. Report of a WHO Consultation on Obesity. Geneva: World Health Organization; 1997.
18. Slaughter MH, Lohman TG, Boileau RA, Horswill CA, Stillman RJ, Van Loan MD, et al. Skinfold equations for estimations of body fatness in children and youth. Hum Biol 1988;60(5):709-23.
19. Jackson AS, Pollock ML, Ward A. Generalized equations for predicting body density of women. Med Sci Sports Exerc 1980;12(3):175-82.
20. Jackson JA, Pollock ML. Generalized equations for predicting body density of men. Br J Nutr 1978;40(3):497-504.
21. Zinn C, Schoield G, Wall C. Evaluation os sports nutrition knowledge of New Zea-land Premier Club rugby coaches. Int J Sport Nutr Exerc Metab 2006;16(2):214-25.
Corresponding author
Claudia Ridel Juzwiak. Departamento de Ciências do Movimento Humano, Universidade Federal de São Paulo - Campus Baixada Santista, São Paulo, Brasil. Rua Silva Jardim, no136 – Vila Matias – Santos/SP, Brasil – CEP 11015-020 Email: [email protected]
23. Zabotto CB, Vianna RP, Gil MF. Registro fotográico para inquéritos dietéticos: utensílios e porções – NEPA-UNICAMP. Goiânia: Ed UFG; 1996.
24. Brasil. Ministério da Saúde. Secretaria de Atenção à Saúde. Departamento de Atenção Básica. Guia Alimentar para a População Brasileira: promovendo a ali-mentação saudável. Ministério da Saúde, Secretaria de Atenção à Saúde. Brasília: Ministério da Saúde; 2008.
25. Godoy, FC, Andrade SC, Morimoto JM, Carandina L, Goldbaum M, Barros MBA, et al. Índice de qualidade da dieta de adolescentes residentes no distrito de Butantã, município de São Paulo, Brasil. Rev Nutr 2006;19(6):663-71.
26. Prochaska JO, Redding CA, Evers KE. he transtheoretical model and stages of changes. In: Glanz K, Rimer BK, Visvanath K, editores. Health, behaviour and health education. heory, Research, and Practice. San Francisco: Jossey-Bass; 2008:97-117. Available from: http://www.academia.edu/6487965/HEALTH_BEHAVIOR_AND_HEALTH_EDU-CATION_heory_Research_and_Practice_4TH_EDITION [2013 set 01].
27. Zaccarelli EM. Modelo Transteórico e curso de vida. In: Fisberg RM, Slater B, Marchioni DML, Martini LA. Inquéritos Alimentares: Métodos e bases cientíicos. Barueri: Manole; 2005. p. 53-70.
28. Conte M, Gonçalves A, Aragon FF, Padovani CR. Inluência da massa corporal sobre a aptidão física em adolescentes: estudo a partir de escolares do ensino fundamental e médio de Sorocaba/SP. Rev Bras Med Esporte 2000;6(2):44-9.
29. Kanno P, Rabelo M, de Melo GF, Giavoni A. Dieta ideal versus desempenho es-portivo: um estudo sobre os estereótipos nutricionais aplicados por triatletas. Rev Bras Cineantropom Desempenho Hum 2009;11(4):444-8.