Revista Brasileira de
Engenharia Agrícola e Ambiental
Campina Grande, PB, UAEA/UFCG – http://www.agriambi.com.br
v.19, n.12, p.1129–1135, 2015
Inadequacy of the gamma distribution to calculate
the Standardized Precipitation Index
Gabriel C. Blain
1& Monica C. Meschiatti
1DOI: http://dx.doi.org/10.1590/1807-1929/agriambi.v19n12p1129-1135
A B S T R A C T
The Standardized Precipitation Index was developed as a probability-based index able to monitor rainfall deficit in a standardized or normalized way. Thus, the performance of this drought index is affected by the use of a distribution that does not provide an appropriate fit for the rainfall data. The goal of this study was to evaluate the adjustment of the gamma distribution for the rainfall amounts summed over several time scales (Pelotas, Rio Grande do Sul, Brazil), to assess the goodness-of-fit of alternative distributions to these rainfall series and to evaluate the normality assumption of the Standardized Precipitation Index series calculated from several distributions. Based on the Lilliefors test and on a normality test, it is verified that the gamma distribution is not suitable for calculating this Index in several timescales. The generalized normal distribution presented the best performance among all analysed distributions. It was also concluded that the drought early warning systems and the academic studies should re-evaluate the use of the gamma distribution in the Standardized Precipitation Index calculation algorithm. A computational code that allows calculating this drought index based on the generalized normal distribution has also been provided.
Inadequação da distribuição gama para o cálculo
do Índice Padronizado de Precipitação
R E S U M O
O Índice Padronizado de Precipitação foi desenvolvido para ser um método probabilístico que monitora os déficits de precipitação pluvial, de forma normalizada. Assim, a confiabilidade deste índice é afetada pelo uso de distribuições inadequadas aos dados de precipitação. Com isto, o objetivo do trabalho foi: avaliar o ajuste da distribuição gama aos totais de precipitação acumulados em distintas escalas temporais (Pelotas, Rio Grande do Sul), analisar o desempenho de demais distribuições no cálculo desse índice e avaliar o pressuposto de normalidade das séries desse quantificador de seca, calculadas com base nessas distintas distribuições. Os testes Lilliefors e de normalidade indicaram que a distribuição gama não é apropriada para o cálculo do índice em diversas escalas temporais. A distribuição generalizada normal mostrou-se apropriada. O uso desta função também resultou no maior número de séries com distribuição normal. Recomenda-se, então, que os sistemas de monitoramento de seca e os estudos acadêmicos reavaliem o uso da distribuição gama no cálculo do Índice Padronizado de Precipitação. Um código computacional capaz de calcular este índice de seca a partir da distribuição generalizada normal é também apresentado.
Key words:
rainfall departures normality test goodness-of-fit tests
Palavras-chave:
desvios de precipitação teste de normalidade teste de aderência
1 Centro de Ecofisiologia e Biofísica/Instituto Agronômico de Campinas. Campinas, SP. E-mail: gabriel@iac.sp.gov.br (Corresponding author);
monicameschiatti@hotmail.com
Introduction
Drought is a natural phenomenon that occurs in virtually all parts of the globe. It may be regarded as a slow-moving hazard that presents no single or universal definition (Hayes et al., 2011; Lloyde, 2014). However, it is well known that a prolonged and abnormally dry period can severely impact virtually all human and natural processes (Blain, 2012). Accordingly, a great number of drought indices have been proposed to monitor the drought conditions in several parts of the world. Among then, the Standardized Precipitation Index (SPI) has been widely used in both academic and operational modes (Wu et al., 2007; Jain et al., 2010) to detect rainfall deficits summed over several time spans (or timescales).
In Brazil, the SPI is used by drought early warning systems of several governmental agricultural institutions such as Empresa Brasileira de Pesquisa Agropecuária (EMBRAPA), Instituto Agronômico (IAC), Instituto Nacional de Meteorologia (INMET) as well as by the Instituto Nacional de Pesquisas Espaciais (INPE). Moreover, the Lincoln Declaration on Drought Indices stated that the national hydrological and meteorological services around the Globe should use the SPI to characterize meteorological droughts (Hayes et al., 2011). This declaration also stated that the World Meteorological Organization should encourage the widespread use of the SPI in countries wanting to track meteorological droughts.
The SPI may be calculated for several timescales depending on the particular interest of the users (Dutra et al., 2013) with typically values ranging from 1 to 24 months. Thus, the SPI is able to simultaneously describe wet conditions at a given timescale and dry conditions at other timescale (Türkeş & Tatli, 2009). However, the time responses to drought of different systems such as water reservoirs and/or soil moisture are frequently not known (Vicente-Serrano et al., 2012). Therefore, for each particular application and region a detailed study should be carried out to relate the different SPI values (calculated at different timescales) to the variable of interest (e.g. available soil moisture or natural reservoirs; Dutra et al., 2013). Further information on the advantages and drawbacks of the SPI and its association with the different types of drought can be found in several studies including Fernandes et al. (2010) and Blain (2012).
One of the fundamental steps of the SPI calculation algorithm is to estimate the cumulative probability of a given rainfall amount summed over a particular timescale. Therefore, the confidence in the SPI results may be affected by the use of a distribution that does not provide a suitable goodness-of-fit for the rainfall data (Wu et al., 2005; 2007; Sienz et al., 2012; Stagge et al., 2015). Although authors such as Guttman (1999) and López-Moreno & Vicente-Serrano (2008) have already provided evidences indicating that the gamma distribution may not always be the most appropriate choice; this fundamental step is frequently based on this 2-parameter distribution (Wu et al., 2007; Dutra et al. 2013; among many others). Moreover, the gamma distribution may not give the best goodness-of-fit for the rainfall data summed over different timescales because it only has two free parameters (Wu et al., 2007).
The SPI final values are obtained by performing an equiprobability transformation of the cumulative probability
estimated in the above-mentioned step (Wu et al., 2007). From a mathematical point of view, the essential goal of this latter step is to transform the SPI series into normally distributed series with zero mean and unitary variance. From a meteorological point of view, the essential goal of this transformation is to ensure that the SPI is capable of representing drought and flood events in a similar probabilistic fashion (Wu et al., 2007). Thus, the parametric distribution used to calculate this probability-based index should also be capable of providing normally distributed SPI series. Further details on the importance of meeting the normality assumption of the SPI series may be found in Wu et al. (2007), Blain (2012) and Stagge et al. (2015).
Finally, although McKee et al. (1993) have stated that the required length of record for rainfall used in the SPI calculation is ‘ideally a continuous period of at least 30 years’; Guttman (1994) stated that 70 to 80 years of records are required for parameter estimation stability in the tails of the rainfall distributions. Depending on the distribution and on the method used to estimate its parameters, the required length of record may be even longer (Wu et al., 2005).
Considering the above-mentioned SPI features the following three questions are posed: Is the 2-parameter gamma distribution suitable for fitting the rainfall series summed over several timescales in a given location? Is there an alternative distribution capable of performing such task? Is this alternative distribution capable of providing a higher number of normally distributed SPI series than the gamma distribution does? Therefore, the goals of this study were: (i) to assess the fit of the gamma distribution for the rainfall amounts summed over several timescales (1 to 24 months; obtained from one of the oldest Brazilians weather stations - Pelotas, Rio Grande do
Sul, 1896-2011); (ii) to assess the goodness-of-fit of alternative
distributions to such rainfall series and; (iii) to evaluate the normality assumption of the SPI series obtained from the distributions used to calculated this drought index.
Material and Methods
The rainfall daily data used in this study were obtained from the weather station of Pelotas, Rio Grande do Sul State,
Brazil (21º 52’ S, 52º 21 W and 13.2 m; 1896-2011; Federal
University of Pelotas, RS). The choice of Pelotas is because it is one of the longest meteorological series of Brazil showing a high consistency (Blain et al., 2009). From the daily data, it was derived the rainfall series used to calculate the SPI at several timescales (1 to 24 months). It is also emphasize that Pelotas is one of the fewest Brazilians weather station capable of meeting the required length of record for parameter estimation stability in the tails of the rainfall distributions (Guttman, 1994; Wu et al., 2005). All statistical tests were performed at the 0.05 significance level.
The SPI calculation starts by determining a cumulative density function (cdf) capable of properly describing the long-term observed rainfall series (Guttman, 1999). Once a pdf is chosen, the cumulative probability of a given rainfall amount [H(PRE)] is calculated from the following mixed distribution:
(
)
m m(
)
H PRE 1 cdf PRE
N N
= + −
where:
N - sample size; and
m - number of zeros of the data sample.
As described in Wu et al. (2007) the final step of the SPI calculation is to apply an equiprobability transformation to the
[H(PRE)] values (Abramowitz & Stegun, 1965).
The Kolmogorov-Smirnov (KS) and the chi-square tests (χ2) are frequently used to assess the fit of a given parametric
distribution to a given data sample (Wilks, 2011). Nevertheless, to calculate the χ2 one needs to divide the data into discrete
classes. Consequently, the χ2 test operates more naturally for
discrete random variable (Wilks, 2011).
The KS test compares the cumulative density function (cdf) to the empirical function. Thus, for continuous data such as rainfall data, the KS test is often more powerful than the χ2
(Wilks, 2011). However, an important feature of the KS test is that it must not be applied to the same data sample used to estimate the parameters of the distribution (Vlček & Huth, 2009). Therefore, since the parameters of distributions have been estimated from all available data, a modification of the original KS test referred to as Lilliefors test was used.
The Lilliefors test also compares the cumulative density function to the empirical function. However, while the null hypothesis of the KS test does not depend upon the explicit form of the distribution under analysis, the null hypothesis of the Lilliefors depends on the values of the shape parameter. Accordingly, the critical values for the Lilliefors test are usually derived from statistical simulations procedures (Shin et al., 2012; Heo et al., 2013; Blain, 2014). Further information on the Lilliefors test can be found in studies such as Blain (2014). Finally, it was also took into account the domain of the probability distribution functions. Therefore, if an observed rainfall amount falls beyond the domain of a given distribution (described in Table 1), this distribution will be regarded as inappropriate to assess the probabilistic structure of the series from which this rainfall amount was observed.
As previously described, the parametric distribution used to calculate the SPI should be capable of providing normally distributed SPI series. Therefore, it was applied the same algorithm proposed by Wu et al. (2007) to verify the normality
(
)
(
)
2
1 2
2 3
1 2 3
2
1 2
2 3
1 2 3
co c t c t
SPI t when 0 H PRE 0.5
1 d t d t d t
co c t c t
SPI t when 0.5 H PRE 1
1 d t d t d t
+ +
= − − < ≤
+ + +
+ +
= + − < <
+ + +
(
)
(
)
(
)
(
)
(
)
(
)
2
2 1
t ln when 0 H PRE 0.5
H PRE
1
t ln when 0.5 H PRE 1
1 H PRE
= < ≤
= < <
−
co = 2.515517; c1 = 0.802853; c2 = 0.010328; d1= 1.432788; d2= 0.189269; d3 = 0.001308.
The parametric distributions used in this study, 2-parameter gamma, general extreme value, generalized logistic, 3-parameter generalized normal, generalized Pareto, Pearson Type III, 4-parameter Kappa and 5-parameter Wakeby are described in Table 1. The greek characters are the parameters of the distributions that were estimated from all available data by means of the L-moments method (Guttman, 1999; Queiroz &
Chaudhry, 2006; Blain & Meschiatti, 2014).
# Standardized Precipitation Index
Table 1. Parametric distributions used to calculated the SPI#
(2)
assumption of the SPI series. A SPI series was considered non-normal when the following criteria were simultaneously met: (a) absolute value of the median greater than 0.05; (b)
Shapiro–Wilk statistic lower than 0.96 and p-values ≤ 0.10.
Further information on the Shapiro-Wilk test may be found in several studies including Razali & Wah (2011).
Results and Discussions
Several rainfall amounts observed at the weather station of Pelotas have fall beyond the domain of both Wakeby and Pearson Type III distribution. For instance, by considering the parameters of the Pearson Type III distribution obtained from
the monthly series of October (µ = 100.64; ξ = 61.43 and σ = 1.33) and the domain of this distribution (Table 1; 8.26 mm ≤ PRE ≤ +∞) the probability of the observed rainfall amount for October 1924 (6.7 mm) cannot be estimated. Naturally,
this prevents the Pearson Type III distribution to be used as a statistical basis for a drought early warning system.
In spite of the fact that the Wakeby distribution is able to exhibit shapes that other 2- or 3-parameter distributions cannot
mimic (Sen & Niedzielski, 2010; Morgan et al., 2011; Santos et al., 2011), this 5-parameter function has also failed to describe the probabilistic structure of a large number of rainfall series
observed at the weather station of Pelotas (37% of the 264
series). For instance, the observed rainfall amount for March 1905 is 1.0 mm. However, by considering the parameters of
the Wakeby distribution for such Month (ξ = 11.22, α = 103.28, β = 1.63, g = 59.24, δ = -0.01) the domain of this function is
11.22 mm ≤ PRE ≤ ξ+α/β-g/δ. Therefore, the Pearson Type III and Wakeby have been discarded as alternative distributions to calculate the SPI.
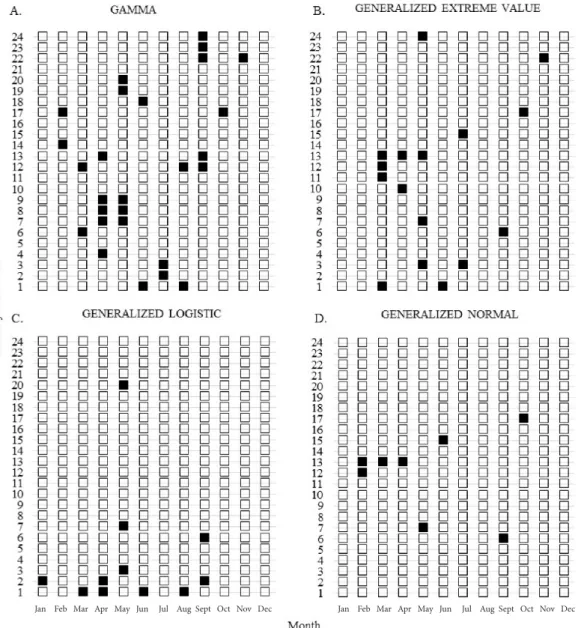
Among the 264 rainfall series (Figure 1A; 12 Months and
24 timescales for each distribution) the Lilliefors test indicated that the gamma 2-parameter distribution cannot be used to describe the probabilistic structure of approximately 10% of the series (27 series). This result is consistent with the statement that a 2-parameter distribution may not give the best goodness-of-fit for the rainfall data summed over different time scales (Wu et al., 2007). This latter finding also agrees with the studies indicating that the gamma distribution may not be the most appropriate choice for assessing the probability of occurrence
Figure 1. Lilliefors test applied to the rainfall series used to calculate the Standardized Precipitation Index (SPI) for the weather station of Pelotas Rio Grande do Sul State, Brazil
The dark squares denote that the distribution cannot be used to assess the probability of the rainfall amounts. The open squares indicate the opposite
of the rainfall amounts used to calculate the SPI (Guttman, 1999; Lopez-Moreno & Vicente-Serrano, 2008).
The results presented in Figure 1 also indicate that 3-parameter distributions tend to be preferred to 2-parameter distributions (Guttman, 1999). For instance, the generalized extreme value distribution performed slightly better than the gamma distribution. This 3-parameter function cannot be used to assess the probability of the rainfall amounts obtained
from 6.1% of the series (Figure 1B). The generalized normal
and the generalized logistic were the only two distributions that have presented rejection rates lower than the adopted significance level. By considering that the significance level is the probability of falsely to reject the null hypothesis, these low rejection levels may be regarded as evidences in favor of the use of these two distributions (Stagge et al., 2015). In this view, the results presented in Figure 1C indicate that the generalized logistic distribution cannot be used to describe the probabilistic
structure of 4.1% of the 264 series. Among all the evaluated
distributions, the generalized normal distribution (Figure 1D) have presented the best performance. This distribution has
failed to fit only 3.0%, of the 264 rainfall series.
The Kappa and General Pareto distributions have presented performances far worse than any other distribution evaluated in Figure 1 (not show here because of the sake of brevity). These distributions cannot be used to describe the probabilistic structure of more than 50% of the series.
After evaluating the results depicted in Figure 1, it becomes worth emphasizing that the analysis of the SPI literature revels that virtually all studies use a single distribution (frequently the 2-parameter gamma) to calculate this drought index (Guttman, 1999; Wu et al., 2007; Lopez-Moreno & Vicente-Serrano, 2008; Blain 2012; Dutra et al., 2013; among many others). In other words, the use of the SPI has been based on the assumption that, for a given location, a single distribution is always capable of fitting the rainfall amounts summed over several timescales. The results of the goodness-of-fit tests (Figure 1) have provided evidences indicating that this assumption may not always be met. The normality test indicated that the gamma distribution has failed to provide normally distributed SPI series also for 10% of the analyzed series (Figure 2A). The results of the normality test are consistent with those presented in Figure 1 in the sense that the generalized normal distribution outperforms
Figure 2. Normality test applied to the rainfall series used to calculate the Standardized Precipitation Index (SPI) for the weather station of Pelotas Rio Grande do Sul State, Brazil
The dark squares denote non-normal distributions. The open squares denote normal distribution
all other distributions (including the 2-parameter gamma) in providing normally distributed SPI series. The normality tests have revealed that the median of the SPI values calculated from generalized normal distribution fall more often within
the [-0.05:+0.05] interval than the median of the SPI values
obtained from the other distributions. Naturally, this is an important feature for an index developed to represent floods and drought events in a similar probabilistic fashion (Wu et al., 2007; Blain, 2012).
By using the r-package ‘Lmonco’ (Asquith, 2013) as well as the following r-code, one is able to calculate the SPI for any rainfall series. Naturally, the rainfall data should to have been drawn from a population with generalized normal distribution. Before using this r-code, the user should first write it in the r-script and the data must be sorted by month (all evaluated years must have 12 rainfall amounts). A basic knowledge of the r-software is also required. The code is easily adapted to calculate the SPI with other distributions and/or for higher numbers of timescales.
---#Load Lmonco package from “http://www.r-project.org/” TIME=12 # monthly data
Nscales= 1 # 1 timescale ci=0
#originaldata is a matrix in which the 1st column is the years.
#the 2nd column is the months (1 for January and 12 for December).
# the 3rd column is the rainfall amounts summed over the timescale of interest.
# all evaluated years must have 12 rainfall amounts t= as.matrix(read.table("mydata.txt", head=T)) t=t [order(t[,2]),drecreasing=T]
NN=(length(t))/(Nscales+2)
x= matrix(NA, NN/TIME, 1) N=length(x)
SPI1=matrix(NA, N, TIME) y=matrix(NA, N, 1)
probacum= matrix(NA, N, 1) for (tempo in 1: TIME){
inicio=((ci*NN)/TIME)+1 fim=(ci+1)*NN/TIME
#x[,1]=t[inicio:fim,3]
ci=ci+1
y[,1]=sort(x) data1=y> 0 datap=y[data1] # np=length(datap) lmr = lmom.ub(datap) nz=N-np
probzero=(nz)/N
probacum[,1]=probzero+(1-probzero)*cdfgno
(x,pargno(lmr)) for (isi in 1:N){
if (probacum[isi,1]<=0.5){sinal=sqrt(log(1/ probacum[isi,1]^2))
SPI1[isi,tempo]=-1*(sinal-(2.515517+0.802853*sinal+0.010328*sinal^2)/
(1+1.432788*sinal+0.189269*sinal^2+0.001308*sinal^3))}
else{sinal=sqrt(log(1/(1-probacum[isi,1])^2))
SPI1[isi,tempo]=sinal-(2.515517+0.802853*si nal+0.010328*sinal^2)/
(1+1.432788*sinal+0.189269*sinal^2+0.001308*sinal^3)}}}
SPI=as.matrix(cbind(t[inicio:fim,1], t[inicio:fim,2],SPI1)) # To visualize the results, type SPI
---Conclusions
1. The results of this study have provided evidences indicating that the drought early warning systems as well as the academic studies should re-evaluate the widespread use of the 2-parameter gamma distribution in the Standardized Precipitation Index (SPI) calculation algorithm.
2. Based on one of the largest rainfall records of Brazil (the
weather station of Pelotas, Rio Grande do Sul – 1896-2011)
this study also demonstrated that even for a particular location the assumption that a single distribution is always able to fit the rainfall amounts summed over several timescales may not be fulfilled.
3. The 2-parameter gamma distribution is not suitable for fitting the rainfall amounts summed over several timescales (1 to 24 months) and obtained from one of the longest rainfall records of Brazil (the weather station of Pelotas, Rio Grande do Sul).
4. Among all the probabilistic models evaluated from the rainfall data of Pelotas, Rio Grande do Sul – Brazil, the generalized normal distribution has presented the best performance in fitting the rainfall series.
5. The use of this 3-parameter distribution also resulted in the highest number of normally distributed SPI series.
Literature Cited
Abramowitz, M.; Stegun, I. A. Handbook of mathematical function.
New York: Dover Publications, 1965. 239p.
Asquith, W. H. Lmomco-L-moments, censored L-moments, trimmed L-moments, L-comoments, and many distributions: R package version 1.7.5, http://www.cran.r-project.org/package=lmomco, 30 Mar 2013. Blain, G. C. Revisiting the probabilistic definition of drought:
strengths, limitations and an agrometeorological adaptation.
Bragantia, v.71, p.132-141, 2012.
http://dx.doi.org/10.1590/S0006-87052012000100019
Blain, G. C. Revisiting the critical values of the Lilliefors test: towards the correct agrometeorological use of the Kolmogorov-Smirnov framework. Bragantia, v.73, p.192-202, 2014. http://dx.doi.
org/10.1590/S0102-77862009000100001
Blain, G. C.; Kayano, M. T.; Camargo, M. B. P. D.; Lulu, J. Variabilidade amostral das séries mensais de precipitação pluvial em duas regiões do Brasil: Pelotas-RS e Campinas-SP. Revista Brasileira de Meteorologia, v.24, p.1-11, 2009. http://dx.doi.org/10.1590/
S0102-77862009000100001
Blain, G. C.; Meschiatti, M. C. Using multi-parameters distributions to assess the probability of occurrence of extreme rainfall data. Revista Brasileira de Engenharia Agrícola e Ambiental, v.18,
Dutra, E.; Giuseppe, F. D.; Wetterhall, F.; Pappenberger, F. Seasonal forecasts of droughts in African basins using the Standardized Precipitation Index. Hydrology and Earth System Sciences, v.17, p.2359-2373, 2013. http://dx.doi.org/10.5194/hess-17-2359-2013 Fernandes, D. S.; Heinemann, A. B.; Paz, R. L. F.; Amorim, A. O.
Desempenho de índices quantitativos de seca na estimativa da produtividade de arroz de terras altas. Pesquisa Agropecuária Brasileira, v.45, p.771-779, 2010. http://dx.doi.org/10.1590/S0100-204X2010000800001
Guttman, N. B. On the sensitivity of sample L moments to sample size. Journal of Climatology, v.34, p.113-121, 1994. http://dx.doi.
org/10.1175/1520-0442(1994)007%3C1026:otsosl%3E2.0.co;2
Guttman, N. B. Accepting the “Standardized Precipitation Index”: a calculation algorithm index. Journal of the American Water Resources, v.35, p.311-322, 1999. http://dx.doi.
org/10.1111/j.1752-1688.1999.tb03592.x
Hayes, M. J.; Svoboda, M. D.; Wall, N.; Widhalm, M. The Lincoln Declaration on Drought Indices - Universal meteorological drought index recommended. Bulletin of the American Meteorological Society, v.92, p.485-488, 2011. http://dx.doi. org/10.1175/2010BAMS3103.1
Heo, J. H.; Shin, H.; Nam, W.; Om, J.; Jeong, C. Approximation of modified Anderson–Darling test statistics for extreme value distributions with unknown shape parameter. Journal of
Hydrology, v.499, p.41-49, 2013. http://dx.doi.org/10.1016/j. jhydrol.2013.06.008
Jain, S. K.; Keshri, R.; Goswami, A.; Sarkar, A. Application of meteorological and vegetation indices for evaluation of drought impact: A case study for Rajasthan, India. Natural Hazards, v.54,
p.643-656, 2010. http://dx.doi.org/10.1007/s11069-009-9493-x
Lloyd-Hughes, B. The impracticality of a universal drought definition.
Theoretical and Applied Climatology, v.117, p.607-611, 2014.
http://dx.doi.org/10.1007/s00704-013-1025-7
López-Moreno, J.; I.; Vicente-Serrano, S.; M. Positive and negative phases of the wintertime North Atlantic Oscillation and drought occurrence over Europe: A multitemporal-scale approach. Journal of Climate, v.21, p.1220-1242, 2008. http://dx.doi.org/10.1175/2007JCLI1739.1 McKee, T. B.; Doesken, N. J.; Kleist, J. The relationship of drought
frequency and duration to the time scales. In: Conference on Applied Climatology, 8, 1993, Anaheim. Proceedings…Boston: American Meteorological Society, 1993. p.179-184.
Morgan, E. C.; Lackner, M.; Vogel, R. M.; Baise, L. G. Probability distributions for offshore wind speeds. Energy Conversion and
Management, v.52, p.15-26, 2011. http://dx.doi.org/10.1016/j. enconman.2010.06.015
Queiroz, M. M. F.; Chaudhry, F. H. Análise de eventos hidrológicos extremos, usando-se a distribuição GEV e momentos LH. Revista Brasileira de Engenharia Agrícola e Ambiental, v.10, p.381-389,
2006. http://dx.doi.org/10.1590/S1415-43662006000200020
Razali, N. M.; Wah, Y. B. Power comparisons of Shapiro-Wilk, Kolmogorov-Smirnov, Lilliefors and Anderson-Darling tests. Journal of Statistical Modeling and Analytics, v.2, p.21-33, 2011.
Santos, J. F.; Portela, M. M.; Pulido-Calvo, I. regional frequency analysis of droughts in Portugal. Water Resources Manage,
v.25, p.3537-3558, 2011. http://dx.doi.org/10.1007/s11269-011-9869-z
Sen, A. K.; Niedzielski, T. Statistical characteristics of riverflow variability in the Odra River Basin, Southwestern Poland. Polish Journal of Environmental Studies, v.19, p.387-397, 2010. Shin, H.; Jung, Y.; Jeong, C. Assessment of modified Anderson–
Darling test statistics for the generalized extreme value and generalized logistic distributions. Stochastic Environmental
Research Risk Assessment, v.26, p.105-114, 2012. http://dx.doi. org/10.1007/s00477-011-0463-y
Sienz, F.; Bothe, O.; Fraedrich, K. Monitoring and quantifying future climate projections of dryness andwetness extremes: SPI bias.
Hydrology and Earth System Science, v.16, p.2143-2157, 2012. http://dx.doi.org/10.5194/hess-16-2143-2012
Stagge, J. H.; Tallaksen, L. M.; Gudmundsson, L.; Loon, A. F. van; Stahl, K. Candidate distributions for climatological drought indices (SPI and SPEI). International Journal of Climatology, DOI: 10.1002/
joc.4267, 2015. http://dx.doi.org/10.1002/joc.4267
Türkeş, M.; Tatli, H. Use of the standardized precipitation index (SPI) and a modified SPI for shaping the drought probabilities over Turkey. International Journal of Climatology, v.29, p.2270-2282,
2009. http://dx.doi.org/10.1002/joc.1862
Vicente-Serrano, S. M.; Beguería, S.; Lorenzo-Lacruz, J.; Camarero, J. J.; López-Moreno, J. I.; Azorin-Molina, C.; Revuelto, J.; Morán-Tejeda, E.; Sanchez-Lorenzo, A. Performance of drought indices for ecological, agricultural, and hydrological
applications. Earth Interactions, v.16, p.1-27, 2012. http://dx.doi.
org/10.1175/2012EI000434.1
Vlček, O.; Huth, R. Is daily precipitation Gamma-distributed? Adverse effects of an incorrect application of the Kolmogorov-Smirnov
test. Atmospheric Research, v.93, p.759-766, 2009. http://dx.doi. org/10.1016/j.atmosres.2009.03.005
Wilks, D. S. Statistical methods in the atmospheric sciences. San
Diego: Academic Press, 2011. 668p.
Wu, H.; Hayes, M. J.; Wilhite, D. A.; Svoboda, M. D. The effect of the length of record on the Standardized Precipitation Index calculation. International Journal of Climatology, v.25, p.505-520, 2005. http://dx.doi.org/10.1002/joc.1142
Wu, H.; Svoboda, M. D.; Hayes, M. J.; Wilhite, D. A.; Wen, F. Appropriate application of the Standardized Precipitation Index in arid locations and dry seasons. International Journal
of Climatology, v.27, p.65-79, 2007. http://dx.doi.org/10.1002/