Recebido para publicação em 25/11/2008 Aceito para publicação em 18/6/2009(003893)
1 Programa de Pós-graduação em Tecnologia de Alimentos, Setor de Tecnologia, Universidade Federal do Paraná – UFPR, Jardim das Américas, CP 19011, CEP 81531-990, Curitiba - PR, Brasil, E-mail: mestradoalimentos@gmail.com
*A quem a correspondência deve ser enviada
Stability studies and shelf life estimation of a soy-based dessert
Estudos de estabilidade e estimativa de vida de prateleira de sobremesa à base de soja
Daniel GRANATO1*, Maria Lucia MASSON1, Renato João Sossela de FREITAS1
1 Introduction
The production of lactose-free foods is necessary to offer new options for the consumers affected by lactose-intolerance. This affliction is present in more than 75% of the world-wide population, affecting roughly 28, 30, and 55% of the adult population in Brazil, in the United States of America, and in Mexico, respectively (ALM, 2002). In this context, it is observed an increased development of soy-based products not only due to their mineral and vitamin content (UNITED..., 2008), but also because they are good substitutes for milk in the diet for the lactose-intolerant consumers (SOLER, 2005).
Besides being suitable options for the lactose intolerants (POTTER et al., 2007), soy-based desserts mixed with fruit juices are a new trend of products that include soy-protein in the regular diet. The world-wide market of beverages and desserts
containing soy protein generated US$ 33 billion in 2000. In 2005, this figure was US$ 73.5 billion, and estimates target this
figure to reach US$ 167 billionafter 2010 with potential growth
of 10% yearly (RESEARCH AND MARKETS, 2007). In Brazil, the consumption of this type of food has increased gradually but sales usually never reach US$ 100 million. However, within the last 5 years, the industry has launched new types of foods, and the sales have thus increased 57.3% (ASSOCIAÇÃO..., 2008). This tendency in consuming soy-containing products is due to the consumer’s demand for healthy and practical products, and also due to new technologies that allow the production of tasty and good-looking foods.
Recently, the industry has been exploring more rigorously the use of dietary fibers such as those from oak, guava, inulin,
Resumo
Este trabalho objetivou a avaliação de parâmetros físico-químicos, físicos, cromáticos, microbiológicos e sensoriais de uma sobremesa não láctea, elaborada com soja e suco de goiaba, por sessenta dias de estocagem refrigerada, bem como estimar sua vida de prateleira através de testes de estabilidade. Acidez titulável, pH, cor instrumental, atividade de água, ácido ascórbico e estabilidade física da amostra foram mensurados, enquanto que provadores (n = 50) da comunidade universitária usaram uma escala hedônica para analisar a aceitação, intenção de compra, cremosidade, aroma, sabor, acidez, cor e aparência da sobremesa em um período de 60 dias. Os resultados mostraram que os parâmetros avaliados diferiram significativamente (p < 0,05) desde o início do armazenamento, sendo que puderam ser ajustados às equações matemáticas com coeficientes de determinação acima de 71%, considerando-os próprios para fins preditivos. Cremosidade e aceitação global da amostra não sofreram alteração significativa nos sessenta dias avaliados; e o sabor, o aroma e a acidez mantiveram notas dentro da faixa de aceitabilidade. Não obstante, a amostra apresentou boa estabilidade física e conteúdo de cobre, ferro e ácido ascórbico acima de 15% dos valores diários recomendados pela legislação brasileira. A estimativa de vida de prateleira do produto, levando em consideração a intenção de compra, índice de aceitação e aceitação global, foi de 79 dias.
Palavras-chave: vida de prateleira; emulsões; cor; oligofrutose; deficiência de lactase; Psidium guajava.
Abstract
This work is aimed at evaluating the physicochemical, physical, chromatic, microbiological, and sensorial stability of a non-dairy dessert elaborated with soy, guava juice, and oligofructose for 60 days at refrigerated storage as well as to estimate its shelf life time. The titrable acidity, pH, instrumental color, water activity, ascorbic acid, and physical stability were measured. Panelists (n = 50) from the campus community used a hedonic scale to assess the acceptance, purchase intent, creaminess, flavor, taste, acidity, color, and overall appearance of the dessert during 60 days. The data showed that the parameters differed significantly (p < 0.05) from the initial time, and they could be fitted in mathematical equations with coefficient of determination above 71%, aiming to consider them suitable for prediction purposes. Creaminess and acceptance did not differ statistically in the 60-day period; taste, flavor, and acidity kept a suitable hedonic score during storage. Notwithstanding, the sample showed good physical stability against gravity and presented more than 15% of the Brazilian Daily Recommended Value of copper, iron, and ascorbic acid. The product shelf life estimation found was 79 days considering the overall acceptance, acceptance index and purchase intent.
2 Materials and methods
2.1 Dessert design
The ingredients used to prepare 100 g of dessert were: soy water-soluble extract in a powder form (5.0 g), commercial sucrose (14.0 g), pool of emulsifiers (distillated monoglycerides, polysorbate 60, sorbitane monoesterate; 1.0 g), guar gum and carboximethylcelullose (ratio of 1:1; 1.0 g), guava natural flavoring (0.15 g), soy cream (18.67% fat; 40.0 g), oligofructose (95% purity; 2.63 g), red guava juice (45% of pulp; 32.0 g) guava juice in a powder form (2.10 g), and sodium benzoate (0.001 g). Water was added to complete 100 g of the product.
A lot containing 3.50 kg of the soy-based guava dessert was produced. For this purpose, after weighing all the ingredients individually, they firstly were mixed for 3 minutes at 9.000 rpm, except for the emulsifying agent; heated up to 80 °C in a water-bath for 20 seconds, and then cooled until 25 °C and homogenized following the addition of the emulsifying agent. The mixture was stirred using a mixer at 20 °C. During homogenization, a smooth cream was formed. The product obtained was packaged in individual polypropylene containers, each one with capacity of 250 g, sealed, and stored
in a refrigerator at 7 ± 1 °C with monitored temperature.
2.2 Physicochemical characterization
The physicochemical characterization was carried out for 60 days, on 1, 10, 20, 40, and 60 days after the homogenization process in order to evaluate the parameters’ behavior in relation to the cold storage. The pH values of the dessert were measured using a pH meter (Model 250A/610, Fisher Scientific Instruments, Pittsburgh – PA, USA). The total acidity was determined by titration against a 0.10 N NaOH solution and was expressed as a percentage of citric acid (ASSOCIATION..., 2000), whereas the ascorbic acid was quantified via titration against a 0.001 M solution of potassium iodate in accordance
with the 0364/IV method from the Instituto Adolf Lutz (BRASIL,
2005a). Water activity (Aw) at 20 °C was measured using a water activity analyzer (Model CX-2, Decagon Devices Inc, Pullman, WA, USA).
The chemical composition of the sample was determined by AOAC (ASSOCIATION..., 2000) methods, in triplicate: protein (920.152), fat (920.39), fibers (985.29), and ashes (940.26). Oligofructose was determined by theoretical calculation considering the level added to the formulation (Purity degree was certified by Orafti-Belgium by AOAC 997.08 method). The mean caloric value of the emulsion was determined using
the Atwater factors (4 kcal.g-1 for carbohydrates and proteins,
1.6 kcal.g-1 for oligofructose and 9 kcal.g-1 for total fat). Calcium, iron, magnesium, copper, manganese, zinc, potassium, and sodium were assayed, in triplicate, via atomic absorption spectroscopy (Model SpectrAA-200, Varian, Mulgrave, VC, Australia), whereas phosphorus was measured via molecular UV-VIS spectrophotometry (Model UV-1601, Shimadzu - Kyoto, Japan), according to the methodology of AOAC (ASSOCIATION..., 2000). In order to compare the results, the mineral content of some desserts marketed in Brazil oligofructose, lactulose, and others in order to develop products
such as biscuits, dairy infant formulas, cereal bars, yogurts, and frozen desserts with strong health claims. Dietary fibers have many beneficial physiological effects on health, such as helping manage constipation by improving the composition of intestinal flora (GIBSON et al., 2004), decreasing triacylglycerol and cholesterol levels in the blood (ALLIET et al., 2007), and preventing some types of cancer (REDDY; HAMID; RAO,
1997). Red guava (Psidium guajava L.) is a considerable source of
soluble fibers, ascorbic acid, bioactive flavonoids, and carotenoids (RODRIGUEZ-AMAYA; AMAYA-FARFAN; KIMURA, 2007), which have antioxidant and anticholesteremic properties. Thus, the addition of oligofructose and red guava juice in food products seems to be a good way to increase both the ingestion of dietary fibers and bioactive phytochemicals and also to boost consumer’s health.
A significant factor for the success of a food product is its shelf life, which is the period of time that it can be kept under parctical storage conditions and still retain acceptable quality. Shelf life can be affected by a number of different factors including the ingredients employed, the properties of the packaging material used, the quality of the package seal, and the storage conditions (VITALI; QUAST, 2004). Product quality is often mathematically modeled around multiple parameters such as physicochemical, microbiological, and colorimetric, being essential to the industry once it can generate, in a more accurate way, information regarding the preservation conditions of the products, and thus it is an important step in developing and testing new products (MANZOCCO; LAGAZIO, 2009).
Sensory methods are extremely important in determining desserts shelf life: an inaccurate estimate by a company can result in customers’ dissatisfaction, and therefore cause complaints and quality assurance problems. To study the consumers’ behavior and analyze their attitude toward stored food products, many quantitative and qualitative research techniques have been utilized in order to identify potential consumers and characterize their demands and expectations (TOMLINS et al., 2005). In shelf life studies, it is important to evaluate the behavior of all attributes that confer quality to the product such as texture, taste, appearance, and color during storage to assess the changes and to check if the products keep acceptable levels over time (LAWLESS; HEYMANN, 1999). In this regard, food industries have attempted
toidentifyandsatisfy the expectation of consumers in relation to
their products (MINIM, 2006).
Although there are some soy-protein-containing products in the Brazilian market, the ones suppressed of lactose are scarce. It is also observed the lack of studies on the evaluation of new lactose-free desserts. In a recent study conducted by Granato et al. (2008), the authors evaluated the combined effect of soy protein and guava juice on the sensory and physicochemical features of desserts, and they found that the test sample elaborated with 32% of guava juice and 2% of soy protein showed the best characteristics. However, they did not mention its shelf life stability evaluation during storage. Hence, this study is aimed at estimating the shelf life time of a soy-based dessert elaborated with red guava juice and oligofructose by means of stability studies for 60 days of
equation (Equation 4), where ∆a*= a* - a*0; ∆b*= b* - b*0; ∆L*=
L* - L*0; subscript ‘‘0’’ indicates initial color on day 1:
∆E= (∆a*2+∆b*2+∆L* )2 1 2/ (4)
Hue angle (h*), which measures the dessert’s dominant
color, was obtained using Equation 5:
h b
a
* *
* = tan−1
(5)
The equations and the color measurement followed the procedures outlined by Duangmal et al. (2008). Prior to measuring the color of the dessert sample, the spectrophotometer was calibrated using black and white reference standard ceramic plates (X = 78.9, Y = 83.9, Z = 88.9). The sample was then placed on a clear glass Petri dish, and color measurements were performed six times. The color of the dessert sample was reported as the mean value of the replicates.
2.5 Microbiological evaluation
For the microbiological assessments, 25 g of sample was added to 225 mL of sterile peptone water and blended in a Stomacher bag for 1 minute Aliquots were serially diluted with sterile 0.1% peptone water and pour plated. The sample was
examined for total and thermotolerant coliforms, Staphylococcus
aureus, Bacillus cereus, Salmonella sp., total mould, and yeast counts in agreement with the procedures described by American Public Health Association – APHA (AMERICAN..., 2001) and recommended by the Brazilian’s Legislation (BRASIL, 2001), based on dairy desserts and soy-based foods. All results were
expressed in CFU.g-1 or MPN.g-1 and Salmonella sp. was expressed
as ‘absent’ in 25 g.
2.6 Sensory assessment
Sensory analysis is a limiting factor to determine the acceptance critical point and also the product shelf life time. Indeed, sensory assessment is critical in stability tests once the product can be rejected by potential consumers for containing unacceptable attributes even before presenting microbiological risks or low content of nutrients (LAWLESS; HEYMANN, 1999; MINIM, 2006).
For the sensory evaluation on days 1, 20, 40, and 60 of storage, the rating test was used, in which the degree of liking of of visual color, flavor, taste, appearance, acidity, acceptance, and
creaminess were evaluatedusing a seven-point hedonic scale
anchored at both extremes: 1=“dislike much’’ and 7=‘‘like much’’. The purchase intent was also assessed using a five-point hedonic scale anchored ranging from 1=“certainly wouldn’t buy’’ and 5= “certainly would buy’’ (LAWLESS; HEYMANN, 1999).
A total of 50 untrained taste panelists (17 - 53 years old; 26 males and 24 females) from the campus community, who declared themselves frequent consumers of soy-containing products, were recruited at Federal University of Paraná. Prior to each assessment, the subjects were informed about the task for the test. In addition to the oral information, a detailed set of written instructions on the testing method was available in each booth. A 50 g portion of dessert at 7 °C was served to each and in the United States of America was assessed using both the
Brazilian Food Composition Table (UNICAMP, 2006) and the United States Food Composition Table (UNITED..., 2008).
2.3 Physical stability
Physical stability is generally related to the dessert shelf life when only gravitational forces are considered. Mittall (1971) proposed that an emulsion could be either reversibly or irreversibly physically unstable. Reversible instability can be subdivided into sedimentation and flocculation. Irreversible instability is indicated by coalescence, demulsification or breaking, and inversion.
In this study, two methods of dessert evaluation were used: the first was the Water Holding Capacity (WHC), and the other was the backscattering measurement (BS). Once the emulsification
process was finished, the temperature was set at 20 oC, and WHC
measurements were obtained, in triplicate, in order to analyze the destabilization of the soy-protein dessert. A sample of about 20 g (DS) was placed in a cylindrical glass measurement cell and centrifuged for 40 minutes at 5.000 rpm (Model 208N, Excelsior Baby, São Paulo - SP, Brazil) (REMEUF et al., 2003). The whey expelled (WE) was removed and weighed. The WHC, expressed in %, was defined by Equation 1:
WHC= 1 (DS−WE)
00
DS (1)
For backscattering assessment, the freshly prepared dessert (15 g) was transferred into cylindrical tubes (internal diameter
15 mm, height 120 mm), capped, and stored at 7± 1 °C. After 1,
20, 40, and 60 of storage,post-storage, the dessert was assessed
for stability against gravity by measuring the total height of the dessert (HE) and the height of the clear serum layer (HS) that may have formed. The backscattering under refrigeration, which measures stability, was determined in triplicate using Equation 2 in accordance with White et al. (2008):
BS= 1 HS 00
HE (2)
2.4 Instrumental color
The study of color degradation is important since color retention during storage is one of the parameters of food quality. The color degradation study was conducted by reflectance on days 1, 10, 20, 40, and 60 after the emulsification process
by determining the color parameters a*, b*, and L* using a
Hunterlab spectrophotometer (Model D25L-2, Hunter Assoc. Laboratory, Reston - VA, USA). The specular component included mode was selected because it estimates the real color
of the trial. L* is the lightness factor and represents the degree
of lightness or darkness of the sample; a* red(+)/green(-) and
b* yellow(+)/blue(-) are the chromaticity coordinates. The
chromaticity, C*, indicates the intensity of color was calculated
by Equation 3:
C*=
(
a*2+b*2)
1 2/ (3)Total color degradation (∆E) between the initial and final
Physicochemical and chromatic data were submitted to linear regression analysis and the goodness of fitting was
evaluated on the basis of statistical parameters of fitting (R2 and
probability level of the models). The models chosen were those that best fitted the experimental data and which presented the
higher coefficients of determination (R2). Pearson’s correlation
coefficients (r), which measure the strength of a link between two sets of data, were calculated for the determination of correlations among the results. The physicochemical analyses were carried out in triplicate; the results were expressed by the mean of the replicates for each parameter and the pooled standard deviation was also provided.
Sensory attributes and purchase intent data were submitted to linear regression and interpolation in order to estimate the dessert’s shelf life time. The parameters which presented coefficient of determination above 70% were taken into consideration once they can be used as purpose-predictors (BARROS NETO; SCARMINIO; BRUNS, 2007).
3 Results and discussion
3.1 Mineral and chemical composition
The dessert sample elaborated with 32% of red guava juice and
2% soy protein presented 9.74 mg (± 0.37).100 g-1 of ascorbic acid,
8.80 g (± 0.04).100 g-1 of total lipids, 3.34 g (± 0.03).100 g-1 of
dietary fiber (including 2.50 g.100 g-1 of oligofructose – theorical
data), 2.06 g (± 0.03).100 g-1 of protein, 0.66 g (± 0.003).100 g-1
of ash, 20.70 g (± 0.05).100 g-1 of total carbohydrate, and a mean
energetic value of 174.24 kcal.100 g-1. From these results, the
sample could be considered a good source of ascorbic acid and fibers (BRASIL, 2005b).
As can be observed in Table 1, the dessert presented a good profile of minerals and, in accordance with the Brazilian Legislation (BRASIL, 2005b), it can be considered a source of iron and copper once it contains more than 15% of the daily recommended value of intake in a portion of 100 g. The dessert also presented a good amount of phosphorus, zinc, magnesium, and manganese and a low quantity of sodium, which is important for those people who need to consume low levels of this mineral. According to Cozzolino (2007), food products containing minerals in enough quantities to be considered a source are suitable options for people who need to increase the intake of such elements.
Comparing the mineral content of the soy-based dessert containing guava to other Brazilian and North-American commercial products, higher amount of iron and copper can be observed. An orchid-tuber-based dessert presented higher
values of calcium (130 mg.100 g-1), magnesium (39 mg.100 g-1),
phosphorus (139 mg.100 g-1), and zinc (0.80 mg.100 g-1) in
comparison to the dessert analyzed in this study (AYAR; SERT; AKBULUT, 2009). Izidoro et al. (2008) developed emulsions containing banana pulp in different concentrations and found great amount of minerals in the trials, but they presented lower
levels (mg.100 g-1) of calcium (6.61 to 10.65), phosphorus
(0.46-5.37), magnesium (9.0-10.54), and iron (0.57-0.64), while the subject in coded opaque plastic tumblers. Mineral water and
cream cracker biscuits were available as neutralizers.
The tests were performed in the sensory laboratory under
conditions of standard light and temperature (20 oC) with 3 - 5
subjects during each session placed in individual booths in the morning, from 10 - 12 a.m., and in the afternoon, from 2 - 5 p.m. The same subjects were used in all the steps of the sensory evaluation, so accurate data collection could be obtained. The study was approved by the Federal University of Paraná Ethics Research Committee in accordance with the Resolution 196/1996 of the National Health Council.
2.7 Kinetic parameters
Kinetic modeling may be employed to predict the influence of processing on critical quality parameters such as instrumental color and physicochemical features, and it is a convenient tool to evaluate and predict instrumental data (CULLEN et al., 2008).
The data obtained from the instrumental color and ascorbic acid content were adjusted to equations that would describe the evolution of these parameters. These equations would predict their evolution by using kinetic models, which were developed using a two-step procedure. Reaction rate constants were determined by fitting the experimental data to first-order (Equation 6) kinetic model as outlined by Cullen et al. (2008):
C= C0ekt (6)
where C is the studied parameter (L*, a*, b*, h*, ascorbic acid content) at any given reaction time, C0 is their initial value,
and k is a rate constant. In the second step, the rate constants
were modeled as a function of the refrigerated storage time. Data fitting was considered to be significant at a probability level of 95%.
The half-life value (t1/2) is a model independent term in that describes the time it takes for a parameter to fall to half the original value. It was calculated using the kinetic constant (k) according to the Equation 7 outlined by Zhang et al. (2008):
t 693
k
1 2/
.
= 0 (7)
2.8 Statistical analysis and shelf life estimation
The results from the physicochemical and rating tests were initially submitted to the Hartley’s test to check for the
homogeneity of the variances adopting an α value of 0.01.
(2009) verified significant decrease of pH values in orchid-based desserts, very well accepted products in Turkey. Nikaedo, Amaral and Penna (2004) developed whey protein-based desserts and found pH values ranging from 5.77 and 7.15, whereas higher pH values were found (4.91 – 6.05) in dairy desserts containing red guava juice (32%) compared to that analyzed in this study (BURITI; KOMATSU; SAAD, 2007).
Water activity varied significantly (p < 0.001) from 0.977 to 0.984 increasing after the 20th day of storage. This tendency could be due mainly to two reasons: the equilibrium between the outside of the package with its inside; and polypropylene did not show efficiency in hindering the oxygen entrance in the package. Food product manufacturers are interested in water activity, an important property that can be used to predict stability and safety of foods. Water activity describes its water energy status, and hence its availability to act as a solvent and participate in chemical or biochemical reactions. Water activity, not water content, determines the lower limit of available water for microbial growth, and it plays a role not only in the appearance, texture and smell of a food, but also in its shelf life time (GABRIEL, 2008).
The values of titrable acidity increased (p < 0.001) during storage and the mathematical model adjusted 96.81% of the data, as shown in Table 3, suggesting that the model can be used as a purpose-predictor in the time length studied. There is a hypothesis that certain types of packages such as polypropylene and low density polyethylene can increase the acidity of the food content of potassium (78.11-95.85) and sodium (500.73-537.12)
was higher than the soy-based dessert evaluated in this study.
3.2 Physicochemical and colorimetric stability
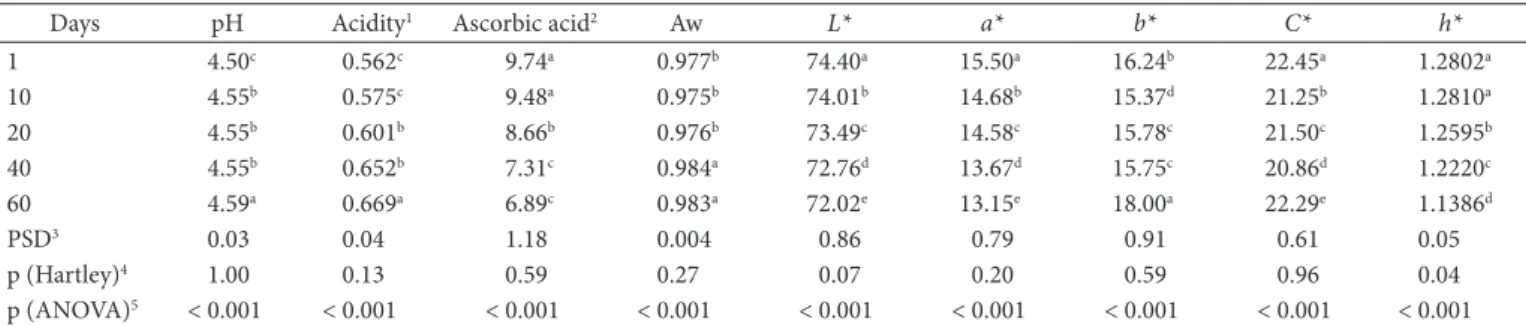
Significant differences (p < 0.001) were obtained in all physicochemical parameters evaluated in the dessert sample during the time studied (Table 2). Moreover, the variances were homogenous (p > 0.05) which further validates the experimental results.
The ascorbic acid content ranged from 9.74 to 6.89 mg.100
g-1, which represents 21.64 and 15.31% of the daily recommended
value of intake (DRV) in accordance with the Brazilian Legislation (BRASIL, 2005a), showing that even after 60 days of cold storage the dessert preserved the content of ascorbic acid in enough quantity to be considered a source. The regression model seemed to be essentially linear with a high coefficient of determination (Table 3) fitting satisfactorily the experimental data. According to Carvalho (2005), the ascorbic acid degradation in processed foods is due to reactions caused by oxygen in the package. In addition, the ascorbic acid degradation may be due to the air incorporated in the emulsification process.
The pH values varied significantly (p < 0.001) from the
first (pH = 4.50) to the 20th day (pH = 4.55) and maintained
stable for thirty days, whereas the pH value reached 4.59 on the sixtieth day. The polynomial regression model adjusted 85% of the experimental results (Table 3). Ayar, Sert and Akbulut
Table 1. Mean mineral content (mg.100 g-1) of the soy-based dessert (32% of red guava juice and 2% of soy protein) compared to other desserts
marketed in the USA and in Brazil.
Mineral Soy-based dessert
Frozen chocolate dessert1
Chocolate pudding1
Vanilla non-dairy dessert1
Strawberry petit-suisse2
Chocolate soy-based dessert2
DRV3
Calcium 68.41 72.00 103.05 0.90 731.00 15.08 1000
Iron 2.13 0.73 0.27 0.08 0.10 1.48 14.00
Potassium 57.05 160.00 168.02 4.31 121.00 44.52 4700
Sodium 62.25 75.00 283.67 6.03 412.00 78.02 1500
Manganese 0.07 NS NS NS 0.02 <0.001 2.30
Copper 0.14 NS NS NS 0.01 0.13 0.90
Phosphorus 76.32 NS NS NS 448.00 40.71 700.00
Magnesium 16.24 NS NS NS 27.00 13.35 260.00
Zinc 0.36 NS NS NS 2.70 0.27 7.00
1Data from the USDA (UNITED..., 2008); 2Data from TACO (UNICAMP, 2006); 3Daily Recommended Value for adults ≥ 19 years-old (BRASIL, 2005b); NS = Not specified.
Table 2. Physicochemical and chromatic stability of the soy-based dessert during the 60 days of evaluation.
Days pH Acidity1 Ascorbic acid2 Aw L* a* b* C* h*
1 4.50c 0.562c 9.74a 0.977b 74.40a 15.50a 16.24b 22.45a 1.2802a
10 4.55b 0.575c 9.48a 0.975b 74.01b 14.68b 15.37d 21.25b 1.2810a
20 4.55b 0.601b 8.66b 0.976b 73.49c 14.58c 15.78c 21.50c 1.2595b
40 4.55b 0.652b 7.31c 0.984a 72.76d 13.67d 15.75c 20.86d 1.2220c
60 4.59a 0.669a 6.89c 0.983a 72.02e 13.15e 18.00a 22.29e 1.1386d
PSD3 0.03 0.04 1.18 0.004 0.86 0.79 0.91 0.61 0.05
p (Hartley)4 1.00 0.13 0.59 0.27 0.07 0.20 0.59 0.96 0.04
p (ANOVA)5 < 0.001 < 0.001 < 0.001 < 0.001 < 0.001 < 0.001 < 0.001 < 0.001 < 0.001
alteration of the b* coordinate is correlated positively to the loss of lightness (r = 0.677) and to the increase of color intensity
(r = 0.684). The decrease of a* coordinate values correlated
closely with the lightness values (r = 0.980) and with the hue angle (r = 0.901).
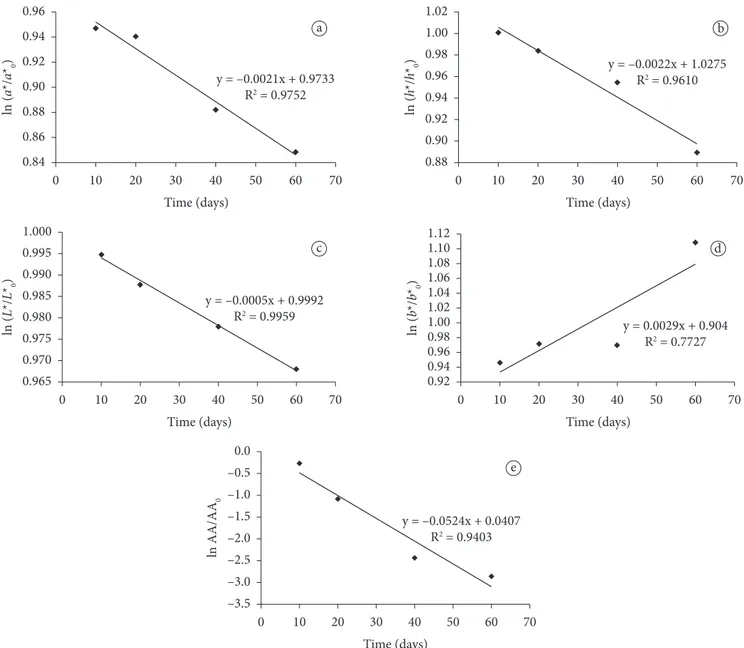
Table 4 shows the first-order kinetic and statistical parameters for the degradation of the instrumental color and ascorbic acid content during the cold storage. With regard to
the coefficient of determination (R2), it can be stated that the
experimental data adjustments are suitable for estimating such
parameters. The relative degradation of a/a*0 (Figure 2a) and
h*/h*0 (Figure 2b) coordinates is related to the decrease in
redness, the L*/L*0 decrease is related to the loss of lightness
(Figure 2c), C*/C*0 is related to the decrease of color intensity,
and b*/b*0 (negative value) is related to the increase of yellowness in the dessert sample (Figure 2d). The relative decrease of ascorbic acid (AA) content (Figure 2E) can also be explained by first-order kinetic with a half-life time of almost 120 days
and a rate constant of 0.00578 days-1. The degradation of the
instrumental color parameters as well as the ascorbic acid content followed first-order kinetic behavior just like other food products such as kiwifruit (DEMCZUK JUNIOR et al., 2008) and orange juice treated with ozone (CULLEN et al., 2008).
Pearson correlation was carried to understand the
relationship between a* coordinate (redness) and ascorbic
acid content, and a significant (p < 0.05) value of r = 0.963 was found. This result indicates the protector influence of the ascorbic acid in the red pigments found in the dessert. Thus,
product due to the hydration of CO2 present inside the package
producing HCO3- and H+ and thus increasing the concentration
of acids in the matrix. Saad et al. (2007) developed desserts with cocoa, chocolate, and inulin and verified that both water activity and titrable acidity did not change (p > 0.05) during 28 days of cold storage.
With regard to the instrumental color, statistical differences (p < 0.001) were obtained for all parameters in relation to the storage time (Table 2). The goodness of the fit for the physicochemical and chromatic data was tested by the R squared
(R2) which showed values within the range of 0.745 - 0.994 for
all systems. Furthermore, the values of ∆a*, ∆L*, ∆h*, and ∆E
presented linear fading during the 60 days of storage (Table 3), which indicates well-adjusted models. In a general way, color changes (fades) in a stored food product due to oxidation reactions involving carotenoids, lipids, and enzymes (VITALI; QUAST, 2004). The models presented suitable coefficients of determination, which further validated the experimental data. The coefficient of determination is defined as the ratio of the explained variation to the total variation, and it is a measurement
of the degree of fitness. A small value of R2 indicates a poor
relevance of the dependent variable in the model (WANG et al., 2008).
The joint evaluation of the change in L*, a*, and b*
coordinates was done throughout the estimation of ∆E. The
decrease of the L*, a*, and b* values resulted in significant (p < 0.05) ∆E increase over time probably as a result of the combined effect of the different deteriorative reactions occurring
during storage. Figure 1 shows that ∆E > 2 was obtained after
the 40th day of storage. Francis and Clydesdale (1975) indicated
that the perceivable differences in color can be analytically classified as very distinct (∆E > 3), distinct (1.5 < ∆E < 3), and small difference (∆E < 1.5).
With regard to the b* coordinate (yellowness), it was
observed significant (p < 0.05) increase after the 20th day of storage; however, the experimental data could not be fitted by any regression model. Such increase was probably due to carotenoid degradation making the sample more yellow. The
Table 3. Mathematical models adjusted to the experimental data
(physicochemical, chromatic, and sensory), their coefficient of determination, and probability levels.
Parameter Regression equation R2 (%) p-value1
Ascorbic acid Y = –0.052t + 9.764 96.04 < 0.001
pH Y = 4.500t0.004 85.01 0.06
Water activity Y =–7E-09t2 + 0.0001t + 0.9751 71.93 0.07
Titrable acidity Y = 0.002t + 0.561 96.81 < 0.001
∆C* Y = 0.001t2 – 0.0063t - 0.531 74.50 0.43
∆L* Y = –0.041t - 0.249 99.03 < 0.001
∆a* Y = 0.031t - 0.544 99.42 < 0.001
∆h* Y = –0.028t + 0.039 96.87 0.01
∆E* Y = 0.053t + 0.644 97.58 0.01
Purchase intent Y = 0.011t + 3.989 83.80 0.08 Overall acceptance Y = –0.0076t + 5.691 82.86 0.09 Acceptance index Y = –0.0042t2 + 0.1094t + 90.864 99.42 0.02
1probability level in relation to the time studied.
Table 4. Statistical and first-order kinetic parameters of the instrumental
color and ascorbic acid content during storage.
Parameters First-order kinetic parameters Statistical parameters k (days-1) t
1/2 (days) R2 (%) p-value1
Lightness 0.000542 1278.91 77.27 < 0.05
a*coordinate 0.00274 252.89 97.52 < 0.05
b* coordinate 0.00171 404.10 99.59 < 0.05
h* angle 0.001954 354.73 96.10 < 0.05
Ascorbic acid 0.00578 119.83 94.03 < 0.05 1p = probability level in relation to the time studied.
Figure 1. Total color degradation (∆E) of the dessert sample over
network among the proteins, which eventually would prevent any further coalescence or phase break (ROMERO et al., 2008). Nevertheless, the coalescence mechanism seems to be limited to the first storage stage (48 hours) after emulsification (PALAZOLO; SORGENTINI; WAGNER, 2005).
Ayar, Sert and Akbulut (2009) observed that the higher the concentration of orchid root present in desserts, the more stable they became due to the presence of glucomananes,
compounds that absorb 200 mL of water/g–1. Gums, like
carboxymethylcellulose and guar, are considered stabilizers once they increase considerably the stability of emulsion systems (GARTI; LESER, 2001). The stabilizers interact with soy protein, water, and lipids forming one interlinked structure and thus providing more viscosity to the food and preventing sinerisis by immobilizing the water in the matrix (VERBEKEN; THAS; DEWETTINCK, 2004).
partial degradation in a* coordinate could be partially due to
the decrease of ascorbic acid content. Similar data were found in a colorimetric study with kiwifruit, in which Demczuk Junior et al. (2008) concluded that the degradation of the green color was strongly correlated to the decrease of the ascorbic acid content.
3.3 Physical stability
Through macroscopic evaluation, it was observed that the sample did not present aqueous layer at the bottom of the glass tubes over the time studied proving that the concentration of the emulsifier was good enough to prevent instability, formation of two phases, and thus backscattering during the 60 days evaluated. Additionally, the Water Holding Capacity (WHC) was 100% in all the evaluations. Indeed, storage at low temperature may promote the development of a three-dimensional connective
Figure 2. Relative color degradation based on the a) a/a*0; b) h*/h*0; c) L*/L*0; d) b*/b*0 coordinates and relative decrease of Ascorbic Acid (AA);
that it is strongly associated to a* coordinate (r = 0.809), to the hue angle (r = 0.876), to chromaticity degradation (r = 0.561),
and to the ∆E (r = 0.919). Assembling consumer panels for
shelf life assessment is expensive, not routinely performable by food companies, and definitely not consistent with industrial needs in competitive markets. It would be easier assessing instrumental (pH, water activity, and color parameters) whose evolution is correlated to consumer acceptability. Actually, once the instrumental parameters have been evaluated by correlation with sensory attributes, further time-costing consumer tests can be skipped and the detection of such indexes may be routinely applied to evaluate shelf life in the industry quality control programs (CALLIGARIS et al., 2007).
The taste remained above the acceptance critic limit (5.00 – slightly liked) during the 60 days of storage. Using the Pearson correlation, it can be assumed that taste is related to appearance (r = 0.925) and acceptance (r = 0.771) showing that the evaluation of the sensory attributes by a taste panel is a multidimensional task and many sensory perceptions are taken into consideration in order to define characteristics of a food. In fact, taste may influence food market habits, and according to with Luckow and Delahunty (2004), consumers judge the acceptability of a product based on taste rather than on other attributes such as health benefits. Indeed, taste is important for functional foods, especially for the ones elaborated with soy ingredients due to the astringent flavor they usually present. Hence, the development of palatable desserts combining functional ingredients such as oligofructose, red guava juice, and soy protein could lead to an increased consumption of foods that may boost consumer’s health and well-being.
With regard to creaminess, a gradual insignificant (p = 0.17) increase was perceived by the taste panel in relation to the storage time. According to with Lawless and Heymann (1999) and Ayar, Sert and Akbulut (2009), creaminess is extremely important to emulsion-like products such as desserts by incorporating a higher sensory appeal, and it can be used as a quality indicator by industries. Creaminess can be defined as a complex sensation produced in the mouth, and it is one attribute that influences the purchase of many foods such as dressings, ice-creams, mayonnaise, and desserts (RICHARDSON-HARMAN et al., 2000).
3.4 Microbiological stability
The dessert sample presented low counts of total and
thermotolerant coliforms (< 3 MPN.g-1), Staphylococcus aureus
(< 102 MPN.g-1), Bacillus cereus (< 102 MPN.g-1), molds and yeasts (< 102 CFU.g-1), and it did not present Salmonella sp. in 25 g during the 60 days of evaluation, being in accordance with the Brazilian microbiological standard of foods (BRASIL, 2001). Therefore, it can be concluded that the sample was microbiologically safe for sensory assessment.
The microbiological quality of the product indicates the hygiene conditions of the processing, suitable and efficiency of the thermal treatment conducted, and the sodium benzoate. Cold storage temperatures (< 10 °C) help to decrease the microbial development, biochemical, and enzymatic reactions in the food matrix keeping the good quality and thus increasing food safety (ORDÓÑEZ, 2005).
3.5 Sensory attributes
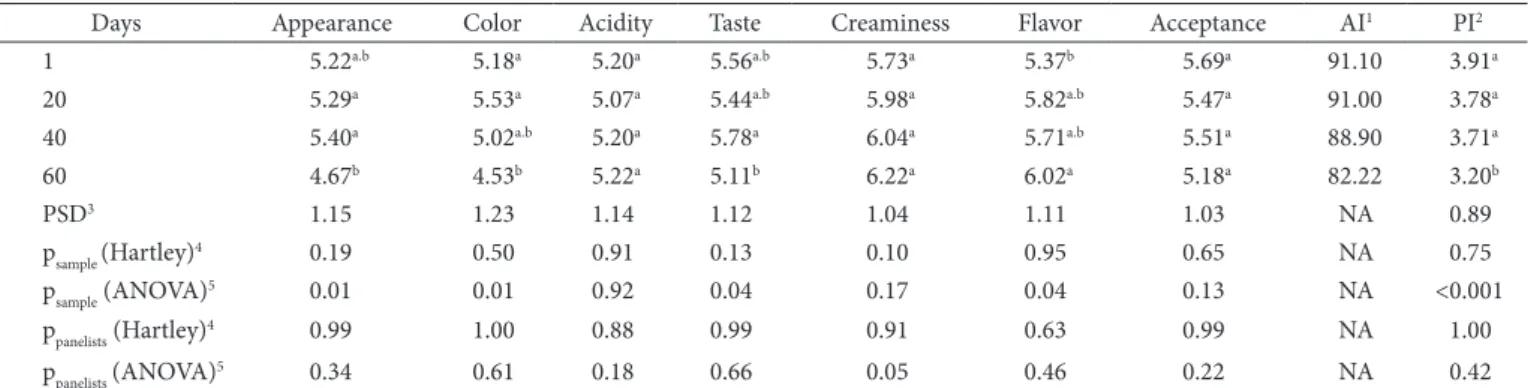
Table 5 shows that there was significant (p < 0.05) difference in appearance, color, taste, and flavor in the 60 days of refrigeration storage. There was a consensus among the taste panel ratings in
accordance with the analysis of variance (ppanelists ≥ 0.05), and the
hedonic scores seemed to be homogenous when the Hartley test was applied (psamples > 0.01).
In order to be considered acceptable, the food product must present scores above or equal to 5.00 (Liked slightly) when a seven-point hedonic scale is used. Thus, in accordance with this criterion, only the attributes appearance and color did not remain acceptable after 60 days of storage. It was observed that the visual color is directly correlated to appearance (r = 0.786), taste (r = 0.502) and acceptance (r = 0.679), whereas the decrease in the appearance hedonic score is related to the decrease of acceptance (r = 0.798) and taste (r = 0.925).
In food products, color and appearance are the main attributes that influence the consumer’s opinion and perceptions of taste, flavor, and acceptance, so they are two major factors that drive consumers to the chronic purchase of such foods (MINIM et al., 2008). The visual color was correlated to the instrumental color degradation, during the 60 days of storage, and it was observed
Table 5. Sensory evaluation of the dessert sample during the 60 days of storage at 7 ± 1 °C.
Days Appearance Color Acidity Taste Creaminess Flavor Acceptance AI1 PI2
1 5.22a.b 5.18a 5.20a 5.56a.b 5.73a 5.37b 5.69a 91.10 3.91a
20 5.29a 5.53a 5.07a 5.44a.b 5.98a 5.82a.b 5.47a 91.00 3.78a
40 5.40a 5.02a.b 5.20a 5.78a 6.04a 5.71a.b 5.51a 88.90 3.71a
60 4.67b 4.53b 5.22a 5.11b 6.22a 6.02a 5.18a 82.22 3.20b
PSD3 1.15 1.23 1.14 1.12 1.04 1.11 1.03 NA 0.89
psample (Hartley)4 0.19 0.50 0.91 0.13 0.10 0.95 0.65 NA 0.75
psample (ANOVA)5 0.01 0.01 0.92 0.04 0.17 0.04 0.13 NA <0.001
ppanelists (Hartley)4 0.99 1.00 0.88 0.99 0.91 0.63 0.99 NA 1.00
ppanelists (ANOVA)5 0.34 0.61 0.18 0.66 0.05 0.46 0.22 NA 0.42
1AI = acceptance index (%); 2PI = purchase intent; 3PSD = pooled standard deviation (n = 50); 4Probability values obtained by Hartley test (F max) for homogeneity of variances; 5Probability
such as dairy desserts and fermented milk need to be consumed in a period of 30 days after their production, so taking this example into account, it is easy to assume that 79 days is a suitable time for the product’s shelf-life time. For food industries, the most important fact is not the punctual determination of the shelf life time, but rather to assure that this time is longer than the logistic, distribution, and consumption of such product.
When a food distributor sets maximum length of storage
requirements, good judgment must be used to selectthe most
appropriate time within the shelf life range.Selecting a short
shelf life time could mean financial losses for destroying
over-aged product, special handling, packaging materials and,
perhaps,controlled temperature storage. An error, on the other
hand, could mean loss of repeat sales because of disappointed customers. In accordance with the industry’s internal politics, the choice of acceptance critical limit and the rejection index of products are very important to launch or keep them in the market. Hence, rigourous studies must be carried to evaluate the microbiological, chemical, and sensory stability of foods during a period of time to ensure their main quality and consumer’s satisfaction (MANZOCCO; LAGAZIO, 2009).
4 Conclusions
The product elaborated with 32% of red guava juice and 2% of soy protein can be a considerable source of copper, iron, ascorbic acid, and dietary fibers, and it presented suitable sensory scores for the taste, flavor, and creaminess attributes that consumers considered to be essential in a food product. Even after 60 days of controlled storage at 7 ± 1 °C, the product remained acceptable with adequate scores of creaminess, taste, acidity, and flavor; it preserved its low counts of bacteria, yeasts and molds as well as its ascorbic acid content. In a general way, the physicochemical parameters changed significantly during storage and the data could be fitted by models with high coefficients of determination. With regard to the estimation of shelf life, in accordance with the regression models of purchase intent, acceptance index, and overall acceptance, which represent the main intrinsic key-quality factors for soy-based foods, the time of 79 days would be the highest acceptable limit for this product under the experimental conditions employed.
Acknowledgements
The authors are grateful for the financial support provided by CAPES (Brazilian research supporting foundation).
References
ALLIET, P. et al. Effect of prebiotic galacto-oligosaccharide, long-chain fructo-oligosaccharide infant formula on serum cholesterol and triacylglycerol levels. Nutrition, v. 23, n. 10, p. 719-723, 2007. ALM, L. Lactose intolerance. In: ROGINSKY, H.; FUQUAY, J. W.;
FOX, P. F. Encyclopedia of dairy sciences. London: Academic Press, 2002. p. 1533-1537.
AMERICAN PUBLIC HEALTH ASSOCIATION - APHA.
Compendium of methods for the microbiological examination
of foods. 4. ed. Washington, DC, 2001. 676 p.
The acceptance values did not change statistically (p = 0.13) during the 60 days of storage, which means, in a general way, the sensory quality of the dessert sample maintained stable. Acceptance determination is crucial when a new formulation is developed and it is one of the most important features to characterize and control the quality of food products (MINIM et al., 2008). However, acceptance is not the only attribute that industries take into account; taste, flavor, acidity, sweetness, color, and texture are some other factors that are assessed to obtain great and acceptable sensory characteristics.
A frozen wild blueberry dessert developed with soy cream and soy isolate protein presented 73.7% of acceptance (THE; DOUGHERTY; CAMIRE, 2005). A non-dairy frozen dessert containing soy isolate protein, coconut milk, and strawberry cheesecake flavor presented 96.33% of acceptance and 82.57% of purchase intent, whereas a fermented soy-based dessert containing various flavors presented purchase intent above 94% (HEENAN et al., 2004). A blueberry beverage, containing soy protein, presented acceptance index above 70% (POTTER et al., 2007), a soy-protein fermented dessert supplemented with oligofructose and inulin obtained acceptance index of more than 70% (HAULY; FUCHS; PRUDENCIO-FERREIRA, 2005). These data indicate that consumers are eagerly accepting soy-containing products in their conventional diet and are willing to purchase them not only due to the health benefits they may promote, but also because of their good taste, flavor, and appearance (SOLER, 2005),
It was verified that the purchase intent remained between ‘I would maybe buy’ and ‘I would probably buy’, which is favorable once there is no similar product in the Brazilian market. The purchase intent was correlated to appearance (r = 0.881), color (r = 0.847), and overall acceptance (r = 0.964) proving that the evaluated attributes are good quality-indicators of soy-based dessert with guava juice. Behrens and Silva (2004) studied consumers’ behavior and attitude toward launching soy derivative products in the marketplace and concluded that food industries should work on marketing the health benefits in order to create positive expectation on consumers and thus stimulate the purchase and consumption of such products.
3.6 Shelf life estimation
GRANATO, D. et al. Iron and carotenoid content of sweet emulsions developed with oligofructose, soy cream and red guava juice. In: CONGRESSO BRASILEIRO DE CIÊNCIA E TECNOLOGIA DE ALIMENTOS, 21, 2008, Belo Horizonte. Anais… Belo Horizonte: CBCTA, 2008. p. 56-59.
HAULY, M. C. O.; FUCHS, R. H. B.; PRUDENCIO-FERREIRA, S. H. Soymilk yogurt supplemented with fructooligosaccharides: probiotic properties and acceptance. Brazilian Journal of
Nutrition, v. 18, n. 5, p. 613-622, 2005.
HEENAN, C. N. et al. Survival and sensory acceptability of probiotic microorganisms in a non fermented frozen vegetarian dessert. Food
Science and Technology, v. 37, p. 361-366, 2004.
IZIDORO, D. R. et al. Influence of green banana pulp on the rheological behaviour and chemical characteristics of emulsions (mayonnaises).
Food Science and Technology, v. 41, n. 6, p. 1018-1028, 2008.
LAWLESS, H. T.; HEYMANN, H. Sensory evaluation of food:
principles and practices. Gaithersburg: Aspen, 1999. 827 p. LUCKOW, T.; DELAHUNTY, C. Which juice is ‘healthier’? A consumer
study of probiotic non-dairy juice drinks. Food Quality and
Preference, v. 15, p. 751-759, 2004.
MANZOCCO, L.; LAGAZIO, C. Coffee brew shelf life modeling by integration of acceptability and quality data. Food Quality and
Preference, v. 20, n. 1, p. 24-29, 2009.
MINIM, V. P. R. Análise sensorial: estudo com consumidores. Viçosa: UFV, 2006. 225 p.
MINIM, V. P. R. et al. Effects of coating on the acceptability of baby-carrots. Semina: Ciências Agrárias, v. 29, n. 3, p. 591-596, 2008. MITTALL, K. L. Conceptual clarification of the terms used to describe
emulsion behavior. Journal of Cosmetology Chemistry, v. 22, n. 1, p. 815-817, 1971.
NIKAEDO, P. H. L.; AMARAL, F. F.; PENNA, A. L. B. Caracterização tecnológica de sobremesas lácteas achocolatadas cremosas elaboradas com concentrado protéico de soro e misturas de gomas carragena e guar. Revista Brasileira de Ciências Farmacêuticas, v. 40, n. 3, p. 397-404, 2004.
ORDÓÑEZ, J. A. Tecnologia de Alimentos. Porto Alegre: Artmed, 2005. v. 1.
PALAZOLO, G. G.; SORGENTINI, D. A.; WAGNER, J. R. Coalescence and Flocculation in o/w emulsions of native and denatured whey soy proteins in comparison with soy protein isolates. Food
Hydrocolloids, v. 19, p. 595–604, 2005.
POTTER, R. M. et al Characteristics of wild blueberry–soy beverages.
Food Science and Technology, v. 40, n. 5, p. 807-814, 2007.
REDDY, B. S.; HAMID, R.; RAO, C. V. Effect of dietary oligofructose and inulin on colonic preneoplastic aberrant crypt foci inhibition.
Carcinogenesis, v. 18, n. 1, p. 1371-1374, 1997.
REMEUF, F. et al. Preliminary observations on the effects of milk fortification and heating on microstructure and physical properties of stirred yogurt. International Dairy Journal, v. 13, n. 9, p. 773-782, 2003.
RESEARCH AND MARKETS. Functional foods market assessment
2007. Disponível em: <www.researchandmarkets.com/reports/>.
Acesso em: 27 jul. 2008.
RICHARDSON-HARMAN, N. J. et al. Mapping consumer perceptions of creaminess and liking for liquid dairy products. Food Quality
Preference, v. 11, n. 3, p. 239-246, 2000.
RODRIGUEZ-AMAYA, D. B. A.; AMAYA-FARFAN, J.; KIMURA, M. Carotenoid composition of brazilian fruits and vegetables. Acta
Horticulturae, v. 744, n. 1, p. 409-416, 2007.
ASSOCIAÇÃO BRASILEIRA DE INDÚSTRIAS DE ALIMENTOS - ABIA. Alimentos funcionais: tendências de mercado. Disponível em: <http://www.abia.org.br/noticias.asp>. Acesso em: 12 set. 2008.
ASSOCIATION OF OFFICIAL ANALYTICAL CHEMISTS - AOAC.
Official methods of analysis of AOAC international.17. ed.
Gaithersburg, 2000.
AYAR, A.; SERT, D.; AKBULUT, M. Effect of salep as a hydrocolloid on storage stability of Incir Uyutmasi dessert. Food Hydrocolloids, v. 23, n. 1, p. 62-71, 2009.
BARROS NETO, B.; SCARMINIO, I. S.; BRUNS, R. E. Como fazer
experimentos. 3. ed. Campinas: Unicamp, 2007. 480 p.
BEHRENS, J. H.; SILVA, M. A. A. P. Atitude do consumidor em relação à soja e produtos derivados. Ciência e Tecnologia de Alimentos, v. 24, n. 3, p. 431-439, 2004.
BRASIL. Ministério da Saúde. Instituto Adolfo Lutz. Métodos
físico-químicos para análise de alimentos. 4. ed. Brasília, 2005a.
BRASIL. Ministério da Saúde. Secretaria Nacional de Vigilância Sanitária. Resolução RDC nº 12, 02 de janeiro de 2001. Regulamento técnico sobre padrões microbiológicos para alimentos. Diário
Oficial da União, 2001. 20 p.
BRASIL. Ministério da Saúde. Secretaria Nacional de Vigilância Sanitária. Regulamento técnico sobre a ingestão diária recomendada (IDR) de proteína, vitaminas e minerais. Resolução RDC nº 269, 22 de setembro de 2005. Diário Oficial da União, 2005b. 4 p. BURITI, F. C. A.; KOMATSU, T. R.; SAAD, S. M. I. Activity of passion
fruit (Passiflora edulis) and guava (Psidium guajava) pulps on
Lactobacillus acidophilus in refrigerated mousses.Brazilian Journal
of Microbiology, v. 38, n. 2, p. 315-317, 2007.
CALLIGARIS, S. et al. Shelf life modelling of bakery products by using oxidation indices. Journal of Agriculture and Food Chemistry, v. 55, n. 5, p. 2004-2009, 2007.
CARVALHO, J. M. Bebidas à base de água de coco e suco de caju: processamento e estabilidade. 2005. 107 p. Dissertação (Mestrado) – Universidade Federal do Ceará, Fortaleza, 2005.
COZZOLINO, S. M. F. Deficiências de minerais. Estudos Avançados, v. 21, n. 60, p. 50-55, 2007.
CULLEN, P. J. et al. Kinetics of freshly squeezed orange juice quality changes during ozone processing. Journal of Food Agriculture and
Food Chemistry, v. 56, n. 15, p. 6416-6422, 2008.
DEMCZUK JUNIOR, B. et al. Degradação da cor e do ácido ascórbico na desidratação osmótica de kiwi. Boletim do Centro de Pesquisa
e Processamento de Alimentos, v. 2, n. 2, p. 1-7, 2008.
DUANGMAL, K.; SAICHEUA, B.; SUEEPRASAN, S. Colour evaluation of freeze-dried roselle extract as a natural food colorant in a model system of a drink. Food Science and Technology, v. 41, n. 8, p. 1437-1445, 2008.
FRANCIS, F. J.; CLYDESDALE, F. M. Food colorimetry: theory and applications. Westport: The AVI Publishing Co., 1975. p. 142-151. GABRIEL, A. A. Estimation of water activity from pH and oBrix values
of some food products. Food Chemistry, v. 108, n. 3, p. 1106-1113, 2008.
GARTI, N.; LESER, M. E. Emulsification properties of hydrocolloids.
Polymers for advanced Technologies, v. 12, n. 1-2, p. 123-135,
2001.
GIBSON, G. R. et al. Dietary modulation of the human colonic microbiota: updating the concept of prebiotics. Nutrition Research
UNIVERSIDADE ESTADUAL DE CAMPINAS - UNICAMP. Núcleo de Estudos e Pesquisas em Alimentação. TACO: tabela brasileira de composição de alimentos. Disponível em: <http://www.unicamp. br/nepa/taco/tabela.php?ativo=tabela&PHPSESSID=9970ce5a4b4 d44f8014f9a7d2caef4a1>. Acesso em: 26 mar. 2007.
VERBEKEN, D.; THAS, O.; DEWETTINCK, K. Textural properties of gelled dairy desserts containing kappa-carrageenan and starch.
Food Hydrocolloids, v. 18, n. 5, p. 817-823, 2004.
VITALI, A. A.; QUAST, D. G. Vida de prateleira de alimentos. In: MOURA, S. C. S. R; GERMER, S. P. M. Reações de transformação
e vida de prateleira de alimentos processados.3. ed. Campinas:
ITAL, 2004. p. 49-57.
WANG, L. et al. Optimisation of supercritical fluid extraction of flavonoids from Pueraria lobata. Food Chemistry, v. 108, n. 2, p. 737-741, 2008.
WHITE, D. A. et al. Sunflower-seed oil body emulsions: rheology and stability assessment of a natural emulsion. Food Hydrocolloids, v. 22, p. 1224-1232, 2008.
ZHANG, Y. et al. Stability and color characteristics of PEF-treated cyanidin-3-glucoside during storage. Food Chemistry, v. 106, n. 2, p. 669-676, 2008.
ROMERO, A. et al. Rheology and droplet size distribution of emulsions stabilized by crayfish flour. Food Hydrocolloids, v. 22, n. 6, p. 1033-1043, 2008.
SAAD, S. M. I. et al. Potentially probiotic and synbiotic chocolate mousse. Food Science and Technology, v. 40, n. 4, p. 669-675, 2007.
SOLER, L. Development of non-dairy frozen emulsion containing
soy protein and coconut milk. 2005, 84 p. Tese (Doutorado) -
Louisiana State University and Agricultural and Mechanical College, Louisiana, 2005.
THE, Y. H.; DOUGHERTY, M. P.; CAMIRE, M. E. Frozen blueberry-soy emulsion quality. Journal of Food Science, v. 70, n. 2, p. 119-122, 2005.
TOMLINS, K. I. et al. Urban consumer preferences and sensory evaluation of locally produced and imported rice in west Africa.
Food Quality and Preference, v. 16, n. 1, p. 79-89, 2005.
UNITED STATES DEPARTMENT OF AGRICULTURE - USDA.
Nutritive value of foods, home and garden bulletin 72 (HG-72).