Esperanza Huerta(1), Christian Kampichler(2), Violette Geissen(1), Susana Ochoa-Gaona(1), Ben de Jong(1) and Salvador Hernández-Daumás(1)
(1)El Colegio de la Frontera Sur, Unidad Villahermosa, Km 15.5, Carretera Villahermosa-Reforma, Ranchería Guineo 2a Sección, CP 86280
Villahermosa, Tabasco, México. E-mails: ehuerta@ecosur.mx, christian.kampichler@web.de, sochoa@ecosur.mx, violette.geissen@wur.nl, bjong@ecosur.mx, shernand@ecosur.mx (2)Universidad Juárez Autónoma de Tabasco, Villahermosa, Tabasco. E-mail: christian.kampichler@web.de
Abstract – The objective of this work was to construct a simple index based on the presence/absence of different groups of soil macrofauna to determine the ecological quality of soils. The index was tested with data from 20 sites in South and Central Tabasco, Mexico, and a positive relation between the model and the ! eld observations was detected. The index showed that diverse agroforestry systems had the highest soil quality index (1.00), and monocrops without trees, such as pineapple, showed the lowest soil quality index (0.08). Further research is required to improve this model for natural systems that have very low earthworm biomass (<10 g m-2) and a high number of earthworm species (5–7), as it is in the tropical rain forest, whose soil quality
index was medium (0.5). The application of this index will require an illustrated guide for its users. Further studies are required in order to test the use of this index by farmers.
Index terms: earthworms, models, soil fauna, soil quality indices.
Em busca de um índice ecológico para a qualidade de solo tropical
com base na macrofauna edá! ca
Resumo – O objetivo deste trabalho foi construir um índice simples com base na presença/ausência de diferentes grupos da macrofauna edá! ca para auxiliar na determinação da qualidade ecológica dos solos. O índice foi testado com dados de 20 locais do sul e centro do Estado de Tabasco, México, e foi observada uma correlação positiva entre o dados gerados pelo modelo e pelas observações de campo. O índice de qualidade de solo mostrou que diversos sistemas agro" orestais tiveram a mais alta qualidade de solo (1,0) e que os monocultivos sem árvores, como o de abacaxi, apresentaram a qualidade de solo mais baixa (0,08). Este modelo precisa ser melhor desenvolvido para ser aplicado e! cientemente em sistemas que apresentam naturalmente baixas densidades de minhocas (<10 g m-2) e número elevado de espécies de minhocas (5–7), como ocorre em solos
de " oresta tropical, cujo índice de qualidade de solo apresentou valores médios (0,5). A aplicação desse índice precisará de um guia ilustrado para os seus usuários. Mais estudos são necessários para testar o seu emprego por fazendeiros.
Termos para indexação: minhocas, modelos, fauna edá! ca, índices de qualidade de solo.
Introduction
The creation of soil quality models is a dif! cult task even for specialists, due to the high number of variables that are normally considered (Evenson et al., 2006). Furthermore, models are often dif! cult for farmers to understand (Dorfman & Karali, 2009). Therefore, the development of simple models with few variables can facilitate understanding and respond to local farmers’ needs. But, to generate these models, simple methods and indices of soil quality assessment are needed.
Soil quality plays an important role in the assessment of sustainable land-use systems. Especially in tropical
Most soil quality indicators are based on biotic and abiotic parameters (Klemens et al., 2003; Sepp et al., 2005), such as: soil biochemical and microbiological properties (Sánchez, 2003; Bending et al., 2004; Gil-Sotres et al., 2005), bacterial and invertebrate communities (Black et al., 2003; Ruf et al., 2003), organic matter strati! cation ratio (Franzluebbers, 2002), microbial biomarkers (Mummey et al., 2002), chemical and physical properties (Schoenholtz et al., 2000), plant cover and humus types (Wilson et al., 2001).
Also, the evaluation of soil quality often involves the analysis of measured soil properties using complex statistical methods (co-inertia analysis of chemical, physical, macrofauna and organic matter structure data). For example, the GISQ method (Velázquez et al., 2007) allows monitoring changes in soil quality over time and can guide the implementation of soil restoration technologies. Although these methods are useful, simpler means of assessing soil quality and of informing the small farmers – holders of the ecological condition of the soil – are needed, and their development should be tested. For instance, in New Zealand, a simple set of indicators has been proposed, and these have been used in national assessments since 2000 (Shepherd, 2000; Lilburne et al., 2002).
The presence of soil invertebrates can be used as an indicator of soil quality (Klemens et al., 2003; Ruiz-Camacho, 2004; Lavelle et al., 2006). Their diversity or richness can inform about the soil quality (Klemens et al., 2003; Ruiz-Camacho, 2004; Velázquez et al., 2007). Therefore, the objective of this study
was to build and test a simple index which could help farmers to determine the ecological quality of their soils based on the presence/absence of different groups of soil macrofauna, on earthworm biomass and on the presence of exotic earthworm species as indicators of perturbation. The model developed is based on the assumption that the abundance of macroinvertebrates indicates the type and intensity of physical and chemical ecosystem engineering (alterations to soil physical and chemical properties and processes) operated by invertebrates themselves and by subsequent associated microbial activities (Lee & Foster, 1991; Pankhurst et al., 1995; Lavelle, 1997; Mathieu et al., 2004; Pulleman et al., 2005).
Materials and Methods
The study was carried out in Tabasco, Mexico, where the mean annual rainfall ranges from 2,000 to 4,000 mm and the mean annual temperature is 26ºC. In the rainy season of 2004, soil samples were taken from alluvial sediments in plain areas in fruit plantations (one
Musa paradisiaca, two Mangifera indica, one Ananas comosus, one Saccharum sp., two farm backyards and one Theobroma cacao), timber plantations (one
Tectona grandis, one Cedrella odorata), annual crops (two Zea mays, one Manihot esculenta), two pastures, two fallow lands, two rain forests and one riparian vegetation (Table 1). Earthworms were collected by hand sorting: the TSBF macrofauna sampling method (Anderson & Ingram, 1993) was applied to collect specimens from 25x25x30-cm monoliths (Table 1)
in order to quantify earthworm biomass, population density and diversity. Within 10 to 50 monoliths were dug in each site.
Based on the results of studies on earthworm communities in Central and Southern Tabasco, Mexico (Geissen & Morales, 2006; Huerta et al., 2006, 2007; Uribe, 2006), the following parameters were used to describe earthworm community: number of earthworm species as a measure for their diversity; number of native species as an indicator for undisturbed ecosystems; presence of epigeic species as an indicator of litter feedback; earthworms biomass as an indicator of the incorporation of litter into the soil, as well as pH, soil texture and soil moisture (Figure 1). As an additional variable, the presence of macroinvertebrate litter decomposers – such as Diplopoda, Isopoda, Coleoptera, Heteroptera and Orthoptera, whose presence is attributable to natural and undisturbed conditions (Huerta Lwanga et al., 2008) – was taken into account.
The theory of fuzzy sets is basically one of graded concepts – a theory in which everything is a matter of degree or, to put it ! guratively, everything has elasticity. In classic set theory, an object can either
be a member (membership = 1) of a given set or not (membership = 0). The central idea of fuzzy set theory is that an object may have a partial membership of a set, which consequently may possess all possible values between 0 and 1. The closer the membership of an element is to 1, the more it belongs to the set; the closer the membership of an element is to 0, the less it belongs to the set. To apply the fuzzy set theory, there are three steps involved in the calculation of the model output: ! rst, for any observed value of the primary indicators, its corresponding membership value in the fuzzy set domain is calculated (fuzzi! cation); second, the memberships of the intermediate variable X are calculated applying the rules in the fuzzy set theory (fuzzy inference); third, the fuzzy results are converted into a discrete numerical output (defuzzi! cation) (see Bothe (1995) or Zimmermann (1996) for an introduction to fuzzy models). Fuzzy-rule-based models have become popular in ecological modelling (Li & Rykiel, 1996; Salski, 1996), and there exist various examples of their usefulness in the context of ecosystem evaluation, bioindication and sustainable management (Mendoza & Prabhu, 2003; Kampichler & Platen, 2004).
The total number of earthworm species, number of native species, presence of epigeic species, and macroinvertebrate litter decomposers was aggregated to the transitory variable “community” (scaled from 0, bad, to 1, good) by a simple set of six rules: rule 1, IF total number of earthworm species = 0, THEN community = 0; rule 2, IF total number of earthworm species <5 AND IF number of native earthworm species = 0, THEN community = 0.25; rule 3, IF total number of earthworm species <5 AND IF number of native earthworm species = 0, THEN community = 0.5; rule 4, IF total number of earthworm species <5 AND IF total number of earthworm species/number of native earthworm species <0.56, THEN community = 0.5; rule 5, IF total number of earthworm species >5 AND IF total number of earthworm species/number of native earthworm species 0.56, THEN community = 0.75; rule 6, IF epigeic earthworms are present AND/OR IF litter decomposers are present, THEN add 0.25 to community.
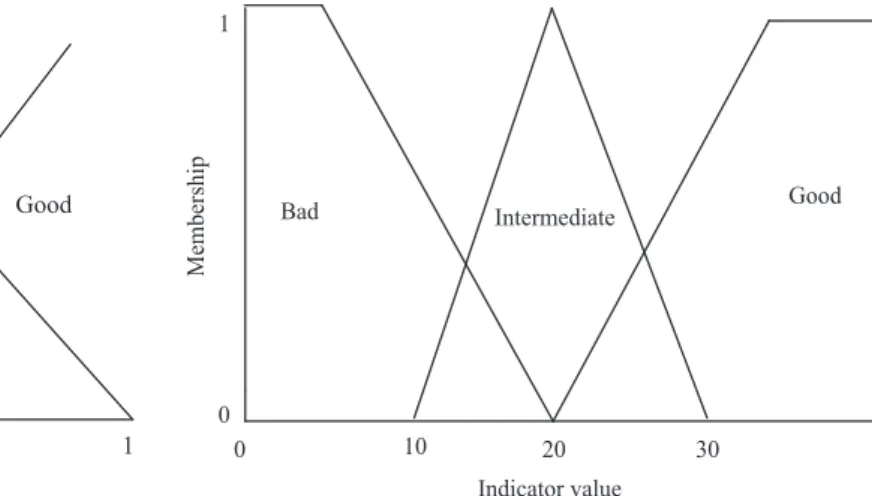
“Community” and earthworm biomass were aggregated by a fuzzy rule node. The value 0.4 for “community” in Figure 2, for example, has higher membership in the set intermediate than in the set bad; it does not belong at all in the set good.
For both “community” and earthworm biomass, three fuzzy rules were de! ned for each one, the quality index – the output variable of the fuzzy rule node – was de! ned by three singletons and was scaled from 0 (bad) to 1 (good) (Figure 3). The corresponding rules are: rule 1, IF community = bad AND IF biomass = bad, THEN quality = bad; rule 2, IF community = bad AND IF biomass = intermediate, THEN quality = bad;
rule 3, IF community = bad AND IF biomass = good, THEN quality = intermediate; rule 4, IF community = intermediate AND IF biomass = bad, THEN quality = bad; rule 5, IF community = intermediate AND IF biomass = intermediate, THEN quality = intermediate; rule 6, IF community = intermediate AND IF biomass = good, THEN quality = good; rule 7, IF community = good AND IF biomass = bad, THEN quality = intermediate; rule 8, IF community = good AND IF biomass = intermediate, THEN quality = good; rule 9, IF community = good AND IF biomass =good, THEN quality = good.
The overall structure of the entire model is presented in Figure 4. The index was tested with the information collected from the 20 sites (Table 1), and the data of each variable was grouped in three, four or ! ve categories (Figure 4).
Results and Discussion
Cocoa (Theobroma cacao), red cedar (Cedrella odorata), teak (Tectona grandis) plantations, orchard and vegetable garden, mango (Mangifera indica) plantations and pastureland were sites that presented a medium number (two to four) of species or high earthworm biomass (>30 g m-2), and had a soil quality
index value of 1.00 (Table 2). Regarding monocrops, a decreasing gradient was observed in the soil quality, i.e. 0.75 for maize (Zea mays) and cassava (Manihot sculenta), whereas the lowest values, 0.25 and 0.08, were obtained in the banana (Musa paradisiaca) and pineapple (Ananas comosus) crops respectively, which had low earthworm diversity and biomass.
Figure 2. Fuzzy sets of the input variable community and the output variable ecological quality.
Figure 3. Fuzzy sets of the input variable earthworm biomass
Natural systems, such as forests (secondary forest, 30 years), presented a medium quality index (0.5–0.75) caused by low biomass (0–10 g m-2), even though these
sites presented a high number of native species, most of them from the Megascolecidae family (Lavellodrilus bonampakensis, L. parvus, Balanteodrilus pearsei,
Diplotrema murchiei) (Table 2). Nevertheless the index is dif! cult to use in those systems with low biomass and high earthworm diversity, such as tropical rain forests, which con! rms otherwise the observations of earthworms specialists. Some other systems, such as the traditional orchard (familiar backyard), also proved to be rich in native species. Native species with high biomass produce a high quality index, i.e. for traditional orchard and vegetable gardens with
Mayadrilus calakmulensis (Table 2).
Three exotic species were found in this study:
Dichogaster saliens, Polypheretima elongata and
Pontoscolex corethrurus, of which P. elongata was dominant in most agroecosystems. Systems with low vegetation diversity presented low macrofauna diversity and low soil quality index, what con! rms previous macrofauna studies (i.e. monocrops) (Huerta et al., 2006; Huerta Lwanga et al., 2008).
The index obtained here showed that earthworm biomass and community structure can be used as indicators of soil quality in agroecosystems, monocrops or intercropping systems, crops with trees and without trees. Nevertheless, the model cannot produce a real quality index in natural systems, such as forests. The
Figure 4. Overall structure of the model yielding a
soil ecological quality index based on soil fauna. Total earthworm species number, number of native earthworm species, presence of epigeic earthworm species and presence of macroinvertebrate litter decomposers are aggregated to the transitory variable “community” by a rule node (white triangle); community and earthworm biomass are aggregated to the soil quality index by a fuzzy rule node (grey triangle).
forests sampled in this study had low biomass and high number of species, but the model produced a low quality index for them. More studies are required to improve this index for systems such as forests, where earthworm biomass is lower than 10 g m-2.
This work tried to develop a simple tool that could be used locally by farmers. However, the application of this index will require an illustrated guide that will permit the farmers to identify exotic earthworm species for this region, such as P. elongata, D. saliens
and P. corethrurus, epigeic species such as D. saliens
and litter-decomposing soil macrofauna. So far, the index only takes into account the presence of soil litter-decomposing macrofauna, not their numbers. Huerta Lwanga et al. (2008) found out, in systems where trees are abundant, that the amount of soil macroinvertebrates was the highest, as well as the content of soil organic matter. There is a clear relationship between soil fauna and soil fertility. The index is thus reliable on predicting tendencies in soil quality. However, further studies are required in order to facilitate the use of this index by farmers and other stakeholders.
Conclusion
Diverse agroforestry systems have the highest soil quality index, and monocrops without trees, such as pineapple, show the lowest soil quality index.
Acknowledgements
To CONACYT-SEMARNAT Project “Uso sustentable de los recursos naturales en la frontera sur de México” (code SEMARNAT-2002-C01-1109), to Fondos Mixtos Tabasco, to the government of the State of Tabasco (project Tab-2003-11316), for the ! nancial support; to El Colegio de la Frontera Sur, for the infrastructural resources provided; and to Manuel Mendoza, for the translation of the abstract into Portuguese.
References
ANDERSON, J.M.; INGRAM, J.S.I. Tropical soil biology and fertility: a handbook of methods. 2nd ed. Wallingford: CAB
International, 1993. 236p.
BENDING, G.D.; TURNER, M.K.; RAYNS, F.; MARX, M.C.; WOOD, M. Microbial and biochemical soil quality indicators and their potential for differentiating areas under contrasting agricultural management regimes. Soil Biology & Biochemistry, v.36, p.1785-1792, 2004.
BLACK, H.I.J.; PAREKHA, N.R.; CHAPLOWA, J.S.; MONSONB, F.; WATKINSA, J.; CREAMERA, R.; POTTERA, E.D.; POSKITTA, J.M.; ROWLANDA, P.; AINSWORTHA, G.; HORNUNGA, M. Assessing soil biodiversity across Great Britain: national trends in the occurrence of heterotrophic bacteria and invertebrates in soil. Journal of Environmental Management, v.67, p.255-266, 2003.
BOTHE, H.H. Fuzzy logic. 2nd ed. Berlin: Springer, 1995. 255p.
DORFMAN, J.H.; KARELI, B. Do farmers hedge optimally or by habit? A bayesian partial-adjustment model of farmer hedging. In: NCCC-134 CONFERENCE ON APPLIED COMMODITY PRICE ANALYSIS, FORECASTING, AND MARKET RISK MANAGEMENT, 2008, St. Paul. Proceedings. St. Paul: AgEcon Search, 2009. 18p.
EVENSON, D.G.; ORLOB, G.T.; LYONS, C. Ground-water quality models: what they can and cannot do. Ground Water, v.12, p.97-101, 2006.
FRANZLUEBBERS, A.J. Soil organic matter strati! cation ratio as an indicator of soil quality. Soil and Tillage Research, v.66, p.95-106, 2002.
GEISSEN, V.; MORALES, G. Fertility of tropical soils under different land use systems - a case study of soils in Tabasco, Mexico. Applied Soil Ecology,v.31, p.169-178, 2006.
GIL-SOTRES, F.; TRASAR-CEPEDA, C.; LEIROS, M.C.; SEOANE, S. Different approaches to evaluating soil quality using biochemical properties. Soil Biology & Biochemistry, v.37, p.877-887, 2005.
HUERTA LWANGA, E.; RODRÍGUEZ-OLÁN, J.; EVIA-CASTILLO, I.; MONTEJO-MENESES, E.; DE LA CRUZ-MONDRAGÓN, M.; GARCÍA-HERNÁNDEZ, R. Relación entre la fertilidad del suelo y su población de macroinvertebrados. Terra Latinoamericana, v.26, p.171-181, 2008.
HUERTA, E. Étude comparative des facteurs qui déterminent la biomasse et la densité de vers de terre dans les zones naturelles et anthropisées dans les sols de tropiques. 2002. 181p. These (PhD) - Université Paris VI Pierre et Marie Curie, Paris.
HUERTA, E.; FRAGOSO, C.; RODRIGUEZ-OLAN, J.; EVIA-CASTILLO, I.; MONTEJO-MENESES, E.; DE LA CRUZ-MONDRAGON, M.; GARCIA-HERNANDEZ, R. Presence of exotic and native earthworms in principal agro- and natural systems in Central and Southeastern Tabasco, Mexico.
Caribbean Journal of Science, v.42, p.359-365, 2006.
HUERTA, E.; RODRIGUEZ-OLAN, J.; EVIA-CASTILLO, I.; MONTEJO-MENESES, E.; DE LA CRUZ-MONDRAGON, M.; GARCIA-HERNANDEZ, R.; URIBE, S. Earthworms and soil properties in Tabasco, Mexico. European Journal of Soil Biology, v.43, p.190-195, 2007.
KAMPICHLER, C.; HERNÁNDEZ-DAUMÁS, S.; OCHOA-GAONA, S.; GEISSEN, V.; HUERTA LWANGA, E.; DE JONG, B. Indicators of environmentally sound land use in the humid tropics: the potential roles of expert opinion, knowledge engineering and knowledge discovery.
Ecological Indicators,2009. Doi:10.1016/j.ecolind.2009.06.010.
KLEMENS, E.; STIERHOF, T.; DAUBER, J.; KREIMES, K.; WOLTERS, V. On the quality of soil biodiversity indicators: abiotic and biotic parameters as predictors of soil faunal richness at different spatial scales. Agriculture, Ecosystems and Environment, v.98, p.273-283, 2003.
LAVELLE, P. Faunal activities and soil processes: adaptive strategies that determine ecosystem function. Advances in Ecological Research, v.27, p. 93-132, 1997.
LAVELLE, P.; DECAËNS, T.; AUBERT, M.; BAROT, S.; BLOUIN, M.; BUREAU, F.; MARGERIE, F.; MORA, P.; ROSSI, J. P. Soil invertebrates and ecosystem services. European Journal of Soil Biology, v.42, p.3-15, 2006.
LEE, K.E.; FOSTER, R.C. Soil fauna and soil structure. Australian Journal of Soil Research, v.29, p.745-775, 1991.
LI, B.L.; RYKIEL, E.J. Introduction. Ecological Modelling, v.90, p.109-110, 1996.
LILBURNE, L.R.; HEWITTA, A.E.; SPARLINGB, G.P.; SELVARAJAHC, N. Soil quality in New Zealand: policy and the science response. Journal of Environmental Quality, v.31, p.1768-1773, 2002.
MATHIEU, J.; ROSSI, J.P.; GRIMALDI, M.; MORA, P.; LAVELLE, P.; ROULAND, C. A multi-scale study of soil macrofauna biodiversity in Amazonian pastures. Biology and Fertility of Soils, v.40, p.300-305, 2004.
MENDOZA, G.A.; PRABHU, R. Fuzzy methods for assessing criteria and indicators of sustainable forest management. Ecological Indicators, v.3, p.227-236, 2003.
MUMMEY, D.; STAHL, P.D.; BUYER, J.S. Soil microbiological properties 20 years after surface mine reclamation: spatial analysis of reclaimed and undisturbed sites. Soil Biology & Biochemistry, v.34, p.1717-1725, 2002.
ORTIZ, S.M.; ANAYA, G.; ESTRADA, B.W. Evaluacion, cartogra! a y politicas preventivas de la degradación de la tierra. Chapingo: Colegio de Postgraduados, 1994. 161p.
PANKHURST, C.E.; HAWKE, B.G.; MCDONALD, H.J.; KIRKBY, C.A.; BUCKERFIELD, J.C.; MICHELSON, P.; O’BRIEN, K.A.; GUPTA, V.V.S.R.; DOUBE, B.M. Evaluation of soil biological properties as potential bioindicators of soil health.
Australian Journal of Agricultural Research,v.35, p.1015-1028, 1995.
PULLEMAN, M.M.; SIX, J.; UYL, A.; MARINISSEN, J.C.Y.; JONGMANS, A.G. Earthworms and management affect organic
matter incorporation and microaggregate formation in agricultural soils. Applied Soil Ecology, v.29, p.1-15, 2005.
RUF, A.; BECK, L.; DREHER, P.; HUND-RINKE, K.; RÖMBKE, J.; SPELDA, J. A biological classi! cation concept for the assessment of soil quality: ‘‘biological soil classi! cation scheme’’ (BBSK). Agriculture, Ecosystems and Environment, v.98, p.263-271, 2003.
RUIZ-CAMACHO, N. Mise au point d’un système de bioindication de la qualité du sol base sur l’étude des peuplements de macro-invertébrés. 2004. 270p. Thesis (PhD) - Université Paris VI, Paris.
SALSKI, A. Introduction. Ecological Modelling, v.85, p.1-2, 1996.
SÁNCHEZ, P.A.; PALMA, C.A.; BUOL, S.W. Fertility capability soil classi! cation: a tool to help assess soil quality in the tropics.
Geoderma,v.114, p.157-185, 2003.
SCHOENHOLTZ, S.H.; VAN MIEGROET, H.; BURGER, J.A. A review of chemical and physical properties as indicators of forest soil quality: challenges and opportunities. Forest Ecology and Management, v.138, p.335-356, 2000.
SEPP, K.; IVASK, M.; KAASIK, A.; MIKK, M.; PEEPSON, A. Soil biota indicators for monitoring the Estonian agri-environmental programme. Agriculture, Ecosystems and Environment, v.108, p.264-273, 2005.
SHEPHERD, G.T. Visual soil assessment. I. Field guide for cropping & pastoral grazing on " at to rolling country. Madison: American Society of Agronomy, 2000. v.1, 84p.
URIBE, S. Estudio comparativo de lombrices de tierra en cacaotales de la Chontalpa, Tabasco. 2006. 210p. Thesis (Master) - El Colegio de la Frontera Sur, Mexico.
VELÁSQUEZ, E.; LAVELLE, P.; AMÉZQUITA, E.; BARRIOS, E.; ANDRADE, M. GISQ, a multifunctional indicator of soil quality. Soil Biology and Biochemistry, v.39, p.3066-3080, 2007.
WILSON, S.M.C.G.; PYATT, D.G.; MALCOLM, D.C.; CONNOLLY, T. The use of ground vegetation and humus type as indicators of soil nutrient regime for an ecological site classi! cation of British forests. Forest Ecology and Management, v.140, p.101-116, 2001.
ZIMMERMANN, H.J. Fuzzy set theory and its applications. 3rd ed. Boston: Kluwer, 1996. 435p.