EXPERIMENTAL EVALUATION AND QUALITATIVE INCREASE OF
THERMAL LOAD IN REFRIGERATED DISPLAY CABINETS DUE TO
BREAKAGE OF THE AIR CURTAIN
S. M. NASCIMENTO
(a), G. G. HEIDINGER
(b), P. D. GASPAR
(c), P. D. SILVA
(d)(a)(b)
EletrofrioRefrigeração Ltda, r João Chede, 1599, Cidade Industrial, Curitiba - PR, 81170-220, Brazil
+55 (41) 2105-6097, (a)[email protected]; (b)
[email protected]
(c)
University of Beira Interior, Engineering Faculty, Dept. of Electromechanical Engineering, Covilhã, 6201-001, Portugal
+351 275 329 972, (c)[email protected]; (d)[email protected]
ABSTRACT
Open refrigerated display cabinets are used extensively in convenience stores and supermarkets in order to display perishable products meeting the criteria of food security. In Brazil, there are about 81 thousand stores using open or closed refrigerated display cabinets for products sale. The vertical open refrigerated display cabinet is the model that consumes more energy. About 81% its total consumption is due to the infiltration of outside air through the air curtain. The air curtain performance can be influenced by several factors, among which, the customers’ movement near the equipment frontal opening causing a perturbation in the air jet and increasing its energy consumption. Experimental tests were conducted in open and closed hours of a food store. The TEF increases by 22% and cooling load by 18% when the shop is open. The results comparison allows evaluating the thermal performance of the equipment among test cases for a real scenario.
1. INTRODUCTION
Since ancient times, man has the need and the will of obtaining cooling ways that make the temperature of foods products to reach a value below the environmental temperature in order to preserve them for longer periods of time. The perishable food products, from production to the final consumer, are preserved and channelled through the system named as cold chain. According to Rigot (1991), the cold chain can be described by five main links: Cold in the production stage; Cold during storage, Refrigerated transportation; Cold in the distribution stage; Home cooling. The fourth link in the cold chain, which is the subject of this paper, is commonly referred as commercial refrigeration by being placed at the trade level. ASHRAE (2010) indicates that the percentage of energy consumed in a typical supermarket due to the refrigeration systems reaches 50%. This energy is consumed by compressors, refrigerated display cabinets, walk-ins and condensers. Among the refrigerated display cabinets installed in a supermarket, which consumes more energy are of the vertical and open type. According to Faramarzi (1999), ASHRAE (2010) and Gaspar et al. (2011), the thermal load due to ambient air infiltration to a vertical open refrigerated display cabinet (ORDC) corresponds respectively to 67% - 77%, 73.5% and 78% - 81% of the total thermal load. This condition results from the low efficiency of the curtain air which forms a physical barrier between the internal and external environments of the equipment.
The work developed by various researchers has focused, for this type of equipment, in qualifying and quantifying the perceptible thermo-physical properties of the jet that provides a cold air curtain. Hayes & Stoecker (1969) developed a correlation that describes the ability of the air curtain to provide a proper separation between environments. The correlation is given by a dimensionless parameter named as deflection modulus, Dm, which is the ratio between the air curtain momentum and the modulus of the transverse forces
caused by temperature difference between the contiguous environments. Faramarzi (1999) determined the relative weight of the total cooling load components for ORDC, composed by the loads from infiltration, radiation, conduction, product pull-down cooling, devices (lights and fans), defrost and anti-sweat heaters, and product respiration. According to EN-ISO 23953 (2005), the total thermal cooling load can be determined by eq. (1).
Chen et al. (2005, 2009, 2011) developed studies using Computational Fluid Dynamics (CFD) codes to evaluate the thermo-physical parameters of the air curtain in ORDC. The performance of air curtain was evaluated by the following dimensionless numbers/parameters: Reynolds number, Grashof number, Richardson number and dimensionless temperature, given by eq. (2) to eq. (5) respectively, for different aspect ratios (height/width) of the air curtain.
(2) (3) (4) (5)
The results provided the following conclusions: (1) for a given Grashof number, there is a critical value of the Richardson number for optimal thermal sealing ability of the air curtain, which means that the value of the Reynolds number decreases by reducing the height/width ratio; (2) the range of values for the Richardson number increases reducing the height/width ratio; (3) for a minimum infiltration rate, the Richardson number decreases reducing the height/width ratio; (4) the volumetric infiltration rate decreases reducing the height/width ratio. Thus it can be stated that air curtains with small height/width ratio provide a good thermal performance. Navaz et al. (2005) developed further studies using Digital Particle Image Velocimetry (DPIV), focusing mainly in studying the effectiveness of the curtain and maintaining the temperature of food products to a predetermined value. The results evaluation indicates that the Reynolds number has direct effect on the ambient air entrainment into the refrigerated equipment due to its role in the turbulence development. According to Navaz et al. (2005), the best range of values for the Reynolds number in the discharge air grille (DAG) is about 3200-3400. In that study, the authors defined the Thermal Entrainment Factor, TEF, to quantify the thermal entrainment of the air curtain with the ambient air, varying 0 < TEF < 1. The analysis to the correlation shows that as closer to 0 is TEF, lower is the thermal entrainment with the ambient air. The correlation described by Navaz et al. (2005) does not take into account the air flow through the perforated back panel (PBP). Yu et al. (2009) developed the TEF equation considering this air flow. The new correlation is given by eq. (6) to eq. (8) including the dimensionless temperature given by eq. (5).
(6)
(7)
(8)
The results obtained by Yu et al. (2009) show a good approximation for TEF and temperature value at the return air grille (RAG) with deviations of 0.9% and 0.1 °C respectively. These deviations indicate that the correlation has a good approximation at the engineering level and can be applied in the design of vertical ORDC. Gaspar et al. (2009, 2010, 2011) evaluated the stability of the air curtain for climatic classes n.º 1, n.º 2 and n.º 3 according to EN-ISO 23953 (2005) and other classes beyond the standard. The evaluation was made by experimental testing and numerically using CFD models. The results showed that the ORDC performance strongly depends on the ambient air conditions such as temperature, humidity, velocity and direction of ambient air flow in relation to the ORDC's frontal opening. These authors showed that (1) the cooling load increases with the air temperature and relative humidity of the external environment, (2) the increase of the ambient air velocity increases more significantly the power consumption of the ORDC than the airflow direction change from parallel to perpendicular in relation the frontal opening of the ORDC, (3) the magnitude of deflection modulus Dm related with minimum momentum required to maintain a stable
curtain of air is between 0.12 and 0.25; (4) the cooling load due to air infiltration is 78% - 81%, which is range closer to the value obtained by Faramarzi (1999) which is of 73.5%, and (5) TEF is not constant along
the equipment length for parallel air flow. Furthermore, the TEF value increases when the ambient air flow goes from parallel to perpendicular, being the worst case for θamb = 45°. In the case study,
TEF = 0.25, 0.32, 0.3 for θamb = 0°, 45°, 90° respectively.
Laguerre et al. (2012) developed a simplified analytical model based on heat transfer equations to determine the values of air and product temperatures at various locations of an ORDC. The heat gain by radiation is more significant for products located on the front (top and bottom) and the heat gain by air infiltration is more significant for the products located in the rear (front and rear). Cao et al. (2010, 2011) developed a new strategy for conception and optimization in the air curtains design for vertical ORDC. The strategy is based on the heat transfer model between two fluids (two-fluid of cooling loss - CLTF) developed based on a Support Vector Machine (SVM) algorithm. Mousset and Libsig (2011) developed the correlation described by eq. (9) that quantifies, for any ambient air condition, the cooling load increment relatively to the cooling load in the climate class n.º 3 (25°C/60%RH) of ISO23953 (2005).
(9)
Where, [W] is the heat extraction rate in the ISO climate class x while the [W] is the heat Extraction Rate in the ISO climate class n.º 3. Similarly, Enthalpy(CLASS x) [kJ/kg] is the enthalpy of
the humid air calculated with the temperature and humidity of the class x and Enthalpy(CLASS 3) [kJ/kg] is the
enthalpy of the humid air calculated with the temperature (25°C) and humidity (60%RH) of the climate class n.º 3.
This paper presents the field data collected in real operation of the ORDC in a commercial establishment without air conditioning. The experimental results describe the performance of the ORDC under real ambient air conditions and aim to provide information that can be use in the performance improvement of the ORDC since the design climate class condition cannot be always achieved in real operation.
2. CHARACTERISTICS OF THE OPEN REFRIGERATED DISPLAY CABINET
The vertical ORDC provided by Eletrofrio Refrigeration LTDA - Brazil has 2.5x1.1x2.1 m3 (see Figure 1). The temperature of the refrigerated compartment is provided by the cold air mass flow that exits DAG and PBP and returns to RAG to be cooled again in the HX. The air flow exiting DAG forms an air curtain which protects the inner refrigerated compartment. The device has four fans with 53 W each to supply a flow rate of 0.4 m3.s-1 to DAG and PBP. The air, before reaching the DAG, passes through an evaporator with dimensions 2.20x0,13x0,35 m3 constituted by 222 fins and three rows of tubes in the air flow direction and 8 rows of tubes perpendicular to it. The DAG has a total width, b, of 140 mm, which is equally distributed to form the PAC (bPAC = 70 mm) and SAC (bSAC = 70 mm).
3. EXPERIMENTAL STUDY
The performance benchmark of the vertical ORDC was conducted with air temperature and humidity data collected during six months. The ORDC was installed in a store with 532 m² of sales area without air conditioning. The supermarket is located in São Paulo - SP, Brazil.
2.1. Experimental testing procedure
Data acquisition was performed every 30 seconds, every day during 24 hours. The periods of interest for the evaluation and comparison of performance of the ORDC take into account the opening hours of the commercial establishment for consumer attendance. The air temperature and humidity values were collected near the DAG and RAG of an ORDC for packaged meat. Table 1 shows the experimental techniques and probes/experimental measuring devices used to collect the relevant physical properties.
Table 1. Experimental techniques and probes/experimental measuring devices. Experimental technique Model Measuring range Accuracy
Thermometry MT 530 Super -10°C to 70°C ± 1.5 °C Hygrometry MT 530 Super 20% to 85% ± 5%
The probes were located in the ORDC as shown in Figure 1.
Figure 1. Air temperature and humidity probes location in the ORDC.
4. RESULTS ANALYSIS AND DISCUSSION
During the period that the store is open to public, the cold air curtain of the ORDC that provides a thermal sealing ability between the humid and hot ambient and the refrigerated one inside the ORDC is subject to food product handling by clients and repositories. According to Faramarzi (1999), this condition causes the temperature difference between DAG and RAG to increase, and consequently the energy consumption. The air curtain efficiency can be evaluated by the TEF value calculated by eq. (5) to eq. (8).
4.1. Results
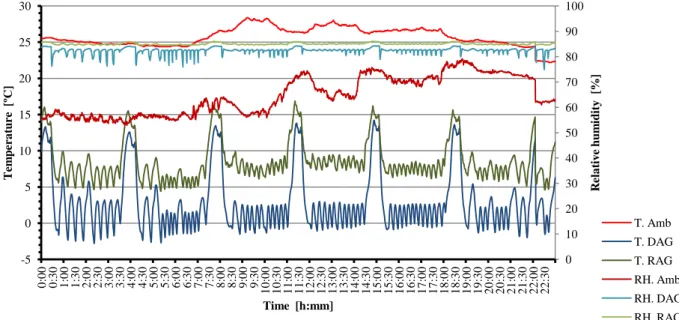
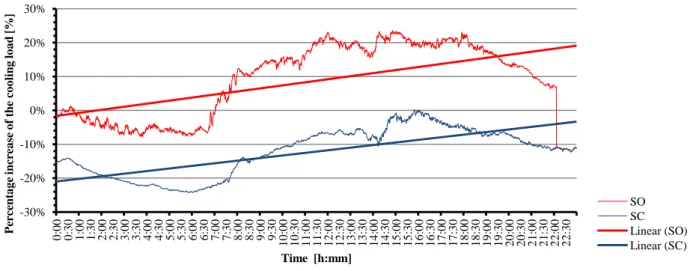
The annual average variation of the air temperature and relative humidity in DAG, RAG and store environment are shown in Figure 2 and Figure 3. These figures show the annual average values collected on days when the store was closed (Store Closed - SC) and when it was open (Store Open - SO) to consumers, respectively. Figure 4 shows the average variation of the air temperature and humidity values collected in laboratory tests (LAB) according to EN ISO 23953 (2005). In Figure 5 are shown the TEF values for the different scenarios as well as their linear trend. Finally, Figure 6 shows the percentage increase of the cooling load calculated according to eq. (9) and its linear trend.
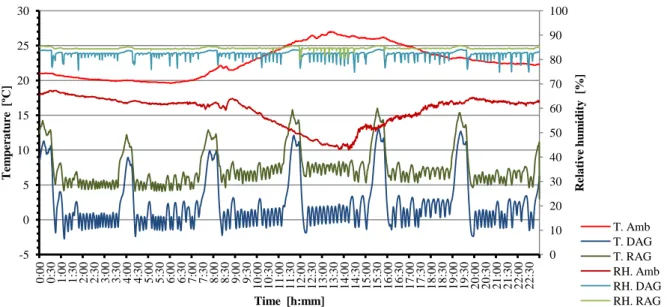
Figure 2. Average experimental results of air temperature and relative humidity - Case study: Store closed.
0 10 20 30 40 50 60 70 80 90 100 -5 0 5 10 15 20 25 30 0 :0 0 0 :3 0 1 :0 0 1 :3 0 2 :0 0 2 :3 0 3 :0 0 3 :3 0 4 :0 0 4 :3 0 5 :0 0 5 :3 0 6 :0 0 6 :3 0 7 :0 0 7 :3 0 8 :0 0 8 :3 0 9 :0 0 9 :3 0 1 0 :0 0 1 0 :3 0 1 1 :0 0 1 1 :3 0 1 2 :0 0 1 2 :3 0 1 3 :0 0 1 3 :3 0 1 4 :0 0 1 4 :3 0 1 5 :0 0 1 5 :3 0 1 6 :0 0 1 6 :3 0 1 7 :0 0 1 7 :3 0 1 8 :0 0 1 8 :3 0 1 9 :0 0 1 9 :3 0 2 0 :0 0 2 0 :3 0 2 1 :0 0 2 1 :3 0 2 2 :0 0 2 2 :3 0 R el a ti v e h u m id it y [% ] T em p er a tu re [ºC ] Time [h:mm] T. Amb T. DAG T. RAG RH. Amb RH. DAG RH. RAG
Figure 3. Average experimental results of air temperature and relative humidity - Case study: Store open.
Figure 4. Daily average experimental results of air temperature and relative humidity - Case study: Climate class n.º 3 (25°C; 60%RH) (EN ISO 23953, 2005).
Figure 5. TEF values and its linear trend for the different case studies: Store closed (SC), Store open (SO) and laboratory (LAB).
0 10 20 30 40 50 60 70 80 90 100 -5 0 5 10 15 20 25 30 0 :0 0 0 :3 0 1 :0 0 1 :3 0 2 :0 0 2 :3 0 3 :0 0 3 :3 0 4 :0 0 4 :3 0 5 :0 0 5 :3 0 6 :0 0 6 :3 0 7 :0 0 7 :3 0 8 :0 0 8 :3 0 9 :0 0 9 :3 0 1 0 :0 0 1 0 :3 0 1 1 :0 0 1 1 :3 0 1 2 :0 0 1 2 :3 0 1 3 :0 0 1 3 :3 0 1 4 :0 0 1 4 :3 0 1 5 :0 0 1 5 :3 0 1 6 :0 0 1 6 :3 0 1 7 :0 0 1 7 :3 0 1 8 :0 0 1 8 :3 0 1 9 :0 0 1 9 :3 0 2 0 :0 0 2 0 :3 0 2 1 :0 0 2 1 :3 0 2 2 :0 0 2 2 :3 0 R el a ti v e h u m id it y [% ] T em p er a tu re [ºC ] Time [h:mm] T. Amb T. DAG T. RAG RH. Amb RH. DAG RH. RAG 0 10 20 30 40 50 60 70 80 90 100 0 5 10 15 20 25 30 0 :0 0 0 :3 0 1 :0 0 1 :3 0 2 :0 0 2 :3 0 3 :0 0 3 :3 0 4 :0 0 4 :3 0 5 :0 0 5 :3 0 6 :0 0 6 :3 0 7 :0 0 7 :3 0 8 :0 0 8 :3 0 9 :0 0 9 :3 0 1 0 :0 0 1 0 :3 0 1 1 :0 0 1 1 :3 0 1 2 :0 0 1 2 :3 0 1 3 :0 0 1 3 :3 0 1 4 :0 0 1 4 :3 0 1 5 :0 0 1 5 :3 0 1 6 :0 0 1 6 :3 0 1 7 :0 0 1 7 :3 0 1 8 :0 0 1 8 :3 0 1 9 :0 0 1 9 :3 0 2 0 :0 0 2 0 :3 0 2 1 :0 0 2 1 :3 0 2 2 :0 0 2 2 :3 0 R el a ti v e h u m id it y [% ] T em p er a tu re [ºC ] Time [h:mm] T. Amb T. DAG T. RAG RH. Amb RH. DAG 0 0,05 0,1 0,15 0,2 0,25 0,3 0 :0 0 0 :3 0 1 :0 0 1 :3 0 2 :0 0 2 :3 0 3 :0 0 3 :3 0 4 :0 0 4 :3 0 5 :0 0 5 :3 0 6 :0 0 6 :3 0 7 :0 0 7 :3 0 8 :0 0 8 :3 0 9 :0 0 9 :3 0 1 0 :0 0 1 0 :3 0 1 1 :0 0 1 1 :3 0 1 2 :0 0 1 2 :3 0 1 3 :0 0 1 3 :3 0 1 4 :0 0 1 4 :3 0 1 5 :0 0 1 5 :3 0 1 6 :0 0 1 6 :3 0 1 7 :0 0 1 7 :3 0 1 8 :0 0 1 8 :3 0 1 9 :0 0 1 9 :3 0 2 0 :0 0 2 0 :3 0 2 1 :0 0 2 1 :3 0 2 2 :0 0 2 2 :3 0 T h er m a l E n tr a in m en t Fa ct o r (T E F) Time [h:mm] LAB SC SO Linear (LAB) Linear (SC)
Figure 6. Percentage increase in the cooling load of case study: Store closed (SC) and Store open (SO) in relation to case study: Laboratory (LAB).
4.2. Discussion
The cooling load increase due to the air curtain breakage is a condition accepted by all researchers, but the increased load due to the disturbance of the airflow caused by consumers and stockers is a small and difficult component to measure in field tests. As shown in Figures 3 and 4, the time period in when the temperature difference between DAG and RAG is greater coincides with the time period when the ambient air temperature increases. Figure 5 shows the air temperature variation of test conducted according to EN ISO 23953 (2005). In Figure 5, it is shown a cyclic operation of the ORDC, period to period, since the environment of the test room is controlled. With these results, it is concluded that to assess the air curtain perturbation due to the extraction of food items and movement of people in the store near the frontal opening of the ORDC, it is necessary to develop standard tests in a controlled environment.
In Figure 6 it is possible to evaluate the air curtain performance by the TEF values. There are fluctuations in the TEF values when the ORDC is exposed to real conditions in a store without air conditioning, both closed or open. Additionally, the linear trend of TEF increases when the store is open to public. The time period when the TEF value is greater also coincides with the time period when the temperature value is higher. Figure 7 shows the percentage increase of cooling load when the store is open and closed to public. The two curves show oscillations throughout the time period. When the store is opened to consumers, the cooling load increases 20% in relation to the value determined by laboratory test conducted according to EN ISO 23953 (2005). In both case studies, store closed or open, the cooling load increases during the time period. Thus, the power consumption of the ORDC is very dependent on ambient air conditions and the use of HVAC systems to control the environment of the store or cold foods sector is crucial for reducing the cooling load.
5. CONCLUSION
In Brazil, due to its territorial extension, there are very significant different climate regions. Even with this climate difference, small supermarkets or store, mostly don't have any kind of air conditioning system. The store chosen for the development of this work is located in the Southeast of Brazil. With these results was possible to evaluate and compare the performance of a vertical open refrigerated display cabinet, operating in a controlled environment and in situ operation. From the results analysis, it can be stated that the environment conditions, air temperature and humidity, increase significantly the energy consumption of open refrigerated display cabinets and it is possible to save energy when the environment is controlled. Additionally, the evaluation of the air curtain performance due to the extraction of products and customer movement inside the store and particularly in the front of the equipment's opening is only possible when the environment is controlled. -30% -20% -10% 0% 10% 20% 30% 0 :0 0 0 :3 0 1 :0 0 1 :3 0 2 :0 0 2 :3 0 3 :0 0 3 :3 0 4 :0 0 4 :3 0 5 :0 0 5 :3 0 6 :0 0 6 :3 0 7 :0 0 7 :3 0 8 :0 0 8 :3 0 9 :0 0 9 :3 0 1 0 :0 0 1 0 :3 0 1 1 :0 0 1 1 :3 0 1 2 :0 0 1 2 :3 0 1 3 :0 0 1 3 :3 0 1 4 :0 0 1 4 :3 0 1 5 :0 0 1 5 :3 0 1 6 :0 0 1 6 :3 0 1 7 :0 0 1 7 :3 0 1 8 :0 0 1 8 :3 0 1 9 :0 0 1 9 :3 0 2 0 :0 0 2 0 :3 0 2 1 :0 0 2 1 :3 0 2 2 :0 0 2 2 :3 0 Pe rc en ta g e in cr ea se o f th e co o li n g l o a d [ % ] Time [h:mm] SO SC Linear (SO) Linear (SC)
NOMENCLATURE
b air curtain width (m) Subscripts
g Gravitational accelerations (m.s-1) amb ambient
Gr Grashof number (-) DAG Discharge air grille
H Air curtain height (m) ET Experimental test i enthalpy (J.kg-1) HX Heat exchanger
Mass flow rate (kg.h-1) IB Insulating body
Thermal power (W) PAC Primary air grille Re Reynolds number (-) RAG Return air grille Ri Richardson number (-) SAC Secondary Air Curtain
RH Relative humidity (%) SH Shelve
T Temperature (K) sim simulator
u Velocity (m.s-1) tot total
V Airflow rate (m3/h)
X Dimensionless temperature (-) Abbreviation
CFD Computational fluid Dynamics DAG Discharge Air Grille
RAG Return Air Grille PBP Perforated Back Panel TEF Thermal Entrainment Factor PAC Primary Air Curtain
SAC Secondary Air Curtain
HVAC heating, ventilation, and air conditioning Greek symbols
Airflow direction ( º ) ν Kinematic viscosity (m².s-1) Thermal expansion coefficient (K-1)
β Back panel airflow ratio (-) Heat Extraction Rate (W)
REFERENCES
1. ASHRAE. 2010, “ASHRAE Handbook: Refrigeration”, American Society of Heating, Refrigerating and Air Conditioning Engineers (ASHRAE), Inc.
2. Cao, Z., Gu, B. Mills, G., Han, H. 2010, A novel strategy for predicting the performance of apen vertical refrigerated display cabinets based on the MTF model and ASVM algorithm, International Journal of
Refrigeration 33(7), 1413-1424.
3. Cao, Z., Gu, B. Mills, G., Han, H. 2010, Application of an effective strategy for optimizing the design of air curtains for open vertical refrigerated display case, Int. Journal of Thermal Sciences 49(6), 976-983. 4. Cao, Z., Gu, G., Han, H. 2011, A novel optimization strategy for the design of air curtains for open
vertical refrigerated display cases, Applied Thermal Engineering 31(16), pp. 3098–3105.
5. Chen, Y., Yuan, X.-L. 2005, Simulation of a cavity insulated by a vertical single band cold air curtain,
Energy Conversion and Management 46(11-12), 1745-1756.
6. Chen, Y. 2009, Parametric evaluation of refrigerated air curtains for thermal insulation, International
Journal of Thermal Sciences 48(10), 1988-1996.
7. Chen, Y., Xia, D.H. 2011, The flow characteristics analyses of refrigerated air curtains in multi-deck display cabinets, International Congress of Refrigeration), 23rd ed., Prague, Czech Republic.
8. Faramarzi, R. 1999, Efficient display case refrigeration, ASHRAE Journal 41(11), 46–52.
9. Foster, A.M., Madge, M., Evans, J.A. (2005), The use of CFD to improve the performance of a chilled multi-deck retail display cabinet, International Journal of Refrigeration, 28(5), 698–705.
10. Gaspar, P.D., Gonçalves, L.C.C., Vogeli, A. 2009, Dependency of air curtain performance on discharge air velocity (grille and back panel) in open refrigerated display cabinets, ASME International Mechanical
11. Gaspar, P.D., Gonçalves, L.C.C., Ge, X. 2010, CFD parametric study of ambient air velocity magnitude influence in thermal behaviour of open refrigerated display cabinets, European Conference on
Computational Fluid Dynamics, 5rd ed., Lisbon, Portugal
12. Gaspar, P.D., Gonçalves, L.C.C., Ge, X. 2010, Influence of ambient air velocity orientation in thermal behaviour of open refrigerated display cabinets, ASME 2010 10th Biennial Conference on Engineering Systems Desing and Analysis, Istanbul, Turkey, July.
13. Gaspar, P.D., Gonçalves, L.C.C., Pitarma, R.A. 2011, Experimental analysis of the thermal entrainment factor of air curtains in vertical open display cabinets for different ambient air conditions, Applied
Thermal Engineering 31(5), 961–969.
14. Gaspar, P.D., Gonçalves, L.C.C., Pitarma, R.A. 2011, Análise Experimental da estabilidade de cortinas de ar de equipamentos de refrigeração para diferentes condições do ar ambiente, International Conference
on Engineering UBI2011 -28-30 Nov 2011 - Universidade of Beira Interior - Covilhã, Portugal.
15. Hayes, F.C., Stoecker, W.F. 1969, Design data for air curtains, ASHRAE Transactions 75(2), 68-180. 16. Laguerre, O., Hoang, M.H., Flick, D. 2012, Heat transfer modelling in a refrigerated display cabinet: the
influence of operating conditions, Journal of Food Engineering 108(2), 353-364.
17. Mousset, S., Libsig, M. 2011, Energy consumptions of display cabinets in supermarket, International
Congress of Refrigeration, 23rd ed., IIR, Prague, Czech Republic.
18. Navaz, H.K., Henderson, B.S., Faramarzi, R., Pourmovahed, A., Taugwalder F. 2005, Jet entrainment rate in air curtain of open refrigerated display cases, International Journal of Refrigeration 28(2), 267–275. 19. Rigot, G. 1991, Meubles et Vitrines Frigorifiques, PYC DITION, París, France.
20. Yu, K., Ding, G., Chen, T. 2009, A correlation model of thermal entrainment factor for air curtain in a vertical open display cabinet, Applied Thermal Engineering 29(14-15), 2904–2913.