UNIVERSIDADE DA BEIRA INTERIOR
Ciências da saúde
Male Fertility and Type 2 Diabetes
Mellitus: effect of White Tea
Gonçalo David Cabral Tomás
Dissertação apresentada à Universidade da Beira Interior para obtenção do
grau de Mestre em Ciências Biomédicas
(2º ciclo de estudos)
Orientador: Prof. Doutor Pedro Fontes Oliveira (CICS-UBI)
Co-orientador: Prof. Doutora Branca M. Silva (CICS-UBI)
ii
Acknowledgements
Foremost, I would like to express my sincere gratitude to my supervisor Professor Pedro Oliveira for the continuous support during this whole year, for his patience, motivation, enthusiasm, and immense knowledge. His guidance helped me during all the time of research and writing of this thesis. I could not have imagined having a better supervisor for my MSc study.
I would also like to thank my co-supervisor Professor Branca Silva for the support, enthusiasm, knowledge, critical review of the text and willingness to help when needed.
I would also like to thank Professor Marco Alves for the critical review of the text, information, opinions and suggestions during this whole year.
A special thanks to Tânia Dias and Luís Rato for the immense support, patience and willingness to help.
I gratefully acknowledge my colleagues in the laboratory Nelson, Mário, Inês, Cátia, Ricardo, Sara, Tito, Raquel, Ana Martins and Filipa Pinheiro for making such a relaxed and fun work environment.
Last, but not the least, I would like to thank my parents, girlfriend and sister for their support, understanding and constant encouragement to pursue my goals.
iii
Resumo
A diabetes mellitus é um dos principais problemas de saúde pública e seu aumento de incidência está intimamente relacionado com a diminuição das taxas de natalidade. A infertilidade masculina relacionada com a diabetes tipo 2 tem sido associada ao aumento de produção de espécies reactivas de oxigénio e ao aumento do stress oxidativo testicular. O chá é uma das bebidas mais consumidas no mundo e o seu potencial anti hiperglicémico e antioxidante tem sido descrito em diversos estudos. Com este trabalho pretende-se investigar se o consumo de chá branco por ratos diabéticos tipo 2 pode prevenir o stress oxidativo testicular e assim preservar a qualidade espermática. Para essa finalidade, utilizou-se um modelo de rato diabético tipo 2 induzido por streptozotocina. Em animais com um mês de idade, a água foi substituída por chá branco durante dois meses e após esse período o potencial antioxidante e o stress oxidativo nos testículos foi avaliado, bem como os parâmetros espermáticos em ratos normais e em ratos diabéticos tipo 2 que consumiram água ou chá branco.
O consumo de chá branco melhorou a tolerância à glucose e a sensibilidade à insulina em ratos diabéticos tipo 2. Restaurou ainda os níveis de oxidação proteica e de peroxidação lipídica para níveis presentes em ratos controlo. O potencial antioxidante testicular foi aumentado pelo consumo de chá branco em ratos diabéticos tipo 2, enquanto o stress oxidativo testicular foi diminuído. No entanto, o teor de glutationa e o seu estado redox não foram alterados. Após o consumo de chá branco por ratos diabéticos tipo 2, a concentração espermática foi aumentada, enquanto a motilidade, a viabilidade e o número de espermatozóides anormais atingiram valores normais, evidenciando que a qualidade dos espermatozóides epididimais foi restaurada. No geral, estes resultados mostram que o consumo de chá branco provoca uma melhoria acentuada nos parâmetros espermáticos e, portanto, na função reprodutora masculina em diabetes tipo 2, devido a uma diminuição significativa na produção de espécies reactivas de oxigénio nos testículos. O consumo de chá branco pode ser uma estratégia natural e económica para neutralizar os efeitos deletérios da diabetes tipo 2 na função reprodutiva masculina.
Palavras-chave
Diabetes Mellitus; Camellia sinensis; Chá branco; Stress oxidativo; Potencial antioxidante; Fertilidade masculina.
iv
Resumo alargado
A diabetes mellitus (DM) é um dos maiores problemas de saúde a nível mundial, devido ao estilo de vida e dieta actuais. Estima-se que vá afectar 300 milhões de pessoas em 2025. De acordo com a organização mundial de saúde a DM é uma doença metabólica caracterizada por uma hiperglicemia crónica. A DM tipo 2 (T2DM) é responsável por cerca de 95% de todos os casos de DM. A patologia da T2DM é complexa e acontece quando a produção de insulina pelas células beta não é suficiente para manter os níveis sanguíneos de glucose dentro do normal. A T2DM tem vindo a ser relacionada com infertilidade masculina, e alguns estudos reportaram que 35% dos pacientes com T2DM são inférteis. Além disso, estudos com modelos animais indicam que a T2DM causa efeitos deletérios nos parâmetros espermáticos, como a concentração, motilidade, viabilidade e morfologia. O principal responsável por estes problemas é o elevado stress oxidativo associado à T2DM. O stress oxidativo (OS) acontece quando existe um desequilíbrio entre a formação de espécies reactivas de oxigénio (ROS) e a protecção contra as mesmas. Apesar de serem importantes em diversos processos biológicos, as ROS, quando presentes em excesso, causam danos severos no ADN, nos lípidos, nas membranas celulares e nas proteínas. Assim sendo é importante manter os níveis de ROS debaixo de um apertado controlo. Num quadro de diabetes, diversos processos contribuem para uma formação excessiva de ROS. Os espermatozóides são particularmente sensíveis ao OS, visto que as suas membranas são ricas em ácidos gordos poli-insaturados, especialmente vulneráveis ao ataque das ROS que levam à destruição a membrana celular e à formação de produtos tóxicos para a célula, como o malondialdeído. Além do mais o ataque das ROS nas cadeias laterais das proteínas leva à formação de grupos carbonilo nas mesmas. Ambos os parâmetros tendem a ser usados como biomarcadores dos níveis de OS.
O chá é uma das bebidas mais consumidas a nível mundial e uma fonte de flavonóides, especialmente de derivados de catequinas, que possuem um elevado potencial antioxidante e anti-hiperglicémico. O chá branco (WTEA) é preparado a partir dos rebentos e folhas mais jovens da Camellia sinensis (L.), e apresenta o mais elevado poder antioxidante quando comparado com outros tipos de chá. Estudos recentes relatam que a ingestão regular de WTEA diminui a resistência à insulina, melhorando a sensibilidade à mesma.
Neste estudo pretendem-se avaliar os efeitos da ingestão de WTEA no OS testicular e na qualidade espermática num modelo animal de T2DM induzido por streptozotocina. Pretende-se avaliar Pretende-se o elevado poder antioxidante do WTEA pode levar à diminuição do stress oxidativo nos testículos e assim melhorar a qualidade espermática em indivíduos com T2DM.
Para o efeito foram usados três grupos experimentais de ratos Wistar: um grupo de controlo, um grupo T2DM induzido por streptozotocina e um grupo T2DM induzido por streptozotocina que consumiu chá branco regularmente.
v
Os nossos resultados mostram que conseguimos desenvolver um modelo animal de T2DM adequado, que apresenta as características principais da doença. Além do mais, os resultados mostram que o consumo regular de chá branco leva a uma acentuada diminuição do OS testicular em ratos T2DM, com o aumento do potencial antioxidante do tecido testicular e a diminuição dos principais marcadores de OS, tanto em lípidos como em proteínas. Não foram, no entanto, detectadas alterações no conteúdo e estado redox do principal antioxidante celular, a glutationa. Apesar disso, a diminuição do OS observada nos testículos causa um melhoramento nos parâmetros espermáticos dos ratos diabéticos, equiparando a qualidade espermática à observada para os ratos controlo.
Os resultados obtidos levam-nos a concluir que o chá branco origina uma diminuição do OS nos testículos de animais T2DM, devido ao efeito que tem na redução de ROS formadas. Este abaixamento nos níveis de OS testicular causa por sua vez uma melhoria nos parâmetros espermáticos, ao ponto de estes se equipararem aos de animais não diabéticos. Devido à crescente incidência da T2DM e às complicações associadas a esta patologia ao nível da infertilidade masculina é fundamental aprofundar o conhecimento sobre os mecanismos envolvidos nesse efeito deletério. Nessa perspectiva, o chá branco parece ser um agente terapêutico ideal, por ser natural, económico e potencialmente apresentar resultados significativos no combate à infertilidade masculina causada por T2DM.
vi
Abstract
Diabetes mellitus (DM) is one of the major public health problems and its increase incidence is closely related with a decrease in birth rates. Male infertility related with type 2 DM (T2DM) has been linked to reactive oxygen species (ROS) overproduction and increased testicular oxidative stress (OS). Tea is one of the most widely consumed beverages and its antihyperglycemic and antioxidant potential has been reported. Herein, we hypothesized that White Tea (WTEA) consumption by T2DM rats could prevent testicular OS preserving sperm quality. For that purpose, we used a neonatal STZ-induced diabetic rat model. At one month of age, water was substituted by WTEA during two months and testicular antioxidant potential and OS were evaluated, as well as sperm parameters in normal and T2DM rats drinking water or WTEA.
WTEA consumption improved glucose tolerance and insulin sensitivity in T2DM rats. WTEA consumption restored protein oxidation and lipid peroxidation to normal levels. Testicular antioxidant potential was increased by WTEA consumption in T2DM, while testicular OS was decreased. Nevertheless, glutathione content and redox state was not altered. After WTEA consumption by T2DM rats, sperm concentration was improved while sperm motility, viability and the abnormal spermatozoa reached normal values evidencing that epididymal sperm quality was restored. Overall, our results show that WTEA consumption causes an important improvement in sperm parameters and thus in male T2DM reproductive function, due to a significant decrease in testes ROS production. WTEA consumption can be a natural, economical and good strategy to counteract the deleterious effects of T2DM in male reproductive function.
Keywords
Diabetes Mellitus; Camellia sinensis; White tea; Oxidative stress; Antioxidant potential; Male fertility.
vii
Table of contents
Acknowledgements ... ii
Resumo ...iii
Resumo alargado ... iv
Abstract ... vi
Table of contents ... vii
List of figures ... ix
List of tables ... x
List of abbreviations ... xi
I. Introduction ... 1
1.Diabetes mellitus and Oxidative stress ... 2
1.1.Biomarkers of oxidative stress ... 7
1.1.1. Lipid peroxidation ... 7
1.1.2. Protein carbonyls ... 7
2.Diabetes mellitus and male infertility ... 8
3.White Tea ... 9
3.1.White tea chemical composition ... 10
3.2.Antioxidant potential of white tea and associated health benefits ... 13
3.3.Antidiabetic potential ... 14
II. Aims of the present study ... 16
III. Materials and methods ... 18
1 - Chemicals ... 19
2 - White tea infusion ... 19
3 - Animal Model and Experimental Design ... 19
4 - Insulin and glucose tolerance tests ... 20
5 - Sperm Parameters ... 20
viii
7 - Thiobarbituric acid reactive species assay ... 23
8 - Analysis of carbonyl groups ... 23
9 - Glutathione assay ... 24
10 - Statistical analysis ... 24
IV. Results ... 25
1. General characteristics of the STZ-induced T2DM model ... 26
2. White tea ingestion improves glucose tolerance and insulin sensitivity ... 27
3. Testicular tissue antioxidant potential of T2DM rats is increased by WTEA ingestion .... 28
4. Testicular tissue oxidative stress in T2DM rats is reduced by WTEA ingestion ... 29
5. WTEA ingestion doesn’t alter glutathione content and redox state... 30
6. Epididymal sperm quality is improved by the ingestion of white tea in diabetic rats .... 32
V. Discussion ... 36
VI. Conclusions ... 40
VII. References ... 42
VIII. Annexes ... 53
ix
List of figures
Figure 1 - Aldose reductase and the polyol pathway. ... 3
Figure 2 – The effect of AGEs on hyperglycemic cells. ... 4
Figure 3 – Consequences of PKC activation in hyperglycemic conditions. ... 5
Figure 4 - Production of superoxide by the mitochondrial electron-transport chain.. ... 6
Figure 5 – Chemical structure of the main catechins in white tea. (Dias, Tomás et al. 2013) 11 Figure 6 - Light microscopy image of a typical rat spermatozoon.. ... 21
Figure 7 - Microscopic images of a normal rat spermatozoon and various examples of morphological defects.. ... 22
Figure 8 - Effect of WTEA consumption by T2DM rats in glucose tolerance test and insulin resistance.. ... 27
Figure 9 - Effect of WTEA consumption by T2DM rats in antioxidant power of testicular tissue.. ... 28
Figure 10 - Effect of WTEA consumption by T2DM rats in lipid peroxidation of testicular tissue.. ... 29
Figure 11 - Effect of WTEA consumption by T2DM rats in protein oxidation of testicular tissue. ... 30
Figure 12 - Effect of WTEA consumption by T2DM rats in glutathione levels and glutathione redox state. ... 31
Figure 13 - Effect of WTEA consumption by T2DM rats in epididymal sperm concentration.. 32
Figure 14 - Effect of WTEA consumption by T2DM rats in epididymal sperm motility. ... 33
Figure 15 - Effect of WTEA consumption by T2DM rats in epididymal sperm viability. ... 34
x
List of tables
Table 1 - Average values of weight, blood glycemia, water intake and food consumption in
rats from the Control, STZ and WTEA group after 60 days of treatment. ... 26
xi
List of abbreviations
AGE - Advanced glycation end-productATP – Adenosine triphosphate AUC – Area under the curve DAG - Diacylglycerol DM - Diabetes mellitus DNA - Deoxyribonucleic acid DNPH - 2,4-Dinitrophenylhydrazine
DTNB - 5,5’-dithiobis-(2-nitrobenzoic acid) EC - Epicatechin
ECG - Epicatechin 3-gallate EGC - Epigallocatechin
EGCG - Epigallocatechin 3-gallate ETC – Electron transport chain FADH2 – Flavin adenine dinucleotide
FRAP - Ferric reducing antioxidant power GSH – Reduced glutathione
GSSG - Oxidized glutathione HBSS - Hank's balanced salt solution MDA -
Malondialdehyde
NAD+ – Nicotinamide adenine dinucleotide
NADPH – Nicotinamide adenine dinucleotide phosphate OS – Oxidative stress
PBS - Phosphate buffered saline PKC - Protein kinase C
PUFA - Polyunsaturated fatty acids PVDF - Polyvinylidenedifluoride
RAGE - Receptor for advanced glycation end-products ROS – Reactive oxygen species
xii
STZ – Streptozotocin
T1DM – Type 1 diabetes mellitus T2DM – Type 2 diabetes mellitus TBA –
Thiobarbituric acid
TBARS - Thiobarbituric acid reactive substances TCA – Tricarboxylic acid
TFA - Trifluoroacetic acid
TNB - 2-nitro-5-mercaptobenzoic acid TPTZ - 2,4,6-Tripyridyl-s-Triazine WHO – World Health Organization WTEA – White tea.
1
2
1. Diabetes mellitus and oxidative stress
Diabetes mellitus (DM) is an increasingly common, potentially devastating, expensive, treatable but incurable lifelong disease (Al-Attar and Zari 2010)). According to a widely accepted estimation, the number of diabetic patients will reach 366 million by the year 2030 (Wild, Roglic et al. 2004). It is a metabolic disorder of multiple aetiologies, characterized by chronic hyperglycemia and troublesome disruptions in carbohydrate, fat, and protein metabolisms emanating from deficiencies or disruptions in insulin secretion (Ugochukwu, Babady et al. 2003), defects in reactive oxygen species scavenging enzymes (Kesavulu, Giri et al. 2008), and high oxidative stress impairing pancreatic beta cells (Baliga and Sapsford 2009, Hamden, Jaouadi et al. 2011).
Type 1 DM results from an absolute deficiency of insulin due to an autoimmune destruction of the pancreatic beta cells, while Type 2 DM (T2DM) is characterized by impaired insulin secretion and increased insulin resistance (Consultation 1999). T2DM accounts for 90-95% of all diabetes cases (Tuei, Maiyoh et al. 2010). The pathogenesis of T2DM is complex and usually requires defects in both β-cell function and insulin sensitivity. Together, these abnormalities result in increased rates of glucose release by the liver and kidney as well as decreased clearance from the circulation (Kahn 2001). The risk of developing T2DM in humans increases with age, obesity, cardiovascular diseases and a lack of physical activity (Golay and Ybarra 2005, Carneiro, Giachini et al. 2010).
The levels of glycemia and insulinemia must be controlled in order to avoid later complications of T2DM, such as atherosclerosis, hypertension, hypertriglyceridemia, hypercholesterolemia, myocardial infarction, ischemic attacks, impotence, retinopathy and nephropathy (Stadler, Jenei et al. 2003). Diabetes has been linked to reactive oxygen species (ROS) since the early 90s (Baynes 1991). Nowadays it is widely accepted that oxidative stress is important in the development and progression of diabetes (Ceriello 2000). Diabetic patients usually suffer from increased production of free radicals or/and impaired antioxidant defenses (Bloch-Damti and Bashan 2005). ROS are formed from the reduction of molecular oxygen or by oxidation of water to yield products such as superoxide anion, hydrogen peroxide and hydroxyl radical. In a biological system, the mitochondria and nicotinamide adenine dinucleotide phosphate (NADPH) oxidase are the major sources of ROS production. In moderate amounts, ROS are important in several biological processes. In large quantities they can lead to damage in DNA, lipids, membranes and proteins (Rains and Jain 2011). Oxidative
3
stress happens when there is an overproduction of ROS and/or a decreased efficiency of radical scavengers, such as glutathione (Bravi, Armiento et al. 2006). Hyperglycemia is known to augment OS by increasing ROS formation and altering the normal redox state. Several mechanisms contribute to this, such as an increased polyol pathway flux, increased intracellular formation of advanced glycation end (AGEs) products, activation of protein kinase C, and an overproduction of superoxide in the mitochondria (Brownlee 2001).
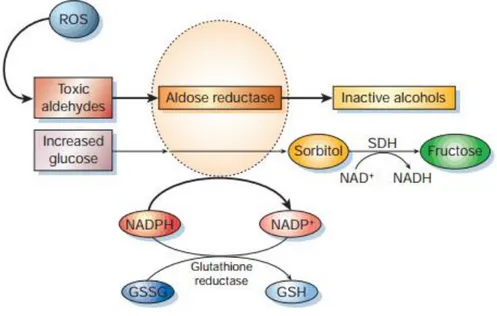
The polyol pathway involves the reduction of glucose to sorbitol in a NADPH-dependent manner. Aldose reductase is involved in this reduction. In normal glycemic conditions this enzyme has a low affinity to glucose, but in hyperglycemic conditions the enzymatic activity is enhanced and sorbitol production increases. This leads to a decrease in NADPH, since this reduction is NADPH-dependent. NADPH is in turn a co-factor in the reduction of glutathione (GSH), the most important intracellular antioxidant (Rains and Jain 2011). So, although this imbalance does not form ROS directly it leads to a lowering of GSH levels, and consequently to a redox imbalance in the cell (Srivastava, Ramana et al. 2005). This is summarized in Figure 1.
Figure 1 - Aldose reductase and the polyol pathway. When in hyperglycemic conditions, the affinity of
aldose reductase to glucose is increased, leading to a depletion of NADPH, lowering the levels of reduced glutathione (GSH), important in antioxidant defense. (Brownlee 2001)
Other of the mechanisms involved in OS in diabetic patients is the increased production of AGEs (Brownlee 2001). AGEs are formed when aldehyde or ketone groups originated from reducing sugars, covalently bind to the free amino groups of proteins, creating a Schiff’s base. This chemical structure eventually leads to the formation of carbonyl intermediates,
4
which can also be formed through glucose autoxidation. These carbonyl intermediates undergo several chemical mutations, originating irreversible AGE structures (Sato, Iwaki et al. 2006). By activating their cell surface receptor (RAGE), AGEs cause the activation of NADPH oxidase system, leading to the formation of ROS. ROS, in turn, lead to the activation of the Ras-MAPK pathway, activating nuclear factor kappa-light-chain-enhancer of activated B cells (NF-κB). This protein complex originates the transcriptional activation of several gene products, including RAGE itself and others associated with pathologies such as atherosclerosis and Alzheimer (Basta, Schmidt et al. 2004). This is summarized in figure 2 below.
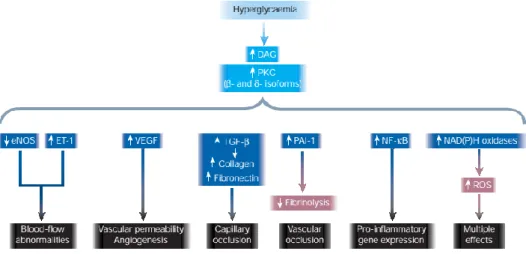
The activation of the DAG-PKC pathway is other of the mechanisms involved in OS in diabetic patients. Most of the different protein kinase C (PKC) isoforms are activated by diacylglycerol (DAG), a lipidic second messenger. Under hyperglycemic diabetic conditions there is an increase in dihydroxyacetone phosphate, a glycolytic intermediate. This intermediate is then reduced to glycerol 3-phosphate, increasing de novo synthesis of DAG, leading to the activation of PKC (Rains and Jain 2011). Polyol pathway and AGEs can also indirectly contribute to this activation (Ahmad, He et al. 2005). PKC activations leads to the alteration of several pathways, causing several complications, including circulation problems, Figure 2 – The effect of AGEs on hyperglycemic cells. The increased formation of AGEs in diabetic
patients causes changes in gene expression in the cells, deregulating several cellular processes. (Brownlee 2001)
5
often linked to diabetes (Rains and Jain 2011). These effects are summarized in figure 3 below.
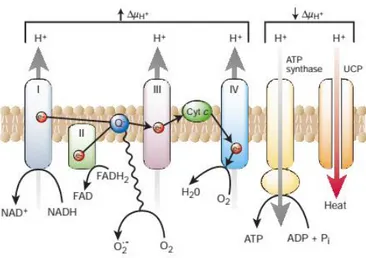
Other mechanism of increased ROS generation in diabetes is the overproduction of superoxide in the mitochondria. When in normal conditions, glycolysis begins in the cytoplasm. In this process NADH and pyruvate are generated, with NADH donating electrons and pyruvate donating reducing equivalents, entering the tricarboxylic acid (TCA) cycle to produce NADH and flavin adenine dinucleotide (FADH2) (Rains and Jain 2011). NADH and
FADH2 provide the electrons that fuel electron transport chain (ETC) and adenosine
triphosphate (ATP) production. Under hyperglycemic conditions, the number of substrates entering the TCA cycle is increased, and thus the number of reducing equivalents donating electrons to the ETC is also increased. Hyperglycemia increases the proton gradient above a threshold value resulting in overproduction of electron donors by the TCA cycle. This, in turn, causes a marked increase in the production of superoxide (Du, Edelstein et al. 2001). This process is summarized in figure 4 below.
Figure 3 – Consequences of PKC activation in hyperglycemic conditions. The activation of PKC has an
array of detrimental effect on several physiological mechanisms, often related with diabetes. (Brownlee 2001)
6
As previously referred, OS results from an overproduction of ROS and/or a deficiency in antioxidant defenses (West 2000). Glutathione is one of the most important intracellular antioxidant (Niedowicz and Daleke 2005), and both experimental and clinical studies have shown glutathione levels are altered in diabetic patients (Dinçer, Alademir et al. 2002). The relative amount of intracellular reduced and oxidized GSH is a measure of the cellular redox status. GSH is synthesized in two steps, using the amino acids glycine, cysteine, and glutamate, and is the cofactor for many antioxidant enzymes, such as GSH peroxidase, GSH reductase, and GSH-S-transferase (Niedowicz and Daleke 2005). The reduction observed in diabetic patients is caused by several mechanisms, such as the increased sorbitol synthesis (explained in figure 1) and the activity of enzymes involved in the pentose phosphate pathway, which generates NADPH, and is reduced in diabetic patients, lowering the capacity to regenerate oxidized glutathione (GSSG). With the disruption of the cellular membrane OS can also lead to the escape of glutathione from the cell (Dinçer, Alademir et al. 2002).
Figure 4 - Production of superoxide by the mitochondrial electron-transport chain.
Hyperglycemia causes a high mitochondrial membrane potential (ΔµH+), inhibiting electron
7
1.1. Biomarkers of oxidative stress
1.1.1. Lipid peroxidation
ROS, specifically hydroperoxides, have toxic effects on the cells both directly and through degradation to highly toxic hydroxyl radicals. They can also react with transition metals like iron or copper to form stable aldehydes such as malondialdehydes that will damage cell membranes (Maritim, Sanders et al. 2003). Peroxyl radicals can remove hydrogen from lipids, producing hydroperoxides that further propagate the free-radical pathway (Halliwell and Gutteridge 1990). A popular method to quantify the damage they cause is the thiobarbituric acid reactive substances (TBARS) test, which quantifies malondialdehyde (MDA). MDA is formed when polyunsaturated fatty acyl (PUFA) chains are attacked by hydroxyl radicals and reacts when heated in the presence of thiobarbituric acid, forming a pink color which can be used to quantify it using a spectrophotometric assay (West 2000). Several studies report an increase of lipid peroxidation in T2DM patients (Akkuş, Kalak et al. 1996, West 2000, Maritim, Sanders et al. 2003).
1.1.2. Protein carbonyls
ROS damage in proteins is usually measured through carbonyl content. Carbonyl groups are produced on protein side chains (especially of proline, arginine, lysine, and threonine) when they are oxidized. These moieties are chemically stable, which is useful for both their detection and storage. Carbonyl content can be measured in a diversity of ways, using techniques such as slot-blot, Western blot, enzyme-linked immunosorbent assay and spectrophotometrically (Dalle-Donne, Rossi et al. 2003). Protein carbonyl content is actually the most general indicator and by far the most commonly used marker of protein oxidation (Berlett and Stadtman 1997), and accumulation of protein carbonyls has been observed in several human diseases including Alzheimer’s disease , diabetes, inflammatory bowel disease and arthritis (Dalle-Donne, Rossi et al. 2003).
8
2. Diabetes mellitus and male infertility
According to the world health organization (WHO), infertility is the inability to conceive after one year of unprotected intercourse (Zegers-Hochschild, Adamson et al. 2009). Infertility is a growing problem nowadays, affecting between 13-18% of couples (Dubé, Hermo et al. 2008). There is also increasing number of young people with T2DM (Silink 2004), concordant with the increasing numbers of obesity and the western lifestyle (Fatouros and Mitrakou 2012).
T2DM has been widely associated with high prevalence of infertility and subfertility (Alves and Oliveira 2013, Rato, Alves et al. 2013). A recent study reported that 35% of T2DM patients are infertile (Vignera, Condorelli et al. 2012). Moreover, T2DM affects male fertility in several ways, causing delirious effects in the endocrine control of spermatogenesis and in spermatogenesis itself (Rato, Alves et al. 2013). T2DM also impairs penile erection and ejaculation (Scarano, Messias et al. 2006). There are also studies reporting a reduced sperm quality in T2DM patients (Vignera, Condorelli et al. 2012). Sperm analysis usually evaluates parameters such as concentration, viability, motility and morphology (Iammarrone, Balet et al. 2003, Du Plessis, Kashou et al. 2011).
Data from animal models strongly suggest that T2DM impairs several male reproductive processes, such as sperm concentration, motility and morphology (Vignera, Condorelli et al. 2012). T2DM fertility problems have been linked with increased oxidative stress (OS) (Lanzafame, La Vignera et al. 2009). In fact, and as explained before, diabetic patients usually suffer from increased production of free radicals or/and impaired antioxidant defenses (Bloch-Damti and Bashan 2005), although the involved mechanisms that impair male fertility are still poorly understood (Vignera, Condorelli et al. 2012, Alves and Oliveira 2013).
Within testes, during spermatozoa metabolic processes, several cellular sources including mitochondria, are known to produce significant amounts of ROS (Starkov 2008). Sperm cells are particularly vulnerable to ROS since they readily attack the PUFA in the cellular membrane initiating lipid peroxidation reactions which results in the release of several products, including malondialdehyde (MDA), that are especially dangerous for the viability of the cell (Mylonas and Kouretas 1999). Furthermore, several studies report an improvement in sperm parameters when treating T2DM patients with a wide range of antioxidants (Rabbani, Devi et al. 2009, Bal, Türk et al. 2011, Mohasseb, Ebied et al. 2011).
9
3. White tea
Tea is one of the most widely consumed beverages in the world, next to water (Vinson 2000, Cheng 2004) with a per capita consumption of approximately 120 mL/day (McKay and Blumberg 2002). This popularity is probably related with its sensorial properties, relatively low retail price, stimulating effects and potential health benefits (Baptista, Tavares et al. 1998, Baptista, da P Tavares et al. 1999). Despite tea being largely drunk for pleasure, its medicinal effects have been widely investigated, having a long, rich history with its first references nearly 5,000 years ago (Wheeler and Wheeler 2004). Tea is prepared as an infusion with the leaves of Camellia sinensis (L.), a plant cultivated in over 30 countries across the world that belongs to the Theaceae family (López and Calvo 2011). There are two main varieties of tea plants: C. sinensis var. sinensis, a small-leaved, bush like plant originating from China, which grows in several countries of Southeast Asia experiencing a cold climate, and C. sinensis var. assamica, a large-leaved tree discovered in the Assam region of India which grows in several countries with a semitropical climate (de Mejia, Ramirez-Mares et al. 2009). There are different types of tea depending on botanical varieties, geographical origin and processing (de Mejia, Ramirez-Mares et al. 2009). Concerning to the level of “fermentation”, it can be categorized into three types: not fermented (green and white tea), partially fermented (oolong tea) and completely fermented (black tea). Although this process is often assumed, incorrectly, to be fermentation, the most correct term should be oxidation (frequently followed by polymerization), which means exposure to air while drying (Bartlett 2004) and is a reaction catalyzed by the enzyme polyphenol oxidase (McKay and Blumberg 2002). To produce green tea, the leaves are rolled and steamed to minimize oxidation and inactivate polyphenol oxidase prior to drying (McKay and Blumberg 2002). In black tea production, after the leaves are rolled, which disrupts cellular compartmentation and brings phenolic compounds into contact with polyphenol oxidases, they undergo oxidation for 90–120 min (Rusak, Komes et al. 2008). Oolong tea is produced with a shorter fermentation period than black tea and has a taste and color somewhere between green and black teas (Del Rio, Stewart et al. 2004). WTEA is prepared from very young tea leaves or buds covered with tiny, silvery hairs, which are harvested only once a year in the early spring (Rusak, Komes et al. 2008). The buds may be shielded from sunlight during growth to reduce the formation of chlorophyll, giving the young leaves a white appearance (Alcazar, Ballesteros et al. 2007). In WTEA production it is steamed and dried immediately after picking to prevent oxidation, giving it a light, delicate taste (Rusak, Komes et al. 2008). According to Almajano et al. (2008), it is one of the less studied teas but its flavor is more accepted in Europe than that of green tea.
Although health benefits have been attributed to tea consumption since the beginning of its history, scientific investigations of this beverage and its constituents has been underway
10
for less than three decades. Tea contains several bioactive chemicals that are believed to have a wide range of physiological properties, including being stimulants (Liu, Liang et al. 2011) and antidepressants (Zhu, Shi et al. 2011), anti-inflammatory (Sano, Suzuki et al. 1999, Cavet, Harrington et al. 2011, Melillo de Magalhães, Dupont et al. 2012), antioxidant (Lin, Juan et al. 1996, Yen, Chen et al. 1997, Costa, Magalhães et al. 2009, Carloni, Tiano et al. 2012), antiatherosclerotic (Curin and Andriantsitohaina 2005), antihypertensive (Hodgson, Burke et al. 2005), anti-infectious diseases (Weber, Ruzindana-Umunyana et al. 2003), antimutagenic (Jain, Shimoi et al. 1989, Bhattacharya, Mukhopadhyay et al. 2011), anticarcinogenic and anticancer promoting (Katiyar, Agarwal et al. 1993, Carvalho, Jerónimo et al. 2010, Genkinger, Li et al. 2012), antimicrobial (Chou, Lin et al. 1999, Von Staszewski, Pilosof et al. 2011), hypolipidemic (Yoshino, Tomita et al. 1994, Huang and Lin 2012), hypocholesterolemic (Maron, Lu et al. 2003), neuroprotective (Almajano, Vila et al. 2011) and antidiabetic agents (Anderson and Polansky 2002, Abolfathi, Mohajeri et al. 2012), as well as improving immune responses (Bhattacharyya, Mandal et al. 2004, Sheikhzadeh, Nofouzi et al. 2011) in several studies.
Despite many of these physiological mechanisms being associated with the chemical properties of polyphenols and their healthy antioxidant effects, they are still controversial (Almajano, Carbo et al. 2008, Galleano, Oteiza et al. 2009). In spite of numerous data about the phenolic constituents, antioxidant activity and ameliorating effects of green and black tea on human health, little is known in this sense about WTEA, which is the rarest and the least processed tea (Rusak, Komes et al. 2008). The possible beneficial health effects of WTEA are being extensively investigated and have received a great deal of attention in recent years.
3.1. White tea chemical composition
The chemical composition of tea leaves has been thoroughly studied. The main constituents of tea include proteins, polysaccharides, polyphenols, minerals and trace elements, amino and organic acids, lignins, and methylxanthines (caffeine, theophylline, and theobromine) (Seeram, Henning et al. 2006, Moderno, Carvalho et al. 2009). Apart from the energizing effect due to methylxanthines such as caffeine, phenolic compounds have received immense attention among tea phytochemicals, in particular flavonoids (Cabrera, Giménez et al. 2003). Flavonoids are phenolic derivatives synthesized in substantial amounts (0.5% to 1.5%) that are widely distributed among plants (Vinson, Dabbagh et al. 1995) and have unique biological properties that may be responsible for many of the health benefits attributed to tea (Rietveld and Wiseman 2003). Over 4000 different flavonoids have been described, and they are categorized into flavonols, flavones, catechins, flavanones, anthocyanidins and
11
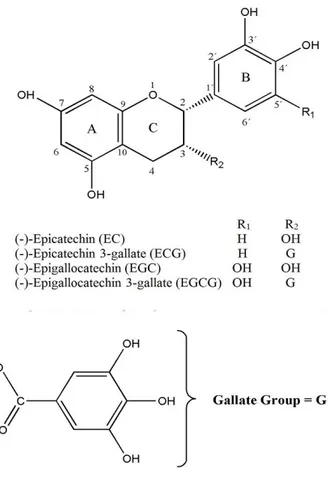
isoflavonoids (Firenzuoli, Gori et al. 2004). The major phenolics present in tea leaves are catechins (also known as flavan-3-ols) and their derivatives, which constitute up to 30% of their dry weight. The main catechins present in WT are: epicatechin (EC), (-)-epigallocatechin (EGC), collectively known as flavanol monomers, (-)-epicatechin 3-gallate (ECG), and (-)-epigallocatechin 3-gallate (EGCG) (Figure 5), which are flavanol gallates (de Mejia, Ramirez-Mares et al. 2009, Galleano, Oteiza et al. 2009). EC has an ortho-dihydroxyl group in the B-ring at carbons 3' and 4' and a hydroxyl group at carbon 3 on the C-ring (Figure 5). Differently of EC, EGC has a trihydroxyl group at carbons 3', 4', and 5' on the B-ring, while ECG has a gallate moiety esterified at carbon 3 of the C-ring and EGCG has both a trihydroxyl group at carbons 3', 4', and 5' on the B-ring and a gallate moiety esterified at carbon 3 on the C-ring (Figure 5)(Graham 1992).
Figure 5 – Chemical structure of the main catechins in white tea. (Dias, Tomás et al. 2013)
12
EGCG is the most abundant catechin in white and green teas, representing 50–80% of the total catechins, and is thought to contribute to the beneficial effects ascribed to tea (Khan and Mukhtar 2007, Ortsäter, Grankvist et al. 2012). The oxidation by polyphenol oxidase during processing leads to the formation of catechins and gallic acid complexes such as theaflavins, theaflavinic acids, thearubigins and proanthocyanidin polymers (Balentine, Wiseman et al. 1997, Song, Xu et al. 2012). Thearubigins, which have higher molecular weights, are poorly chemically characterized. Theaflavins are characterized by the benzotropolone ring structure and bright red-orange color, and contribute to the unique taste of black tea (Khan and Mukhtar 2007). A typical tea beverage, prepared in a proportion of 1 g leaf to 100 ml water in a 3-min brew, usually contains 250–350 mg tea solids, comprised of 30–42% catechins and 3–6% caffeine (Mukhtar and Ahmad 1999). Tea also contains small amounts of flavonols (kaempferol, quercetin and myricitin) in the form of glycosides (Balentine, Wiseman et al. 1997). Other bioactive compounds found in tea are gallic, p-coumaric and caffeic acids (Seeram, Henning et al. 2006). Tea also contains many amino acids, but L-theanine (γ-glutamylethylamide), specific to the tea plant, is the most abundant, accounting for 50% of the total amino acids (Dufresne and Farnworth 2000). It is a free amino acid and is thought to be a flavourous constituent of tea leaves. It constitutes between 1 and 2% of the dry weight of tea (Cartwright, Roberts et al. 1954). Chlorophylls, carotenoids, lipids, and volatile compounds are not major constituents in a tea brew but they play an important role in the development of the aroma (Dufresne and Farnworth 2000).
Each type of tea has a distinct composition. The relative catechins content of tea is dependent on how the leaves are processed prior to drying as well as geographical location and growing conditions (McKay and Blumberg 2002). The flavonoid concentration also depends upon the type of tea (e.g., blended, decaffeinated instant) and preparation (e.g., amount used, brew time, temperature) (McKay and Blumberg 2002). Highest concentrations of flavonoids are found in brewed hot tea (541-692 µg/mL) (Hakim, Weisgerber et al. 2000), less in instant preparations (90-100 µg/mL) and lower amounts in iced and ready-to-drink tea (Arts, van de Putte et al. 2000). According to the formation process it was reported that WTEA contains relatively high concentrations of catechins and low concentrations of theaflavins and thearubigins. Otherwise, the flavonol content in tea is less affected by processing, being present in comparable amounts in all teas (Balentine, Wiseman et al. 1997). Some reports showed that the concentrations of total polyphenols, total catechins, caffeine, gallic acid, theobromine, EGC, ECG and EGCG are significantly higher in the WTEA compared to green tea (Santana-Rios, Orner et al. 2001, Hilal and Engelhardt 2007). Thus, the possible increased antioxidant activity of WTEA could be related to higher concentrations of several of the major constituents (Santana-Rios, Orner et al. 2001). However, there are studies reporting that green tea is a richer source of phenolics than WTEA (Rusak, Komes et al. 2008).
13
So, due to the contradictory studies reported in this field, the phenolic content does not serve as a criterion of differentiation between green tea and WTEA.
3.2. Antioxidant potential of white tea and associated health benefits
In recent years, antioxidant components have aroused great interest because of their ability to scavenge free radicals, thereby inhibiting oxidation (Wongkham, Laupattarakasaem et al. 2001, Jin, Hakamata et al. 2004). Most living organisms possess efficient enzymatic and nonenzymatic defense systems against excess production of ROS. However, different external factors (smoke, diet, alcohol, some drugs) and aging decrease the capability of such endogenous antioxidant defenses, resulting in disturbances of the redox equilibrium that is established in healthy conditions (Willett 1994, Rietveld and Wiseman 2003). Chronic exposure to ROS can damage DNA, membrane lipids, lipoproteins, and functional and structural proteins (Sohal and Weindruch 1996, Halliwell 1997). As during the past years, ROS-induced oxidative damage has been linked to the development of several human diseases such as cardiovascular diseases, diabetes mellitus, chronic inflammation, neurodegenerative disorders and certain types of cancer (Valko, Rhodes et al. 2006, Valko, Leibfritz et al. 2007), its reduction is seen as beneficial to public health. Therefore, antioxidants that scavenge ROS may be of great value in preventing the onset and/or the progression of oxidative diseases (Willett 1994). Tea polyphenols, especially catechin derivatives, are considered to be potent antioxidant agents, with a particularly important role in protecting against these deleterious diseases (Almajano, Carbo et al. 2008). So, teas could be taken as a good complement to antioxidants intake in the human diet (Alarcón, Campos et al. 2008).
The antioxidant activity of phenolic compounds is mainly due to their redox properties, which allow them to act as reducing agents, singlet-oxygen quenchers and metallic-ion chelators (Atoui, Mansouri et al. 2005). Numerous studies have demonstrated that tea catechins and polyphenols are effective scavengers of physiologically relevant ROS in vitro, including superoxide (Nanjo, Honda et al. 1993, Nakagawa and Yokozawa 2002), peroxyl radicals, singlet oxygen (Guo, Zhao et al. 1999) and others (Scott, Butler et al. 1993, Haenen, Paquay et al. 1997). Several structures appear to be important for these antioxidant activities of tea polyphenols (Figure 5), including the ortho-3’4’-dihydroxyl (catechol) group in the B-ring, that promotes the formation of a stable phenoxyl radical due to effective electron delocalization (Wiseman, Balentine et al. 1997) or the 3’4’5’-trihydroxyl (gallate) group in the B-ring, a gallate group esterified at the 3 position of the C-ring, and hydroxyl groups at the 5 and 7 positions of the A-ring (Rice-Evans, Miller et al. 1996).
14
The knowledge of pharmacokinetics, absorption, distribution, metabolism, and excretion of tea components is essential to determine its potential bioactivities and overall significance in disease prevention (Wheeler and Wheeler 2004). Despite the proven antioxidant capacity of tea polyphenols, many clinical studies and animal models have shown that these compounds, especially the polymers, esters, and glycosides, are abundant, but are not always absorbed by oral administration. The functional effect of the compound depends not only on the amount ingested, but on its bioavailability (Holst and Williamson 2008). Several clinical trials have demonstrated that a single dose of tea improves plasma antioxidant capacity of healthy adults within 30 to 60 minutes after ingestion (Benzie, Szeto et al. 1999, Leenen, Roodenburg et al. 2000, Sung, Nah et al. 2000). In a recent study Koutelidakis et al. (2009) reported that supplementation of WTEA extract for a five consecutive days not only increases the antioxidant capacity of plasma but also acts in different organs in mice such as heart and lungs. Despite catechins, especially EGCG, theaflavins and flavonol glycosides are also thought to be responsible for antioxidative properties of tea. The antioxidant effectiveness depends on the tea variety and the content of EGCG is very important (Hilal and Engelhardt 2007). Several epidemiological studies, experimentation with animals, and in vitro studies lead to the conclusion that WTEA has potentially protective effects for a wide variety of health conditions that are subsequently summarized. However, the evidence is not always clear cut.
3.3. Antidiabetic potential
In recent years, interest has increased in using natural products for pharmacological purposes, as a form of complementary or replacement therapy. Published reports show that numerous extracts obtained from plants are effective in reducing glycemia, causing fewer side effects and with lower cost than the usual antidiabetic agents (Pushparaj, Tan et al. 2000, Gupta, Kesari et al. 2005, Lee and Sohn 2009, Sohn, Kim et al. 2010). There is some evidence that tea is a hypoglycemic agent (MacKenzie, Leary et al. 2007). In vitro rat studies suggest that EGCC and other catechins and theaflavins help prevent hyperglycemia by enhancing insulin activity and possibly by preventing damage to β-cells (Anderson and Polansky 2002). Although the exact mechanisms by which tea polyphenols ameliorate glycemic control are not clear at the moment, all the studies suggest that polyphenols don’t increase insulin secretion, but decrease insulin resistance and improve insulin sensitivity (Islam 2011).
Various studies have reported that DM is associated with increased formation of ROS and decreased antioxidant potential (Rahimi, Nikfar et al. 2005). Increased OS has been proposed to be one of the major causes of the hyperglycemia-induced trigger of diabetic
15
complications (Valko, Leibfritz et al. 2007). Due to these events, the cellular balance between radical formation and protection against them is disturbed. In both T1DM and T2DM there is increased OS (Naziroğlu and Butterworth 2005). It was previously shown that EGCG ameliorates cytokine-induced β-cell damage in vitro (Han 2003) and prevents the decrease of islet mass induced by treatment with multiple low doses of streptozotocin (STZ) in vivo (Song, Hur et al. 2003). However, in a latter study STZ was co-injected with EGCG, which possesses strong antioxidative activity (Abe, Kashiwagi et al. 2000), and it was unclear whether the protective effects observed in this study were due to direct inactivation of the co-injected STZ. Another study with EGCG reported that supplementation with it reduces serum glucose, total cholesterol and triglyceride and LDL-cholesterol in STZ-induced diabetic rats (Roghani and Baluchnejadmojarad 2010). This effect however can be different from the effect of the tea extract, with all of its bioactive components. In contrast to studies indicating an antioxidative capacity of EGCG, investigations in the insulinoma cell line HIT-T15 showed that EGCG treatment was associated with increased production of ROS and reduced cell viability (Suh, Chon et al. 2010). Thus, the antidiabetic effects of EGCG are not entirely clarified. The in vivo relevance of WTEA catechins antidiabetic potential remains to be demonstrated. Recently, WTEA was reported to have strong lipolytic and anti-adipogenic activity in vitro (Söhle, Knott et al. 2009). Hence, WTEA may demonstrate antidiabetic effect by reducing OS and hyperlipidemia followed by insulin resistance (Islam 2011). Since diabetes mellitus is increasing worldwide as is associated with several complications, there is a large interest in finding an effective therapy and WTEA seems to be a good candidate.
16
17
In this study we aimed to evaluate the effects of regular WTEA consumption in testicular OS and sperm quality on a STZ induced diabetic animal model. In order to assess sperm quality, we evaluated epididymal sperm concentration, viability, motility and morphology. Moreover, the antioxidant potential, lipid and protein damage and glutathione content of the testicular tissue were evaluated to explore the effect of WTEA ingestion on testicular OS.
18
19
1 - Chemicals
All chemicals were purchased from Sigma-Aldrich (St. Louis, MO, U.S.A) unless specifically stated.
2 - White tea infusion
White tea was purchased on the Portuguese market. Samples were subjected to infusion (1g/100 mL) at 100ºC, over 3 min, according to the manufacturer’s instructions. The resulting infusion was filtered with a sterile syringe filter of 0.2 µm cellulose acetate (VWR, Pennsylvania, U.S.A.).
3 - Animal model and experimental design
Eighteen male Wistar rats were used in this study. The animals were obtained from an accredited animal colony (Health Sciences Research Center, University of Beira interior). They were maintained on ad libitum food in a room with constant temperature (20±2ºC) and a 12 hour cycle of artificial lightning. Animals were randomly distributed into a control, a STZ induced T2DM and a WTEA fed group. Animals from T2DM and WTEA groups were injected with a low-dose of STZ to achieve a T2DM model, according to the method used by Iwase et al (1986). Briefly, two-day-old male Wistar rats were fasted for 8 hours. T2DM and WTEA groups of animals were injected with STZ (40 mg/kg, IP) freshly diluted in citrate buffer (0.1 M, Na citrate, pH 4.5). The control group received only the vehicle solution in an equivalent volume. All groups were fed a standard chow diet (4RF21 certificate, Mucedola, Italy). After reaching 1 month of age, the water of the WTEA group animals was replaced by a WTEA infusion which was given during two months. Animal’s blood glucose levels were monitored every 6 days. Non-fasting glycemia was determined using a glucometer (One Touch Ultra Lifescan-Johnson, Milpitas, CA, USA). After treatment, animals were killed by cervical dislocation. Testicles were removed, weighed and stored at -80º C. All animal experiments were performed according to the “Guide for the Care and Use of Laboratory Animals” published by the US National Institutes of Health (NIH Publication No. 85-23, revised 1996) and the rules for the care and handling of laboratory animals (Directive 86/609/EEC).
20
4 - Insulin and glucose tolerance tests
At 3 months of age, animals were submitted to a glucose tolerance test, as previously described by Rato and collaborators (2013). Briefly, 14-18 hours before the test, food was removed and animals were kept in fast. An intraperitoneal injection with 6 mL of glucose 30% (w/v) per kg of body weight was given to each animal. Blood samples for glucose measurement were obtained from the tail the moment before glucose injection and after 30, 60, 90 and 120 min. At that age, the animals were also submitted to an insulin resistance test, as described by Holmes and collaborators (2008). Briefly, an intraperitoneal injection with 0.75 U insulin per kg of body weight was given to each animal. Blood samples for glucose measurement were obtained from the tail the moment before insulin injection and after 30, 60, 90 and 120 min.
5 - Sperm Parameters
One cauda epididymis of each animal was placed in 3 mL of a 37ºC solution of Hanks Balanced Salt Solution (HBSS). The cauda was then minced with a scalpel, allowing sperm to be dispersed in the medium. Therefore the suspension was incubated for 5 minutes at 37ºC. This suspension was then used to evaluate sperm concentration, motility, viability and morphology. The remaining testicular tissue was collected and stored at -80ºC. Sperm motility was determined immediately after epididymis isolation by placing a drop (100 µL) of the sperm suspension in a pre-warmed microscope slide. Then the percentage of motile sperm was evaluated in 10 random fields (100x magnification). The final motility was the average percentage in those 10 fields. Sperm concentration was assessed by diluting sperm in HBSS by a 1:50 factor. This solution was used to fill the two grids of a Neubauer counting chamber. Sperm cells were then counted (400x magnification) on an optical microscope. A negrosin-eosin stain was used to evaluate sperm viability as described elsewhere (Rato, Alves et al. 2013). Briefly, 5 µL of sperm suspension were mixed with 10 µL of 0.5% eosin/negrosin stain. This mixture was placed in a pre-warmed microscope slide. To calculate sperm viability 333 sperm cells were counted in random fields using a light microscope with oil immersion (1000X magnification). Viable sperm cells appeared white (Figure 6, panel A), while non-viable sperm appeared pink (Figure 6, panel B), indicating its plasma membrane was compromised, leading to an uptake of the dye.
21
Figure 6 - Light microscopy image of a typical rat spermatozoon. Viable rat spermatozoon (A) and non-viable rat spermatozoon (B) stained with Eosin/Negrosin (1000× magnification).
Sperm morphology was evaluated using a Differential Quick Stain Kit as previously described by Lopes and collaborators (2009). Concisely, 10 µL of the sperm suspension were placed on a pre-warmed microscope slide and dried at 37ºC. The slide was then stained using three sequential solutions, containing fixative, eosin dye and thiazin-like dye, according to the supplier’s protocol. 333 sperm cells were counted in random fields using a light microscope with oil immersion (1000X magnification). Sperm cells with hook-shaped heads and no visible defects were considered normal, while those with head or tail abnormalities were considered abnormal (Figure 7).
22
Figure 7 - Microscopic images of a normal rat spermatozoon and various examples of morphological defects. A – Normal sperm. B – Decapitated head. C – Bent neck. D – Flattened Head. E – Tail defect. (1000x magnification).
6 - Ferric reducing antioxidant power assay
The ferric reducing antioxidant power (FRAP) of the testicular samples was performed according to the colorimetric method described by Benzie and Strain (1996). Briefly, testicular tissue was homogenized in phosphate buffer (pH 7.4). Protein concentration was determined by the Bradford micro-assay using BSA as a standard. Working FRAP reagent was prepared by mixing acetate buffer (300 mM, pH 3.6), 2,4,6-Tripyridyl-s-Triazine (TPTZ) (10 mM in 40 mM HCl) and FeCl3 (20 mM) in a 10:1:1 ratio (v:v:v). 180 µL of this reagent were
mixed with 10 µg of tissue homogenate. The reduction of the Fe3+-TPTZ complex to a colored
Fe2+-TPTZ complex by the samples was monitored immediately after adding the sample and
40 min later, by measuring the absorbance at 595 nm using an Anthos 2010 microplate reader (Biochrom, Berlin, Germany). Antioxidant potential of the samples was determined against standards of ascorbic acid, which were processed in the same manner as the samples. Absorbance results were corrected by using a blank, with H2O instead of sample.
23
7 - Thiobarbituric acid reactive species assay
Thiobarbituric acid reactive species (TBARS) are formed as a byproduct of lipid peroxidation, which can be detected by the TBARS assay using thiobarbituric acid (TBA) as a reagent. This peroxidation reaction produces MDA that reacts with TBA in conditions of high temperature and low pH, generating a pink colored complex, which absorbs at 532 nm (Ohkawa, Ohishi et al. 1979). TBARS assay was carried out by the method described by Iqbal and collaborators (1996) with slight modifications. Testicular tissue was homogenized in phosphate buffer (pH 7.4). Protein concentration was determined by the Bradford micro assay using BSA as a standard. Briefly, 20 µg of tissue homogenate, 0.01 mL Tris-HCl buffer (150 mM, pH 7.1), 0.01 mL ferrous sulphate (1.0 mM), 0.01 mL ascorbic acid (1.5 mM) and 0.06 mL H2O were mixed in a reaction tube. This mixture was incubated at 37ºC for 15 min. The reaction was stopped by addition of 0.1 mL of trichloroacetic acid (10% w/v). Subsequently, 0.2 mL of TBA (0.375% w/v) were added and all samples were incubated for 15 min at 100ºC. Finally, samples were centrifuged at 1000.g for 10 min. The amount of MDA formed in each sample was estimated by measuring optical density at 532 nm using a UV-VIS spectrophotometer (Shimadzu, Kyoto, Japan) against a blank. The results were expressed as nmol of TBARS/mg protein.
8 - Analysis of carbonyl groups
Protein carbonyl content is commonly used as a marker for protein oxidation. To evaluate protein carbonyl groups a Slot Blot was performed. First, samples were derivatized using 2,4-dinitrophenylhydrazine according to the method developed by Levine and collaborators (1990). Briefly, a volume containing 40 µg of lyophilized testicular tissue homogenized in phosphate buffer was mixed with the same volume of sodium dodecyl sulfate (SDS) 12% and centrifuged to minimize nucleic acid interference in the assay. The samples were then mixed with two volumes of 2,4-Dinitrophenylhydrazine (DNPH) 20 mM diluted in trifluoroacetic acid (TFA) 10% and incubated for 30 min in a dark environment. The reaction was then stopped using 1.5 volumes of Tris 2M with 18% β-mercaptoethanol. Samples were then diluted to a concentration of 0.001 µg/µL using phosphate buffer saline (PBS). Activated polyvinylidenedifluoride (PVDF) membranes were used in the slot-blot technique, which was performed using a Hybri-slot manifold system (Biometra, Göttingen, Germany). The membranes were then blocked by incubating during 90 min with a 5% non-fat milk Tris-buffered saline solution (TBS) with 0.05% Tween20 containing 5% skimmed dried milk.
24
Afterwards, the blocked membranes were incubated overnight with rabbit anti-DNP antibody (1:5000; Ref. D9656; Sigma Aldrich, St. Louis, MO, USA). Samples were visualized using goat anti-rabbit IgG-AP (1:5000; Ref. Sc2007; Santa Cruz Biotechnology, Heidelberg, Germany). Membranes were then reacted with ECF (GE Healthcare, Buckinghamshire, UK) and read using a BioRad FX-Pro-plus (Bio-Rad, Hemel Hempstead, UK). Densities from each band were quantified using the BIO-PROFIL Bio-1D Software from Quantity One (VilberLourmat, Marne-la-Vallée, France).
9 - Glutathione assay
Total glutathione and reduced glutathione levels in the testicular tissue were evaluated using a method developed by Baker and collaborators (1990), with some adaptations. Briefly, 5 mg of lyophilized testicular tissue were homogenized with 50 µL of 5% 5-sulfosalicylic acid (SSA) and centrifuged at 10000.g for 10 minutes. The supernatant was then collected, diluted 5-fold and used as samples for the total glutathione essay. To evaluate GSH levels samples were first derivatized with vinylpyridine. This was achieved by incubating 10 µL of 1 M 2-vinylpyridine solution with each sample for 60 minutes. The remainder of the process was equal for both the total and reduced glutathione essays. Glutathione levels were measured using a kinetic essay in which glutathione causes a continuous reduction of 5,5’-dithiobis-(2-nitrobenzoic acid) (DTNB) to 2-nitro-5-mercaptobenzoic acid (TNB), which can then be measured spectrophotometrically at 412 nm. Standards with known concentrations (50, 25, 12.5, 6.25 and 3.125 µM) were prepared using stock solution and serial dilution, and a standard curve was created. The results were expressed as nmol of total glutathione per mg of tissue. The levels of oxidized glutathione were calculated by subtraction of the results obtained for total glutathione and reduced glutathione. These results were expressed as fraction of total glutathione levels.
10 - Statistical analysis
Statistical significance was assessed by one-way ANOVA, followed by Bonferroni post-test using GraphPad Prism 5 (GraphPad Software, San Diego, CA, USA). All data are presented as mean ± SEM. Differences with p<0.05 were considered statistically significant.
25
26
1. General characteristics of the STZ-induced T2DM model
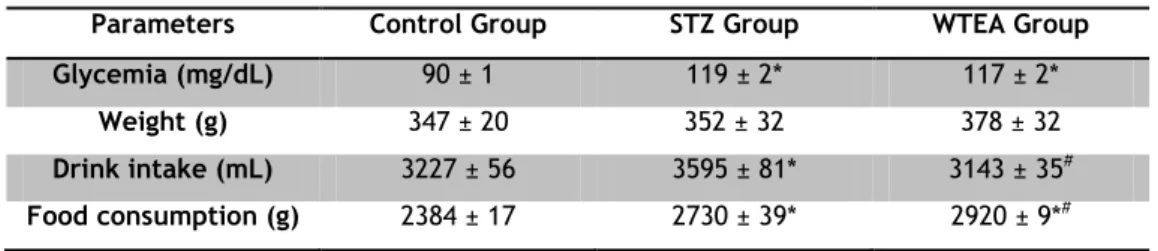
After 60 days of treatment, STZ-treated animals presented a similar weight (352±32 g) to animals of control group (347±20 g) (Table 1). As could be expected, STZ-treated animals ingested more food (2730±39 g) than the animals of the control group (2384±17 g). Interestingly, STZ-treated rats also consumed significantly more water (3595±81mL) than control rats (3227±56 mL). Finally, STZ-treated rats developed typical T2DM characteristics. The average glycemia significantly increased from 90±1 mg/dL in rats from the control group to 119±2 mg/dL in STZ-treated rats (Table 1).
Table 1 - Average values of weight, blood glycemia, water intake and food consumption in rats from the
Control, STZ and WTEA group after 60 days of treatment.
Parameters Control Group STZ Group WTEA Group
Glycemia (mg/dL) 90 ± 1 119 ± 2* 117 ± 2*
Weight (g) 347 ± 20 352 ± 32 378 ± 32
Drink intake (mL) 3227 ± 56 3595 ± 81* 3143 ± 35#
Food consumption (g) 2384 ± 17 2730 ± 39* 2920 ± 9*#
Results are expressed as means ± SEM (n=6 for each condition). * Significantly different relatively to control (P<0.05). # Significantly different relatively to STZ (P<0.05).
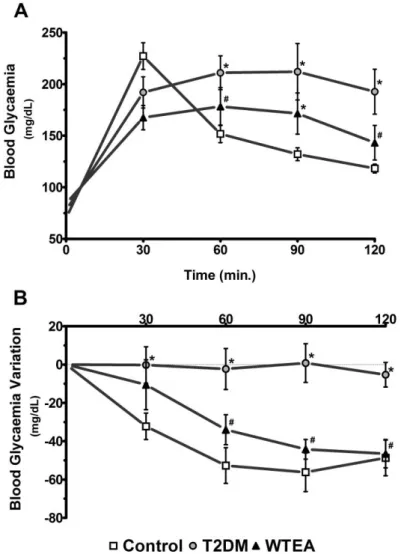
Moreover, STZ-treated rats developed glucose intolerance, as can be seen by the significantly higher area under the curve (AUC) the STZ-treated rats presented (22508 arbitrary units) in the glucose tolerance test in relation to the control group (18153 units) (Figure 8, Panel A). The insulin resistance test further confirmed this, since the STZ-treated group presented a significantly higher AUC of 12250 units compared to the control rats with 7420 units, signifying a much higher insulin resistance in the STZ-treated group, characteristic of T2DM (Figure 8, Panel B).
27
2. White tea ingestion improves glucose tolerance and insulin
sensitivity
Animals were subjected to the glucose tolerance test and the AUC was analysed. T2DM rats drinking WTEA showed a significantly smaller (18932 units) AUC than the T2DM rats drinking water (22508 units) (Figure 8, Panel A). Besides, WTEA drinking T2DM rats demonstrated a significantly lower insulin resistance (9026 units) compared to water-drinking T2DM rats (12250 units), when subjected to the insulin sensitivity test (Figure 8, Panel B). Figure 8 - Effect of WTEA consumption by T2DM rats in glucose tolerance test and insulin resistance. Panel A shows blood glucose levels (mg/dL) in control (□), T2DM (o) and white tea
(WTEA) drinking T2DM (▲) rats, measured during the intraperitoneal glucose tolerance test. Panel B displays blood glucose levels variation (mg/dL) in control (□), T2DM (o) and WTEA drinking T2DM (▲) rats, measured during the intraperitoneal insulin resistance test. Results are expressed as mean ± SEM (n=6 for each condition). Significant results (p<0.05) are indicated: * vs. control; # vs. T2DM.
28
Noteworthy, T2DM rats drinking WTEA showed no significant differences in the glucose tolerance test and the insulin resistance test, comparatively to the rats of control group.
3. Testicular tissue antioxidant potential of T2DM rats is
increased by WTEA ingestion
Antioxidant capacity of the testicular tissue was determined by the FRAP essay. The FRAP assay measures the potential of an antioxidant to reduce ferric (III) to ferrous (II) in a redox-linked colorimetric reaction that involves single electron transfer (Benzie and Strain 1996). The reducing power of a compound/extract serves as a direct and significant indicator of its potential antioxidant activity (FRAP value). Our results show that WTEA consumption significantly increased the antioxidant potential of the testicular tissue presented from 2.4±0.2 µmol/mg protein in the T2DM rats to 3.5±0.3 µmol/mg protein. Noteworthy, testicular antioxidant power of T2DM rats drinking WTEA, showed no significant differences relatively to the control group (5.7±0.6 µmol/mg protein) (Figure 9).
Figure 9 - Effect of WTEA consumption by T2DM rats in antioxidant power of testicular tissue. Ferric reducing antioxidant power (FRAP) of the control, the T2DM
and white tea (WTEA) drinking T2DM rats, measured in the testicular tissue. The antioxidant power is expressed by the FRAP value (µmol of antioxidant potential/mg protein). Results are presented as mean ± SEM (n=6 for each condition). Significant results (p<0.05) are indicated: * vs. control; # vs. T2DM.
29
4. Testicular tissue oxidative stress in T2DM rats is reduced by
WTEA ingestion
Diabetes has been linked to ROS overproduction since the early 90s (Baynes 1991). These circumstances lead to damage in lipids and proteins resulting in severe deleterious effects (Rains and Jain 2011). ROS have extremely short half-lives and thus, they are very difficult to measure directly. Instead, several products induced by lipid peroxidation, such as TBARS, can be measured and used as an accurate indicator of lipid damage. Using the TBARS assay, it was possible to detect a significant decrease on lipid peroxidation to 0.041±0.003 nmol/mg tissue in the T2DM rats drinking WTEA, when compared to T2DM rats drinking water which presented a lipid peroxidation of 0.054±0.002 nmol/mg tissue (Figure 10). Again, no significant differences were found concerning lipid peroxidation in the testes of T2DM rats drinking WTEA and rats from the control group (0.046±0.003 nmol/mg tissue) (Figure 10).
Figure 10 - Effect of WTEA consumption by T2DM rats in lipid peroxidation of testicular tissue. Figure shows thiobarbituric acid reactive substances (TBARS) in
control, T2DM and white tea (WTEA) drinking T2DM rats, measured in the testicular tissue. Results are expressed in nmol/mg tissue and are presented as mean ± SEM (n=6 for each condition).
30
To measure protein damage due to ROS, the presence of carbonyl groups was quantified. Carbonyl groups on proteins result from ROS attack and thus can be used to directly measure protein damage related to OS (West 2000). The T2DM rats drinking WTEA exhibited a significant decreased of 26±4% in carbonyl content compared to T2DM rats drinking water. Nevertheless, T2DM rats drinking WTEA, presented significantly higher carbonyl content than rats of control group (approximately 1.5 times higher) (Figure 11).
5. WTEA ingestion doesn’t alter glutathione content and redox
state
As discussed above, T2DM is often associated with increased OS. Indeed, our results showed that not only T2DM rats presented a significant increase in testes OS but also that WTEA consumption decreased testes OS. One of the most important cellular antioxidant mechanisms is exerted by glutathione. Therefore we investigated glutathione content. Our results show that no significant differences were found on total glutathione content in testes of rats from all experimental groups (Figure 12). The total glutathione content in testes of T2DM WTEA-drinking, T2DM and control rats was 50.2±6.0 nmol/mg tissue, 44.1±1.5 nmol/mg tissue and 50.7±3.9 nmol/mg tissue, respectively. Moreover, no significant differences were
Figure 11 - Effect of WTEA consumption by T2DM rats in protein oxidation of testicular tissue. Figure displays carbonyl group levels in control, the T2DM and
WTEA drinking T2DM rats, measured in the testicular tissue. Results are expressed in relation to control and presented as mean ± SEM (n=6 for each condition). Significant results (p<0.05) are indicated: * vs. control; # vs. T2DM.