A Work Project, presented as part of the requirements for the Award
of a Master Degree in Finance from the NOVA – School of Business
and Economics.
Determinants of Bond’s Mispricing
Miguel da Silva Alves – 24580
A Project carried out on the Master in Finance Program, under the
supervision of:
Martijn Boons
Determinants of Bond’s Mispricing
Abstract
This paper attempts to analyse the existence of underpricing in bond offers Banco Carregosa participated between October 2014 and June 2018 and the factors affecting bond’s mispricing in two different time frames, 1st day and 1st month. It was found that, for a very short term, underpricing is mostly affected by credit risk factors and macroeconomic conditions and partially described by liquidity aspects and information asymmetries. For longer periods, liquidity aspects and macroeconomic context are the main determinants. Credit risk factors lose their influence and information asymmetries continue to partially affect bond’s mispricing, however, represented by a different factor.
Keywords: Bond Mispricing, Initial Bond Offering, Underpricing Determinants.
I would like to thank Mr. João de Assunção, Mr. Joel Alves and Mrs. Sofia Abrunhosa from Banco Carregosa - Fixed Income Department, Professor Martijn Boons, the supervisor of this thesis and Mrs. Celeste Artilheiro for the sustained support and guidance.
Table of Contents
I. Introduction ……….…... 4
II. Literature Review ………... 6
A. Underpricing …….…….…….…….…….…….…….…….…….……… 6
B. Credit Risk …….…….…….…….…….…….…….…….…….…………...……… 6
C. Information Asymmetry ….…….…….…….………...…... 7
D. Book Building (Information Asymmetry) …….…….…….………...…... 9
E. Liquidity ….…….…….…….…….…….…….…….…….………….…………... 10
F. Macroeconomic Factor – Market Credit Risk …..….…….………... 10
III. Methodology ………...……… 12
A. Hypothesis Testing Techniques .…….…….…….…….………….…………..…... 12
B. Collection of Data Set .…….…….…….………..… 13
C. Calculation of Underpricing .…….…….…….…….………..……….. 13
D. CDS Index ....…….…….…….…….………..……….. 14
E. Sample Summary .…….…….…….…….……….………... 15
IV. Presentation of Results and Discussion ……….. 16
A. Univariate Analysis - 1st Trading Day .…….…….…….………... 18
B. Univariate Analysis - 1st Trading Month .…….…….…….…….……….. 21
C. Multivariate Analysis - 1st Trading Day .…….…….…….……….…... 24
D. Multivariate Analysis - 1st Trading Month .…….…….…….……….... 29
V. Conclusion .…….…….…….…….…………...…….…….…….…….………... 32
VI. References .…….….……...…….……….…….…….…….………...…. 36
I.
Introduction
For several years, past literature has given more importance to issues on equity markets addressing limited considerations to the ones taking place in fixed income markets. Nevertheless, several studies have indicated that bond markets are substantially bigger than stock markets. According to a study from (SIFMA 2018a, 2018b), only in US, fixed income markets in 2018 accounted 42 trillion USD in value versus 32 trillion USD in equity markets. In line with (Lund et al. 2018), corporate bond markets have increased 2.5 times since 2008 financial crisis as many corporations around the world have shifted toward bond financing because commercial bank lending has been subdued. As stated by (Kwan 2010), as a response for the financial crises, US banking industry tightened their lending terms and increased significantly the loan spreads over FED’s rate. Moreover, regulations, as Basel III, have diminished credit supply as banks are obliged to fulfil minimum capital requirements and certain leverage ratios (Repullo and Suarez 2009; Slovik and Cournede 2015; Barth and Miller 2018). Similar to stock offers, researchers have advocated evidences of underpricing in fixed income issues and as a result, the existence of opportunities for investors to capture excess returns. Authors appoint firm’s specific characteristics, bond aspects and macroeconomic conditions as the main determinants affecting the level of bond’s underpricing. The central questions this paper attempts to analyse are the presence of underpricing/ overpricing in fixed income issues that Banco Carregosa participated between October 2014 and June 2018 and the factors that influence bond’s mispricing for two different time ranges, the 1st trading day and 1st trading month. As a result, it was intended to examine whether the factors affecting mispricing for a very short term are similar to the factors affecting bond’s mispricing for a longer time horizon. It was considered corporate bond issues made by public and private firms, including both initial bond offerings (IBOs) and secondary bond offerings (SBOs). Several aspects were considered as possible determinants of underpricing such as credit risk factors,
information asymmetries, liquidity problems and macroeconomic conditions. As the research progresses, extensions and developments of these considerations were conducted. It is very important for Banco Carregosa to understand the various aspects that affect bonds’ mispricing in order to better evaluate opportunities in the market and therefore, better advise their clients according with their investment time horizon (“flippers”1 versus long-term investors). Banco Carregosa Institutional department focus essentially on the Primary Market. With a wide network of banks and brokers, Banco Carregosa participates in fixed income securities issuances on a daily basis. Banco Carregosa serves as an intermediary between the syndicate and investors, earning a spread between the issue price and the price it sells to the client. Concerning the overall result, the analysis showed the existence of underprice both in the 1st day and 1st month, 27.93 bp and 53.00 bp, respectively. Considering only the US fixed income market, these results imply that companies have left 117.35 billion2 USD and 222.60 billion USD considering the two-time frames which, according to (INE 2018) correspond to 50.62% and 96.07% of the Portugal GDP in 2017. Additionally, it was found that for the 1st trading day, bond mispricing is mainly affected by credit risk factors (investment grade versus high yield and IBO against SBO) and macroeconomic conditions (derived by market credit risk) and partially influenced by liquidity aspects (characterized by bond’s maturity) and information asymmetries (derived by issuer’s total assets). With respect to longer-term periods, credit risk factors lose its significance. The main determinants affecting bond’s mispricing are liquidity aspects (resulted by bond’s maturity and size) and macroeconomic environment (characterized by market credit risk). Information asymmetries continue to have a considerable magnitude in the overall bond’s mispricing, even though supported by recent debt issues (book building process) and not by firm’s total assets. These results suggest that according to the time horizon, investors should pay more attention to certain factors than to others. The rest of this thesis is
organized as follows: Section II provides a description of previous literature and hypothesis considered; Section III presents the process of gathering the data and methodologies used; Section IV displays the empirical results; Section V provides the conclusions and findings.
II.
Literature Review
In this section, several hypotheses related to determinants for mispricing in bond issues are presented. For further support, each hypothesis is accompanied by theories mentioned in previous researches.
A. Underpricing
A number of former analyses have indicated the existence of underpricing in fixed income issues. One of the first studies regarding this subject was conducted by (Hickman 1958) where the author detected higher yields for new bond issues comparing to peer bonds already trading in the markets. (Conard and Frankena 1969) also identified discrepancies in bond yields suggesting security’s specific characteristics, underwriter’s interests and market imperfections as the main reasons for bonds’ mispricing. (Ederington 1974; Sorensen 1982) evaluated the positive yield differential between new and outstanding bonds suggesting that if the differential diminished at a rapid pace, underpricing was considered. (Hale and Santos 2006) suggested the difference tend to diminish, after the company’s entrance in the public bond market (book building effect). In addition, (Cai, Helwege, and Warga 2007) found underpricing both in IBO and SBO offers proposing information asymmetries as the main driver for bonds mispricing. There are several studies that try to determine which factors influence bond’s underpricing. However, for now, a broad hypothesis was considered.
Hypothesis: Bond offers are, on average, underpriced. B. Credit Risk
to stocks than investment grade bonds (IG), emphasizing the importance of risk as a determinant of market’s volatility. In (Shane 1994) research, the author found higher levels of correlation between high yield bonds and equity indexes relative to treasury bond indexes. The reasoning behind is that high yield securities have a greater risk inherent relative to investment grade bonds and therefore, as in equity, investors demand higher returns. Furthermore, (Fjelstad et al. 2005) stated that investors with low equity exposure can get similar returns through high-yield bonds. Due to greater similarities between high yield bonds and stocks, it is expected differences in the underpricing between speculative and non-speculative bonds. Therefore, it was conducted an analysis whether credit risk influences the level of underpricing.
Hypothesis: Bonds with high yield rating are more underpriced than investment grade.
Additionally, in (Datta, Iskandar-Datta, and Patel 1997; Helwege and Kleiman 1998) researches, the authors discovered levels of underpricing for speculative IBO while evidences of overpricing were found on investment grade bonds. (Cai, Helwege, and Warga 2007) included both IBO and SBO in their sample, reaching to higher levels of underpricing for IBO than for SBO bonds.
Hypothesis: IBO issues are more underpriced than SBO issues. C. Information Asymmetry
Many theories suggest underpricing as a consequence of information asymmetry.
(Ellul and Pagano 2006) identifies underpricing as a way for investors to defend themselves from information problems that arise after an IPO. Other studies suggest the amount of information is inferior for private companies and consequently, investors demand a greater underpricing. (Cai, Helwege, and Warga 2007) states that private companies are less known and do not have the same exposure to markets as public companies. Moreover, public companies are obliged to periodically update their financial condition to the public, contrary to private companies. The following hypothesis was formulated.
Hypothesis: Bond issues from private companies are more underpriced than issues from public companies.
Several researches also suggest the issuer’s size as a factor of information frictions. (Aboody and Lev 2002) claimed bigger firms tend to be more examined by the market, lowering the amount of information asymmetry. Contrary, (Aronsson and Tano 2016) admits that analysis focused on big firms are more complex and require more information and therefore, the probability of information asymmetry is higher. It was considered total assets (on the pricing date) as a proxy for the firm’s size. Hence, the following hypothesis was considered.
Hypothesis: Size of the company affect bond’s underpricing.
Another determinant of bond’s mispricing is related with the “signalling model” which explores the fact that due to information problems, investors face difficulties to differentiate good firms and bad firms (Welch 1989; Allen and Faulhaber 1989; Grinblatt and Hwang 1989). As a result, good companies will underprice their bond issues to signal the market about its financial strength; contrary, bad firms, do not find attractive to underprice their bonds as they do not have capacity to recoup the initial cost of signalling. (Chemmanur and Paeglis 2005) considers the company’s reputation as a factor that reduces information asymmetries and consequently, diminishes underpricing. Previous analysis goes in the same line of though; (Diamond 1989, 1991; Gorton 1996; Carty 1996) concluded that manager’s ability to create a good company’s debt payment reputation reduce information asymmetry. It was used issuer’s age as a proxy of reputation since older companies have passed through more crisis and therefore, have demonstrated more capacity and financial strength to overcome difficult moments.
Hypothesis: Firm’s reputation diminishes the level of bonds’ mispricing.
In an attempt to explain underpricing in IPOs, (Rock 1986) presents the winner’s curse theory suggesting that there are two groups in the markets, the informed investors, who have access to privileged information and the uniformed investors. As stated in (Cai, Helwege, and Warga
2007), the majority of investors in fixed income markets are at an institutional level. Although it is not possible to prove, it is reasonable to assume that institutional investors have access to more information than individual investors do. If bonds were issued at fair value, institutional investors would only participate in the good issues leaving the bad ones to individual investors. Therefore, underpricing is necessary to compensate uniformed investors, retain them in the markets and prevent liquidity problems. The authors analysed this hypothesis by differentiating bonds that are traded in the NYSE and OTC (as bonds listed in public markets should be more underpriced in order to attract more investors); nonetheless, little evidences regarding these issues were found. Moreover, as Banco Carregosa only participates in bond issues that are tradable in the secondary market, no further analyses were conducted regarding this hypothesis.
D. Book Building (Information Asymmetry)
Various researches pointed to the relation between the process of book building and underpricing. Book building, which started to arise curiosity in the academic literature after analysis conducted by (Benveniste and Spindt 1989; Benveniste and Wilhelm 1990), is the process by which an underwriter attempts to find the price range and the number of shares that institutional investors are willing to pay in a security public offering. (Leite 2006) suggests that accurate analyses are a way to reduce asymmetric information; nevertheless, those analysis are costly and therefore, underprice occurs to surpass those constraints. (Cai, Helwege, and Warga 2007) proposes bond issues from firms with recent past bond offers are less underpriced since asymmetric information was partially reduced from the previous issues.
Hypothesis: Recent past bond offers decreases the level of underpricing.
Moreover, previous analysis performed by (Sherman and Titman 2000; Benveniste, Busaba, and Wilhelm 2002) found evidences that recent equity issues impact negatively bond offers. According to the pecking order theory, introduced by (Myers and Majluf 1984; Shyam-Sunder and C. Myers 1999) companies tend to prefer to raise funds through debt rather than equity,
and therefore, investors perceive equity issues as a signal that the company was not able to acquire capital through debt, demonstrating financial weaknesses. Moreover, (Smith 1986) stated that managers are only willing to sell new equity at an overpriced value.
Hypothesis: Recent public firms underprice more their bond offers than non-recent public ones.
E. Liquidity
Previous analysis proposed liquidity as an element affecting bonds’ underpricing. (Booth and Chua 1996) stated that higher levels of underpricing in equity leads to higher transaction volumes, bringing more liquidity to the market. (Ellul and Pagano 2006) defended that equity underpricing exits as a tool to overcome investors’ fears of aftermarket illiquidity. (Bailey and Jagtiani 1994; Berkman and Eleswarapu 1998) suggested trading volume as a measure for liquidity. (Cai, Helwege, and Warga 2007) tried to analyze this topic using bond’s offering size. Moreover, (McCauley and Remolona 2000) also used size as a measure of liquidity, reaching to a conclusion that size does matter as a determinant of liquidity. The reasoning behind is the fact that the larger the amount outstanding is, the more participants are needed or the more money per investor is required. In this thesis, trading volume was not possible to extract and therefore, it was assigned bond’s size as a measure of liquidity.
Hypothesis: Bond issues with higher offering sizes are more underpriced.
Other studies suggested bond’s length as a factor that influence liquidity and therefore, bond’s underpricing. (Sarig and Warga 1989; Aronsson and Tano 2016) concluded that liquidity decreases as maturity increases. Hence, the following hypothesis was considered.
Hypothesis: Long term bond issues are more underpriced than shorter ones. F. Macroeconomic Factor - Market Credit Risk
Past literature has acknowledged that the level of underpricing is not constant overtime. Moreover, all the determinants mentioned above fail to explain those variations, suggesting
macroeconomic conditions as a potential explanation. In (Loughran and Ritter 2002) study, the authors found significant variations on the first trading day average returns between 1980 and 2000; the average returns in 1980 was 7% in contrast to 15% in 1990. 1990 was the period before the tech bubble burst, suggesting market context do impact bonds’ underpricing. Several researches have defended that bonds’ mispricing varies according to whether the issue occurred in a hot or cold market. (Ibbotson and Jaffe 1975; Ritter 1984; Lerner 1994) characterized hot stock markets as periods where a high number of companies go public and offers are highly oversubscribed; as the number of risky IPOs increases, issues are more underprice. Contrary, (Allen and Faulhaber 1989; Grinblatt and Hwang 1989; Welch 1989) suggest that in hot issue markets, a high number of good firms go public: as trading volume in initial offers is higher, companies are able to less underprice their securities. A way to include a macroeconomic variable into the analysis would be the adoption of a similar approach that (Helwege and Liang 1996) used. The authors defined hot or cold issue markets as the total number of issues that occurred in a particular time interval. However, as this thesis do not encompass all bond offers occurred during 2014 and 2018 (as it only embraces the ones Banco Carregosa participated), no further considerations were made regarding this approach. An alternative way to consider a macroeconomic variable in the model would be the incorporation of a CDS index (Aronsson and Tano 2016). It is plausible to consider a CDS index as good measure to quantify the overall credit risk perceived by the market as in periods where credit risk fears grow, investors tend to allocate more money in CDSs to protect themselves from possible price’s downfalls. (Byström 2008) found positive correlation between the Itraxx CDS European indexes spreads and stock’s volatility. The reasoning behind this is that greater volatility implies increases on the perception of default risk and therefore CDS index value rise. Additionally, previous studies from (Hull, Predescu, and White 2004; Norden and Weber 2004) proved that CDSs have a good predictive power regarding credit rating. As CDSs are effective instruments to address the credit risk
investors perceived for specific bonds, it is reasonable to assume a broad index that encompasses several CDSs tradable in the market is suitable to quantify the overall credit risk. Hypothesis: Market credit risk affects the level of bonds’ underpricing.
III.
Methodology
This section outlines the methodologies adopted to analyse the various hypothesis, the procedures used to collect the dataset and relevant aspects that emerged during its treatment.
A. Hypothesis Testing Techniques
With a view to analysing the various hypotheses this thesis explore, two different analyses were conducted. First, for both the 1st trading day and the 1st trading month, individual univariate analyses were carried out for the majority of the factors where “Student's T” and “ANOVA single factor” tests were performed. To assess and quantify bond’s mispricing, the average excess returns were considered. Accordingly, positive excess returns are indicative of bond’s underpricing and negative excess returns are indicative of bond’s overpricing. Next, multivariate analyses were conducted via OLS regressions. First, individual regressions were conducted in order to analyse the isolated effect that each variable had in the bonds’ mispricing. Therefore, all variables were clustered in a single OLS regression with the purpose of analysing the influence that each factor had in the overall level of bond’s mispricing by considering the collective impact that other variables had in the model. Due to heteroscedasticity problems, STATA program was used to calculate robust standard errors. As concerns the structure, firstly, it was performed all univariate analyses regarding the 1st day and the 1st month. Then, for the same time intervals, multivariate analyses were carried out. It was given more importance to the results from multivariate analyses since it takes in consideration the effect of all variables in the dependent variable (level of underpricing).
B. Collection of Data Set
The source used to gather the data was Bloomberg Terminal. It encompasses fixed income issues that Banco Carregosa participated between October 2014 and June 2018. The issues are denominated in EUR, USD, AUD or GBP, with a minimum issue size of 130 million euros. The sample comprises firms from the public and private sector and are segmented in 8 categories (Appendix 1). In order to conduct the analysis, it was extracted the last price for the two time frames this analysis explores, 1st trading day and 1st trading month. The last price represents the one at which the last trade of the day occurred in the secondary market. Since the majority of Bloomberg sources regarding historical prices display data only from the third trading session (on average) potential caused by lack of volume transactions and consequently lack of intermediary entities quotation (Cai, Helwege, and Warga 2007) or by liquidity problems as a consequence of bond’s custody maintenance in syndication (Fung and Rudd 1986), prices from 37 sources were extracted. Note that, the first trading day is very important to incorporate in the analysis (although leading to a substantial decrease of observations in the sample) as Banco Carregosa has several short-term investors, also called flippers, who immediately sell their positions upon the security starts to trade in the secondary market. Additional elements were also collected via Bloomberg or added manually such as Credit Rating, Pricing Date, among others (for more information about the process of gathering the data, check Appendix 2). A sample of 937 observations was collected.
C. Calculation of Underpricing
This paper used “holding periods” returns rather than yields to analyse bonds’ mispricing. Prices were extracted from 37 sources via Bloomberg. BVAL, BGN and TRAC were the three primary sources adopted since they provide more preciseness (for more information, check Appendix 3). Exchange rates were extracted to convert all non-USD securities in USD. As returns were calculated using the normal rather the logarithmic approach, prices for the two
time intervals were calculated by diving the last price of that day with the issue price minus 1 (for more information, check Appendix 4). To evaluate the existence of underpricing, it was necessary to take into account possible movements from the market. In this way, excess returns were calculated by incorporating a benchmark according to the security’s credit risk (Cai, Helwege, and Warga 2007). For HY bonds, “Bloomberg Barclays Global High-Yield (USD Unhedged)” was chosen; for bonds with IG rating, “Bloomberg Barclays Global Aggregate (USD Unhedged)” was preferred (for more information, check Appendix 5).
D. CDS Index
A way to quantify the credit risk level perceived in the market, a credit default swap (CDS) index was incorporated in the model. CDSs are derivatives instruments used to guarantee the full payment in case the debt issuer defaults. The buyer of the swap makes periodical payments to the swap’s seller until the termination of the contract or until the event of a payment default by the underlying company; in the last case, the buyer receives the difference between the bond’s par value and the bond’s value after the default (Blanco, Brennan, and Marsh 2005). It is reasonable to assume that a CDS index is a good proxy to measure market credit quality since upper movements in CDSs (positive returns in the index) signals investors’ perception of a deterioration in the credit quality and lower movements indicates a reduction of credit risk sentiment (CFA Institute. 2013). As, to my knowledge, there is not an index that tracks CDS derivatives in a global basis, two indexes were extracted via Bloomberg Terminal, within the time interval this paper examines: “Markit iTraxx Europe 5Y Corp” index (IHS Markit 2018) and “Markit North American Investment Grade CDX 5Y Corp” index (IHS Markit 2016). A new CDS index was created (named “EU/US IG CDS”), where the percentage that each index received was inversely proportional to its quote (for a complete understanding about the reasoning employed in the construction of the CDS index, check Appendix 6). In order to analyse the influence of the overall credit risk perceived by the market, two analyses were
conducted. The first analysis was proposed by (Aronsson and Tano 2016), where the authors allocated the securities in “High” and “Low” categories according to whether the CDS level was above or below the 80th and 20th percentile (81.50 USD and 59.11 USD , respectively) of the CDS index sample levels (for a better understanding, check Appendix 7). In the second analysis, it was considered the level of the CDS index as a variable in order to analyse its impact and statistical robustness in both individual and overall OLS regressions.
E. Sample Summary
A summary of the parameters this analysis encompasses is displayed in the following table.
Table 1 – Sample Description
Investment grade encompasses bonds rated between AAA and BBB- (S&P terminology). High yield englobes bonds rated BB+ or below (S&P terminology). Long term category embraces bonds with maturity higher than 10 years. Short/intermediate englobes bonds with maturity lower or equal than 10 years. High and Low categories comprise bonds with a CDS level above and below the 80th and 20th percentile, respectively.
# %
Type
Initial Bond Offer 98 10.459%
Seasoned Bond Offer 839 89.541%
Credit Risk Investment Grade 819 87.407% High Yield 118 12.593% Placement Public 756 80.683% Private 181 19.317% Term to Maturity Long term 420 44.824% Short/Intermediate Term 517 55.176% Currency AUD 14 1.494% EUR 479 51.121% GBP 34 3.629% USD 410 43.757% Term to Maturity Perpetual 43 4.589% Non-Perpetual 894 95.411% CDS Index Level High 188 20.064% Normal 560 59.765% Low 189 20.171% Average Median
Term to Maturity (Years) 10.708 5.197
Bond Size (USD) 1121328818 800000000
Total Assets (USD) 295206133997 59340736400
Regarding the credit risk, 819 (87%) are IG securities versus 118 (13%) HY. Only 98 observations (10.5%) are characterized as IBO against 839 (89.5%) SBO; a reason that partially explains this difference is the fact that from a sample of 937 bonds, only 498 companies have issued them, leading to an average of 1.9 issues per company (for more information, check Appendix 8). Considering the universe of SBO (839), 567 (67.58%) are bonds issued by companies that had previously issued other debt securities less than one year relative to the pricing date. Regarding the Bond Size, the average and median of all issues are respectively 1.12 billion and 800 million USD. Additionally, discarding perpetual bonds, which account 43 issues (4.6%), the Term to Maturity average and median are 10 and 8 years respectively. In order to analyze this category, the issues were split in two groups: “Long Term” category which encompasses bonds with maturity greater than 10 years (420 issues, representing 44.8% of the sample) and “Short to Intermediate Term” which account bonds with a lifetime lower or equal than 10 years, representing 517 bonds of the sample (55.2%). More than half of the securities, 479 (51.1%), are denominated in EUR, following 410 (43.8%) in USD, 34 (3.6%) in GPB and 14 (1.5%) in AUD. Regarding firm’s specific aspects, 756 observations (80.7%) are issues from public companies, relative to only 181 (19.3%) issues completed from private companies. From a universe of 937 observations, only 10 bonds (1.4%) were issued by companies that turned public less than 1 year from the pricing date. Total Assets average is equal to 295.21 billion USD and the median is equal to 59.34 billion USD (for a detailed explanation regarding Total Assets values, check Appendix 9). With respect to the issuer’s age, the average and median were 37.5 and 25 years, respectively. As concerns to market credit risk, “High” category accounted 187 bonds (19.96%) and “Low” category accounted 188 bonds (2.06%).
IV.
Presentation of Results and Discussion
This section presents the various analyses carried out in this study. Firstly, univariate analyses were conducted in order to examine evidences of underpricing in the sample throughout various
factors. Thereafter, multivariate analyses were conducted through OLS regressions. In these regressions, it was considered the logarithmic form of total assets and bond size variables with a view to reduce the sensitiveness of outliers. In order to test the existence of Heteroscedasticity, Breusch Pagan and Abridged White's Tests were conducted (Gujarati and Porter 2009). As all the tests indicated heteroscedasticity at a 90% confidence level, white heteroscedasticity consistent standard errors were considered (Appendix 10). The existence of multicollinearity was also taken in consideration; however, through the examination of explanatory variables correlation matrix, it was discarded (Appendix 11). As in multivariate analysis the overall regression OLS model encompasses various variables, adjusted R-squared instead R-squared was considered in order to measure the goodness-of-fit. Therefore, for comparisons purposes, it was also considered the adjusted R squared for the individual regressions conducted on all factors.
A. Univariate Analysis - 1st Trading Day
Below is displayed a summary of the various univariate analyses regarding the 1st day.
Table 2 – 1st Day Univariate Analyses Description
Investment grade encompasses bonds rated between AAA and BBB- (S&P terminology). High yield englobes bonds rated BB+ or below (S&P terminology). Recent debt issue analysis comprises only SBOs. Long term category embraces bonds with maturity higher than 10 years. Short/intermediate englobes bonds with maturity lower or equal than 10 years. Recent IPO analysis comprises only public firms. High and Low categories comprise bonds with a CDS level above and below the 80th and 20th percentile, respectively.
Average t-statistic p-value F-stat. F-critical
General Analysis 0.28% 11.35 0.0000 Credit Risk Investment Grade 0.25% 11.25 0.0000 3.85 High Yield 0.51% 4.22 0.0000 IG vs HY 0.0003 13.27 Type
Initial Bond Offer 0.54% 3.72 0.0003
Seasoned Bond Offer 0.25% 11.58 0.0000
IBO vs SBO 0.0003 13.04 3.85
Recent Debt Issue
Yes 0.22% 7.86 0.0000 No 0.30% 10.17 0.0000 Yes vs No 0.0821 3.03 3.85 Placement Public 0.29% 10.09 0.0000 Private 0.22% 5.84 0.0000 Public vs Private 0.2235 1.48 3.85 Recent IPO Yes 0.34% 1.26 0.2401 No 0.28% 10.33 0.0000 Yes vs No 0.7732 0.08 3.85 Term to Maturity Long Term 0.37% 8.52 0.0000 Short/Intermediate Term 0.19% 8.36 0.0000
Long Term vs S/I Term 0.0002 14.42 3.85
CDS Index Level
High 0.35% 5.25 0.0000
Low 0.24% 6.71 0.0000
High vs Low 0.1313 2.29 3.87
Analysing the overall sample, it was found that bond issues were, on average, underpriced by 27.93 bp. Moreover, the analysis exhibited high levels of skewness and kurtosis in the sample, 8.63 and 130.14 respectively, indicating the occasional occurrence of extreme underprice events and therefore, opportunities for investors (Appendix 12). With t-test significant at 1%
average underpriced. Next, the sample was divided in two categories, according to the security’s credit risk. With a confidence level of 1%, the results led to an average excess return of 24.55 bp for investment grade bonds (IG) and 51.39 bp for high yield bonds (HY). Additionally, F-test was computed (13.27) and thus, at a significance level of 1%, HY fixed income securities showed, on average, higher levels of underprice than IG bonds; therefore, the second hypothesis was verified: credit risk increases bond’s underpricing. Next, it was examined whether security’s issuer being public or private influence the level of bond’s mispricing. Contrary to what was expected, with a confidence level of 1%, public companies showed an average abnormal return of 29.40 bp relative to only 21.81 bp for private firms. However, this difference is not statistical robust at any acceptable significant level as ANOVA p-value is equal to 0.223. Therefore, it was not found support to the hypothesis that states bond issues from private companies are more underpriced than issues from public companies. A possible reason for this may result due to the shortage number of issues from private companies relative to issues from public ones, 181 (19.32%) versus 756 (80.68%). Considering only public companies, it was analysed the influence of a recent IPO (less or equal than 1 year relative to the bond’s issue pricing date) in the level of bond’s mispricing. As expected, recent public companies displayed higher levels of underpricing comparing with non-recent public companies. Issues from non- recent public companies showed an average excess return of 27.61 bp relative to 34.23 bp from recent public companies, although the last value was not statistically robust. Moreover, with a ANOVA p-value equal to 0.773, there is not empirical support for the hypothesis that issues from recent public companies are more underpriced than non-recent public companies. From the descriptive analysis, only 10 issues (1.4%) are from recent public firms and thus, the low number of observation makes statistically impossible to prove the hypothesis with a reasonable degree of certainty. Following the analysis, the sample was divided in two categories according to whether the security was the company’s first debt
issue or not (IBO versus SBO). Student-T test at 1% significance level indicated that, on average, IBO and SBO were 53.75 bp are 24.91 bp underpriced. With empirical support at 99% confidence level (F-test equal to 13.04), it was found support to the hypothesis that on average, IBO are more underpriced than SBO. To better explain this underpricing difference it was divided IBO and SBO observations into sub categories according the credit risk; the results and comments are displayed on Appendix 13. With a 10% confidence level (ANOVA p-value equal to 0.082), it was verified that previous recent debt issues decrease the level of underpricing: average excess returns (at 1% confidence level) for recent debt issues were 22.32 bp comparing with 30.31 bp for non-recent debt issues. Thus, it was found support to the hypothesis recent past bond offers decreases the level of underpricing. With respect to Maturity, at a 99% confidence level (ANOVA F-test equal to 14.42), it was found that long term issues had average abnormal returns of 37.32 bp, 18.56 bp higher than short/intermediate issues (18.76 bp). Therefore, evidences point to the hypothesis stating that long term bonds tend to be more underpriced than short bonds. Further, it was divided the sample in “High” and “Low” categories according to the CDS index level at the security’s pricing date. Periods with high CDS levels displayed average abnormal returns of 35.03 bp and periods with low CDS levels showed an average abnormal return of 23.63 bp, both with 1% significance level. However, the difference was not statistically robust since ANOVA F-tes p-value was 0.131. Despite some evidences, only with the univariate analysis, it was not possible to empirically validate the hypothesis suggesting that periods with high CDS levels are more underpricing than low CDS levels. To better understand these results, “High” and “Low” categories were divided according to bond’s credit risk. For a detail explanation, check Appendix 14.
B. Univariate1Analysis - 1st Trading Month
Below is displayed a summary of the univariate analyses regarding the 1st month.
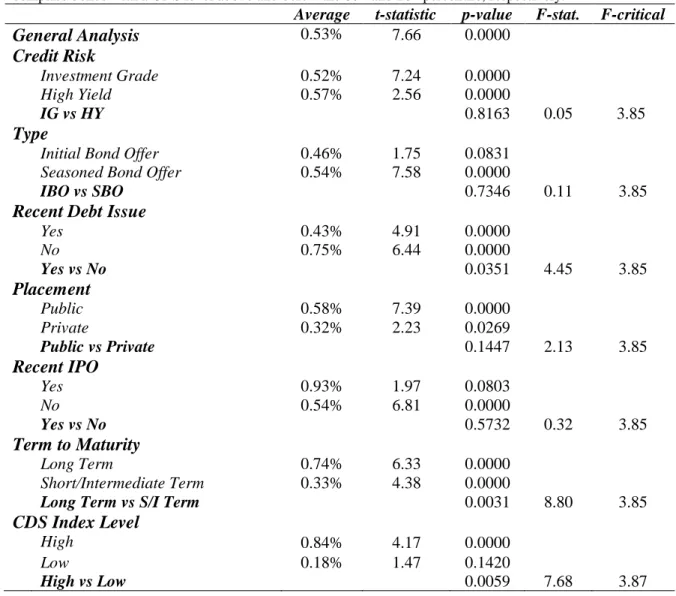
Table 3 – 1st Month Univariate Analyses Description
Investment grade encompasses bonds rated between AAA and BBB- (S&P terminology). High yield englobes bonds rated BB+ or below (S&P terminology). Recent debt issue analysis comprises only SBOs. Long term category embraces bonds with maturity higher than 10 years. Short/intermediate englobes bonds with maturity lower or equal than 10 years. Recent IPO analysis comprises only public firms. High and Low categories comprise bonds with a CDS level above and below the 80th and 20th percentile, respectively.
Average t-statistic p-value F-stat. F-critical
General Analysis 0.53% 7.66 0.0000 Credit Risk Investment Grade 0.52% 7.24 0.0000 3.85 High Yield 0.57% 2.56 0.0000 IG vs HY 0.8163 0.05 Type
Initial Bond Offer 0.46% 1.75 0.0831
Seasoned Bond Offer 0.54% 7.58 0.0000
IBO vs SBO 0.7346 0.11 3.85
Recent Debt Issue
Yes 0.43% 4.91 0.0000 No 0.75% 6.44 0.0000 Yes vs No 0.0351 4.45 3.85 Placement Public 0.58% 7.39 0.0000 Private 0.32% 2.23 0.0269 Public vs Private 0.1447 2.13 3.85 Recent IPO Yes 0.93% 1.97 0.0803 No 0.54% 6.81 0.0000 Yes vs No 0.5732 0.32 3.85 Term to Maturity Long Term 0.74% 6.33 0.0000 Short/Intermediate Term 0.33% 4.38 0.0000
Long Term vs S/I Term 0.0031 8.80 3.85
CDS Index Level
High 0.84% 4.17 0.0000
Low 0.18% 1.47 0.1420
High vs Low 0.0059 7.68 3.87
With respect to the overall sample, for the 1st trading month, univariate analyses exhibited, at a 99% confidence level, an average abnormal return equal to 53.00 bp and therefore, the existence of underpricing. Comparing the same value for the 1st trading day (27.93 bp), the average abnormal return for the 1st month almost doubled. However, kurtosis and skewness decreased substantially; skewness turned negative (-0.26) and kurtosis decreased nearly 16 times (8.23),
suggesting investors sporadically experience extreme negative abnormal returns. Considering the riskiness of the securities, both IG and HY bonds revealed higher average excess returns than the 1st day: average abnormal returns for IG and HY were 52.39 bp and 57.24 bp respectively. These values exhibited robustness at 1% confidence level. To validate the hypothesis that higher credit risk increases bond’s underpricing in the 1st trading month, ANOVA F-test was computed. At 10% confidence level, empirical support for the hypothesis was found, as a p-value equal to 0.054 was obtained. With respect to issuer placement (public/private), similar conclusions as the 1st day analysis were achieved. At 5% confidence level, average abnormal return for private issuers was 32.36 bp and for public issuers was 57.94 bp. Statistical robustness for this difference continued not to be achieved as ANOVA F-test displayed a value equal to 2.13 (p-value equal to 0.145). Regarding issuers that passed through a recent IPO, identical results were found between the two time frames. Recent IPO bonds displayed an average abnormal return equal to 92.94 bp as opposed to 54.45 bp for non-recent IPO; however, the first value (recent IPO bonds) was only statistically robust at a 10% confidence level (non-recent IPO was robust at 1%). Recent IPO average excess returns revealed almost 3 times bigger in the 1st month than in the 1st day and non-recent IPO showed almost the double abnormal average return in the 1st month relative to 1st day. Regarding only the 1st month, the difference between recent IPO and non-recent IPO bonds continued not to be robust, as ANOVA p-value was 0.644. Dividing the sample into IBO and SBO, interesting results were obtained. After 1 month from the issue, IBO was no longer exhibiting higher average abnormal returns than SBO. Average abnormal returns for IBO and SBO were 46.13 bp and 53.80 bp, at a 10% and 1% significance level, respectively. Yet, this difference did not reveal to be statistically robust, as ANOVA F-test p-value was 0.735. Further, it was divided IBO and SBO in credit risk sub-categories; commentaries about the results are displayed in Appendix 15. Regarding recent debt issue, similar results were found comparing with the 1st
day. Non-recent debt issues showed higher levels of underpricing relative to recent debt issues, with a 5% confidence level (ANOVA F-test p-value equal to 0.035): average excess returns for non-recent debt and recent debt issues were 75.38 bp and 43.45 bp, respectively, both at a 1% confidence level. Next, the sample was divided according to its maturity. Both short/intermediate-term and long-term bonds displayed higher excess returns comparing with the same values from the 1st day: at 1% significance level, short/intermediate-term bonds exhibited average abnormal returns equal to 32.79 bp, 14.03 bp higher than the 1st day; average abnormal returns for long-term bonds was 73.69 bp, 36.37 bp higher than the 1st day. Moreover, ANOVA F-test was conducted to validate the hypothesis that long term bonds are more underpriced than shorter bonds. With p-value equal to 0.003, it was find statistical robustness to validate that difference. With respect to market credit risk, similar to the results obtained in the 1st day, at 1% significance level, “High” category showed average abnormal returns 65.41 bp bigger than the “Low” category, being this difference significant at a 1% level (ANOVA F-test equal to 7.68). The average excess return for the “High” and “Low” category was 83.74 bp and 18.33 bp, respectively. “High” and “Low” categories were further divided according to the bond’s credit risk; comments about the results are exhibited in Appendix 16. With the results obtained, evidences were found to support the hypothesis that increases in market credit risk increases the level of bond’s mispricing.
C. Multivariate Analysis - 1st Trading Day
Below is displayed a summary of the multivariate analyses conducted for the 1st day.
Table 4 – 1st Day Multivariate Analyses Description
The significance level is indicated by ***, **, * which corresponds to 1%, 5% and 10% respectively. Credit risk is equal to 1 if the bond is rated with investment grade. Public is equal to 1 if the issuer is a public firm. Recent IPO takes the value 1 if the issuer has turned public until one year from the bond’s issue date. SBO is equal to 1 if the bond is a “seasoned” issue. Recent debt issue takes the value 1 if the issuer has issued additional bonds until one year from the bond’s issue date. Long-term is equal to 1 if bond’s maturity is higher than 10 years. Ln-TA and Ln-BS represents the logarithmic form of total assets and bond size. CDS is the CDS index level at the bond’s issue date.
Regression 1 2 3 4 5 6 7 8 9 10 11 12 13 14 Intercept .0051*** .0022*** .0028*** .0054*** .0037*** .0019*** .0098*** .0012 0.0030*** .0004 -.0067 -.0064 -.0059 -.0029 4.24 5.85 11.27 3.74 8.25 8.36 3.94 0.11 7.65 0.32 -0.63 -0.61 -0.54 -0.26 Invest. Grade -.0027** - - - -.0022** -.0028** -.0022** -.0022** -2.18 -2.33 -2.23 -2.38 -2.27 Public - .0008 - - - .0010 .0007 .0010* .0010* 1.60 1.64 1.41 1.67 1.67 Rec. IPO - - .0006 - - - -.0002 -.0003 -.0001 -.0001 0.25 -0.09 -0.11 -0.06 -0.05 SBO - - - -.0029** - - - -.0022 - -.0024* -.0024* -1.98 -1.61 -1.80 -1.90
Rec. Debt Iss. - - - - -.0014*** - - - -.0003 -.0007* - -
-2.7 -0.79 -1.75
Long-Term - - - .0019*** - - - - .0020*** .0020*** .0020*** .0020***
3.77 3.85 3.90 3.96 3.42
Ln-TA - - - -.0003*** - - - -.0002* -.0002** -.0002** -.0002**
-2.93 -1.88 -2.17 -2.13 -2.12
Ln-BS - - - 7.8E-5 - - 6.9E-4 6.6E-4 6.7E-04 .0006
0.15 1.23 1.19 1.18 1.12
Comp. Age - - - -6.5E-6 - -1.9E-6 -2.3E-6 -2.1E-06 -2.2E-6
-1.20 -0.36 -0.45 -0.42 -0.42
CDS - - - 3.4E-5* 3.8E-5** 3.9E-5** 3.8E-05** -1.6E-7
1.90 2.36 2.41 2.39 -0.01
Time Fix. Eff. - - - - - - - Yes
# 937 937 937 937 937 937 937 937 937 937 937 937 937 937
As adjusted R squared in regression 13 (0.0432) was higher than regression 11 (0.0425), it was given more importance to the overall regression model that did not encompass the recent debt issue variable (regression 13). Further in the analysis it is explained the reasoning behind this procedure. As expected, regression 1 indicated a negative coefficient for IG bonds, at a 5% significance level. In addition, both regressions 11 and 13 showed that this variable continued to be statistical significant (5%) with a negative impact in the overall regression model. These results go in the same line as the univariate analysis, indicating that in the 1st trading day, the level of underpricing increases with bond’s credit risk. Similar to the results obtained in the univariate analysis, both regressions 2 and 11 showed that public companies influenced positively the level of underpricing, though the value did not reveal empirical robustness (p-value equal to 0.109). Yet, regression 12 exhibited statistical significance to the public variable, at a 90% significance level. These results contradict past literature that affirm greater underprice for private companies prompted by information asymmetries. In (Aronsson and Tano 2016) analysis, the authors also found higher levels of underpricing for public than for private companies suggesting “Government Ownership” as a possible cause. The reasoning behind is that government ownership decreases market risk perception and therefore, companies with a government as shareholder are not required to underprice as much their securities as other companies leading to a misrepresentation in the sample. It was attempted to incorporate “Government Ownership” variable in the model, although it was not possible due to the limited information available on private companies, which encompasses 19.32% (181 issues) of the sample. Due to several inconsistencies in the results, it was not confirmed the hypothesis proposing higher levels of underpricing for private companies. Regarding regression 3, the model indicated that recent IPOs positively impact bond’s mispricing, however no empirical robustness was found. These results are congruent with the ones obtained in the univariate analysis. In the overall regression models (regression 11 and 13), the coefficient turned
negative, however the value continued to be statistical insignificance. A possible reason for these inconsistencies is believed to result from the shortage of observations: only 10 bonds encompass this category. As a result, the hypothesis suggesting a great underprice on issues from recent public companies was not validated. As regards regressions 4 and 5, both SBO and recent debt issues revealed statistical robustness with a 5% and 1% significance level, respectively. Regression 4 revealed that SBO issues have a negative impact in the level of underpricing. These results go along with the conclusions previously obtained, since univariate analysis revealed higher levels of underprice for IBO bonds than SBO. Regression 5 showed that recent previous debt issues impact negatively the level of underpricing, reinforcing the results obtained in the univariate analysis. Nonetheless, contrary to what it was expected, both variables lose its significance when included with the other variables (regression 11). In order to analyse the loss of statistical robustness, regressions 12 and 13 were conducted. Through regression 12, it is possible to observe that without SBO, recent debt issues variable remains statistical robust when included in the overall regression model (90% confidence level). Moreover, regression 13 shows that without recent debt issues, SBO continues to be statistical robust when incorporated with the other variables. These results suggest that recent debt issues partially replicate the effect SBO variable brings to regression. Both SBO and recent debt issue are dummy variables that take the value 1 when the bond is SBO and the underlying company has recently issued bonds, respectively. SBO category considers all previous fixed income issues and therefore, it also embraces the ones that occurred over the course of the last year (relative to the issue date of each security), which is the subject recent debt issue variable describes. Therefore, both recent debt issue and SBO variables loses their significance when included in the overall model (regression 11) as the effect of recent debt issue is partially explained by SBO variable. As adjusted R squared in regression 13 was higher than in regression 11 and 12 (0.0432 versus 0.0425 and 0.0382), the overall OLS regression model
considered was the one without the recent debt issues variable. Therefore, the effect of recent debt issues was discarded in the analysis and the hypothesis suggesting that, IBO are on average more underpriced than SBO was preserved. With a significance level of 1%, regression 6 displayed a positive coefficient suggesting that long term securities show more levels of underpriced relative to short/intermediate bonds. Moreover, regression 11 and 13 displayed a similar outcome, which is congruent to the ones obtained in the univariate analysis. Therefore, it was found evidences to validate the hypothesis that long-term bonds are more underpriced than short-term bonds. With respect to regression 7, the model revealed that higher levels of issuer’s Total Assets decrease the level of underpricing, showing statistical robustness at 1% significance level. Although in regression 11 and 13 the confidence level decreased from 99% to 90% and 95%, respectively, total assets continued to reveal a negative coefficient in the overall model and therefore, these results follow previous studies that claim a negative relation between information asymmetries and company size. Following the analysis, regression 8 indicates that increases in bond’s bond size leads to higher levels of underpricing, however the results do not show empirical robustness. Regression 11 and 13 showed identical results and thus, evidences to validate previous analyses that have indicated greater levels of underpricing as a consequence of liquidity risks were not found. Regression 9 showed that bond’s underpricing diminishes as issuer’s age increases, however it did not reveal statistical robustness. Moreover, regression 11 and 13 displayed similar results suggesting that there may be better proxies to characterize the reputation of a company in fixed income markets. Additionally, regression 10 displayed a positive coefficient, with a significance level of 10%, indicating that, ceteris paribus, higher levels in the CDS index increases the level of bond’s mispricing. Regression 11 and 13 showed an identical outcome, yet statistical robustness increased from 90% to 95% confidence level. These results are in line to the ones obtained in the univariate analysis and therefore, to the hypothesis suggesting that investors require a
greater underprice as a result of deteriorations of macroeconomic market conditions (and vice-versa). A further analysis was performed, where a “time fixed effect” was incorporated in the model (regression14). All variables except CDS index remained robust; a commentary of the outcome and an explanation regarding the loss of significance of the CDS index variable is exhibited in Appendix 17-Table 1. Adjusted R squared was higher in regression 13, indicating that the inclusion of all variables with the exception of recent debt issue leads to a greater explanation of bonds’ mispricing.
D. Multivariate1Analysis - 1st Trading Month
Below is displayed a summary regarding the multivariate analyses conducted in the 1st month.
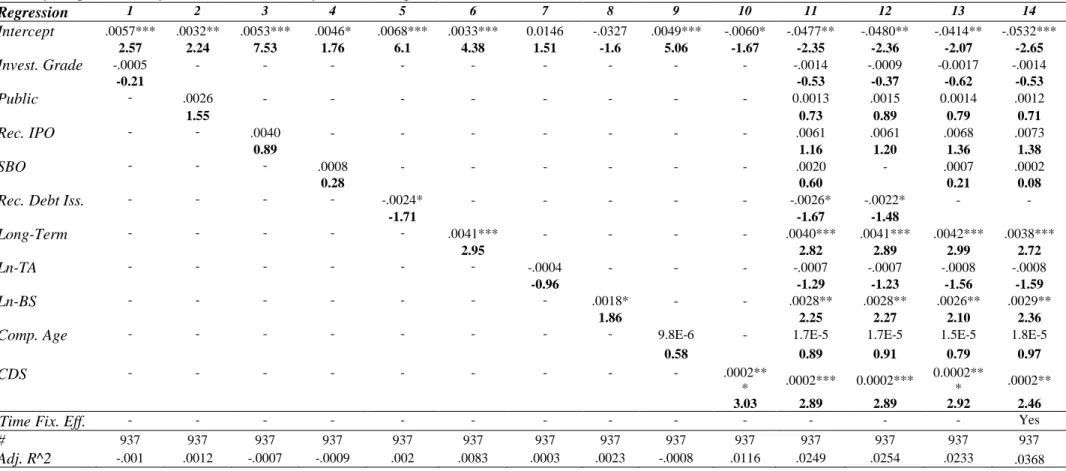
Table 5 – 1st Month Multivariate Analyses Description
The significance level is indicated by ***, **, * which corresponds to 1%, 5% and 10% respectively. Credit risk is equal to 1 if the bond is rated with investment grade. Public is equal to 1 if the issuer is a public firm. Recent IPO takes the value 1 if the issuer has turned public until one year from the bond’s issue date. SBO is equal to 1 if the bond is a “seasoned” issue. Recent debt issue takes the value 1 if the issuer has issued additional bonds until one year from the bond’s issue date. Long-term is equal to 1 if bond’s maturity is higher than 10 years. Ln-TA and Ln-BS represents the logarithmic form of total assets and bond size. CDS is the CDS index level at the bond’s issue date.
Regression 1 2 3 4 5 6 7 8 9 10 11 12 13 14 Intercept .0057*** .0032** .0053*** .0046* .0068*** .0033*** 0.0146 -.0327 .0049*** -.0060* -.0477** -.0480** -.0414** -.0532*** 2.57 2.24 7.53 1.76 6.1 4.38 1.51 -1.6 5.06 -1.67 -2.35 -2.36 -2.07 -2.65 Invest. Grade -.0005 - - - -.0014 -.0009 -0.0017 -.0014 -0.21 -0.53 -0.37 -0.62 -0.53 Public - .0026 - - - 0.0013 .0015 0.0014 .0012 1.55 0.73 0.89 0.79 0.71 Rec. IPO - - .0040 - - - .0061 .0061 .0068 .0073 0.89 1.16 1.20 1.36 1.38 SBO - - - .0008 - - - .0020 - .0007 .0002 0.28 0.60 0.21 0.08
Rec. Debt Iss. - - - - -.0024* - - - -.0026* -.0022* - -
-1.71 -1.67 -1.48 Long-Term - - - .0041*** - - - - .0040*** .0041*** .0042*** .0038*** 2.95 2.82 2.89 2.99 2.72 Ln-TA - - - -.0004 - - - -.0007 -.0007 -.0008 -.0008 -0.96 -1.29 -1.23 -1.56 -1.59 Ln-BS - - - .0018* - - .0028** .0028** .0026** .0029** 1.86 2.25 2.27 2.10 2.36
Comp. Age - - - 9.8E-6 - 1.7E-5 1.7E-5 1.5E-5 1.8E-5
0.58 0.89 0.91 0.79 0.97 CDS - - - .0002** * .0002*** 0.0002*** 0.0002** * .0002** 3.03 2.89 2.89 2.92 2.46
Time Fix. Eff. - - - - - - - Yes
# 937 937 937 937 937 937 937 937 937 937 937 937 937 937
Contrary to the 1st day multivariate analysis and without considering the “time fixed effect”, the model with higher adjusted R squared was regression 12 (0.0254 versus 0.0249 from regression 11). Therefore, it was given more importance to the overall regression model that did not embrace SBO variable. Further in the analysis it is explained the rationale behind this procedure. Opposed to the results obtained from univariate analysis and 1st day regression model, regressions 1, 11 and 12 indicated that credit risk is no longer statistical robust after the 1st month, however it continued displaying a negative coefficient. With respect to the regression 2, it showed that public companies continued to positively impact bonds’ mispricing, however without statistical significance. Moreover, regression 11 and 12 showed that public companies continued to be statistical insignificant after adding the effect of the other variables. Thus, after 1 month, the hypothesis suggesting higher levels of underpricing for private companies was discarded. Contrary to 1st day, all regressions (3, 11 and 12) revealed that recent IPOs impact positively bonds’ mispricing, however empirical robustness continued not to be verified. These results are consistent with 1st month univariate analysis and past literature. However, as this variable revealed statistical insignificance, the hypothesis suggesting recent IPOs lead to higher levels of bonds underpricing was not validated. With respect to SBO and recent debt issue variables, different results were obtained relative to the 1st day multivariate analyses. Through regression 4 and 11, it is verified that SBO is no longer statistically significant. Moreover, the coefficient in both regressions is positive, contrary to the coefficient in the 1st day multivariate analysis. These results are congruent with the ones obtained in the 1st month univariate analysis. Regarding recent debt issue variable, regression 5 and 11 showed statistical robustness at a 90% confidence level, even with the presence of SBO in the model. In order to better understand these results, it was performed the same regressions (12 and 13) as in the 1st day. Similarly, regression 12 showed that, once recent debt issue variable is added with the other variables apart from SBO, empirical robustness is find (10% significance level). However, regression 13
showed that, without recent debt issue, SBO is not statistical significant and therefore, implying that the effect of this variable is no longer important to quantify bond’s mispricing. Moreover, as adjusted R squared from regression 12 (0.0254) was higher than regression 11 and 13 (0.0249 and 0.0233), it was given more importance to the regression model that did not include SBO variable. Therefore, as SBO was discarded, the hypothesis stating that IBO bonds are more underpriced than SBO was not verified. Regarding recent debt issues, the results support decreases in bonds’ underpricing as a result of decreases in information asymmetries due to recent book building, following the findings from univariate analyses. Results from regression 6, 11 and 12 suggested that, after 1 month, maturity was still a determinant for bond’s mispricing. The results displayed a positive coefficient, maintaining a significance level equal to 1% as in the 1st day, following the conclusions from the 1st month univariate analysis. Through regression 7, 11 and 12, it was confirmed that total assets continued to impact negatively the level of underpricing, however, statistical robustness was no longer present. Therefore, contrary to the 1st day, the hypothesis suggesting increases in total assets decreases bond’s mispricing was no longer valid. Surprisingly, regression 8, 11 and 12 showed that, after 1 month, bond size variable was statistical significant with a positive coefficient, implying that, for long time horizons, a higher bond size increases the level of bond’s underpricing. From regression 9, 11 and 12, it was verified that age continues not to be statistical robust, in the model. Moreover, it revealed a positive coefficient in both regressions, which was the opposite from 1st day multivariate analysis. As this variable revealed inconsistencies, there were not sufficient evidences to correctly conclude the effect in bond’s mispricing; hence, this variable was discarded. Through regression 10, 11 and 12 it was verified that CDS index level continued to positively impact bond’s mispricing, at 1% significance level. These results follow the conclusions obtained on the 1st day multivariate analysis and both univariate analyses. With these findings, it was possible to conclude that market credit risk is a variable that affects bond’s
mispricing and therefore, to validate previous analyses that suggested macroeconomic conditions as the main reason for changes on the level of bonds’ underpricing overtime. It was also conducted an analysis where it was embraced a “time fixed effect” (regression 14). As it was observed, all variables remained robust; for a more detail analysis, check Appendix 17-Table 2. Similar to the 1st day, the addition of variables in the regression model led to a better explanation of bond’s mispricing. Without considering the “time fixed effect”, the regression with higher adjusted R squared was 12 (0.0254), which included all variables except SBO.
V.
Conclusion
With this thesis, it was intended to analyze the presence of underpricing in bond offers and also the factors that past literature indicated as determinants of bonds’ mispricing. This paper contributes to current literature since not only gave emphasis regarding the 1st trading day after the security’s issue date but also after the 1st trading month. As a result, it was possible to identify the most relevant elements and characteristics investors should take in consideration when analyzing mispricing in fixed income issues depending on the investment time horizon. With this analysis, Banco Carregosa is able to make better appraisals regarding future bond issues and therefore, better advise its clients according to their objectives and time horizon. As expected, the sample revealed positive average abnormal returns of 27.93 bp and 53.00 bp, for both 1st day and 1st month, confirming the first hypothesis that bond issues are on average underpriced. Moreover, high levels of skewness (8.63) and kurtosis (130.14) were obtained on the 1st trading day contrasting with the values obtained in the 1st month (-0.26 and 8.23, respectively), suggesting that initial periods are more volatile and speculative. Regarding the 2nd hypothesis, credit risk revealed to be more determinant in the bond’s mispricing for shorter than longer time periods: 1st day showed statistical robustness for both univariate and multivariate analyses, however, 1st month, multivariate analysis did not display statistical robustness.
abnormal returns for public companies compared to private firms, however statistical robustness was not found to validate that difference. Additionally, multivariate analyses exhibited positive coefficient, showing statistical significance only in the overall regression model of the 1st day. Due to the statistical insignificances and results being contradictory with previous literature, the hypothesis was discarded for both time frames. One possible reason for these results may be related to the assumption made in this thesis on assigning public private subsidiaries from public companies, however it is believed this procedure led to a greater distinction among companies in the sample. Regarding issuers that passed through a recent IPO, both 1st day and 1st month univariate analyses revealed higher abnormal returns relative to non-recent IPO firms, although statistical robustness was not verified. Moreover, both multivariate analyses continued to show statistical insignificances and therefore, the hypothesis suggesting recent IPO companies displayed higher levels of underprice was rejected for both time frames. Regarding the bond’s “nature”, interesting results emerged. Both 1st day univariate and multivariate analyses supported the hypothesis suggesting that IBO issues are on average more underpriced than SBO. Contrary, 1st month univariate and multivariate analyses revealed higher levels of underpricing for SBOs than IBOs, however in default of statistical significance. Moreover, the overall 1st month OLS regression model discarded SBO, implying that this distinction is no longer determinant for extended periods to quantify bond’s mispricing. Therefore, short-term investors (flippers) should take more in consideration the “nature” of the bond than longer-term investors. With respect to recent debt issues, univariate analyses from both time frames showed higher levels of underpricing for non- recent debt issues. Regarding multivariate analyses, the overall OLS regression model in the 1st day did not encompass recent debt issues. Yet, OLS regression model for 1st month included recent debt issues (with 10% significance level). As a result, recent debt issues variable was only verified for longer term periods and therefore, long term investors should focus more their attention in this factor than