Arq. Bras. Med. Vet. Zootec., v.66, n.3, p.827-836, 2014
Intake, milk production and weight change curves for lactating
Holstein x Zebu cows under grazing
[Consumo, curvas de lactação e variação de peso de vacas Holandês x Zebu em pastejo]
S.A. Santos1, S.C. Valadares Filho1, E. Detmann1, J.R.M. Ruas2, L.F. Prados1, L.D.S. Mariz1
1Universidade Federal de Viçosa Viçosa, MG
2Empresa de Pesquisa Agropecuária de Minas Gerais – Epamig Felixlândia, MG
ABSTRACT
The purpose of this study was to evaluate feed intake and develop lactation and weight change curves for Holstein x zebu cows under grazing. Eighteen F1 cows were used, divided into three treatments; 6 were Holstein x Gir (HGI), 6 were Holstein x Guzerat (HGU), and another 6 were Holstein x Nelore (HNE), under the feeding conditions of pasture plus concentrate with 22% of crude protein (CP). To estimate individual feed intake at pasture, 2 markers were used: titanium dioxide to estimate fecal dry matter (DM) excretion, and the indigestible acid detergent fiber (iADF) to estimate individual pasture intake. The Wood (1967) model was used to evaluate milk yield and the parameters were estimated for each genetic group, as follows: HGI = 17.2667*t0.0652*e-0.00424t; HGU = 18.1470*t0.0332*e-0.00408t; and HN =
14.2836*t0.1059*e-0.00552t. The NEFA contents varied according to different genetic groups (P<0.001). It was concluded that the estimated peak DMI occurs during the sixth week of lactation, when the DMI by the different genetic groups was stabilized. The HGI cows have greater cumulative production at 305-d.
Keywords:crossbreeding, F1, lactation, tropical grasses
RESUMO
O objetivo deste estudo foi avaliar o consumo de vacas Holandês x Zebu sob pastejo e desenvolver curvas de lactação e variação de peso para elas. Dezoito vacas F1 foram utilizadas, divididas em três tratamentos: seis foram Holandês x Gir (HGI), seis foram Holandês x Guzerá (HGU, e outras seis foram Holandês x Nelore (HNE), sob as mesmas condições de alimentação com pasto e concentrado com 22% de proteína bruta (PB). Para estimar o consumo individual, dois indicadores foram utilizados: dióxido de titânio para estimar a excreção de matéria seca fecal (DM), e fibra em detergente ácido indigestível (FDAi) para estimar a ingestão de pasto. O modelo de Wood (1967) foi utilizado para avaliar a produção de leite, e os parâmetros foram estimados para cada grupo genético, conforme a seguir: HGI = 17.2667*t0.0652*e-0.00424t; HGU = 18.1470*t0.0332*e-0.00408t; e HN = 14.2836*t0.1059*e-0.00552t. O conteúdo de ácidos graxos não esterificados (AGNE) variou de acordo com os diferentes grupos genéticos (P<0,001). Concluiu-se que o pico estimado para CMS ocorre durante a sexta semana de lactação, quando o CMS pelos diferentes grupos genéticos foi estabilizado. As vacas HGI têm maior produção de leite acumulada aos 305-d.
Palavras-chave: cruzamentos, F1, gramíneas tropicais, lactação
INTRODUCTION
Tropical countries, which have high average
temperatures throughout the year, face
challenges in milk production when using
Recebido em 19 de setembro de 2012 Aceito em 20 de dezembro de 2013
*Autor para correspondência (corresponding author) E-mail: [email protected]
Reserarch project supported by FAPEMIG and INCT Ciência Animal
European cattle breeds because these animals suffer from heat stress and metabolic changes. Consequently, there is a decrease in feed intake and efficiency, as well as pregnancy rates.
production of F1 crossbred females for dairy farms in this environment normally involves breeding zebu (Bos indicus) females with a
Holstein bull to exploit the beneficial effects of heterosis. The zebu breeds most often used are Gir and Guzerat, because these animals possess milk-producing characteristics and are more docile than other zebu breeds. However, there is market discount for heifers birthed by Nelore dams because of a fear of aggressive behavior and lower milk production. Therefore, research is needed to characterize the milk production and performance of these different breed combinations.
In general, zebu breeds are adapted to warmer climates because of their short and fine hairs and dark skin covered with melanin, and increased surface area in the ears and dewlap for heat exchange. Its thermal comfort zone is between 10 and 27°C and can be expanded to 5-31°C for
Bos indicus x Bos taurus crosses, clearly
demonstrating the effects of heterosis (Pereira, 2005). Studies on the performance of zebu cross cows during lactation under grazing conditions are needed; in addition to these factors, tropical C4 grasses are not highly digestible, which results in a lower efficiency of milk production with specialized animals. The objective of this study was to develop feed intake and weight change curves for F1 crossbred Holstein x zebu cows under grazing systems.
MATERIALS AND METHODS
The experiment was carried out at the Empresa de Pesquisa Agropecuária de Minas Gerais Research Farm, in Felixlândia-MG-Brazil, between the months of January and May, 2008. The procedures for humane care and handling of the animals followed the recommendations of the Federal University of Viçosa.
In total, there were 18 F1 cows – 6 Holstein x Gir (HGI), 6 Holstein x Guzerat (HGU) and 6 Holstein x Nelore (HNE) – that formed three experimental treatments with six repetitions. The initial body weight was 560.01±6.62 for Holstein x Nelore; 566.87±4.70 for Holstein x Guzerat and 513.36±5.42 for Holstein x Gir. Cows were placed into the experiment by their similar lactation numbers, which was four or five, for all genetic groups. The cows had recently calved and were distributed in simple random samples
under the same feeding conditions, as follows: pasture plus 220g/kg crude protein (CP) supplement.
Every day after milking (7h00), the cows were led to paddocks of Brachiaria decumbens,
under rotational grazing management. Dry matter intake (DMI) and digestible dry matter (DMd) estimates were obtained for 6 experimental periods, each comprising 21 days, and started during the first week of lactation; milk production and weight change were collected until the end of lactation.
To estimate individual feed intake at pasture, 2 markers were used, during 6 experimental periods of 21 days each, with 14 for adaptation, and 7 for data collection. Titanium dioxide was used as a marker to estimate fecal dry matter (DM) excretion. From the 7th to 18th day of the experimental period, 15g of titanium dioxide was given via an oral catheter to each cow during the afternoon milking at 15h00. There was a total of 11 days of application, being 6 days for stabilization of marker excretion in the feces and 5 days feces collection. Feces were collected twice daily, following each milking. Fecal samples collected were dried, ground and the amount composited proportionately based on the air dry weight per animal. Titanium dioxide concentration was determined using the technique described by Myers et al. (2004).
To determine individual pasture intake, indigestible acid detergent fiber (iADF) was used as an internal marker. To estimate the iADF from the pasture, 2 esophageally fistulated steers were used for the collection of esophageal extrusa on the 16th day of each experimental period. To
Total concentrate (Table 1) was supplied in an individual trough in the milking shed and was supplied according to milk production, providing 1kg of concentrate for each 3kg of milk produced; the initial production needed to be 8kg of milk to receive the initial concentrate. After milking, the feed orts were collected and weighed. The concentrate contained: soybean
meal (240g/kg), ground corn (685g/kg ), urea (20g/kg), ammonium sulfate (2g/kg), limestone (16g/kg), dicalcium phosphate (23g/kg), sodium chloride (4 g/kg), and a mineral premix (10 g/kg), which contained cobalt sulfate (79.3g/kg), copper sulfate (239g/kg), zinc sulfate (635g/kg), potassium iodide (31.7g/kg) and sodium selenite (15.8g/kg).
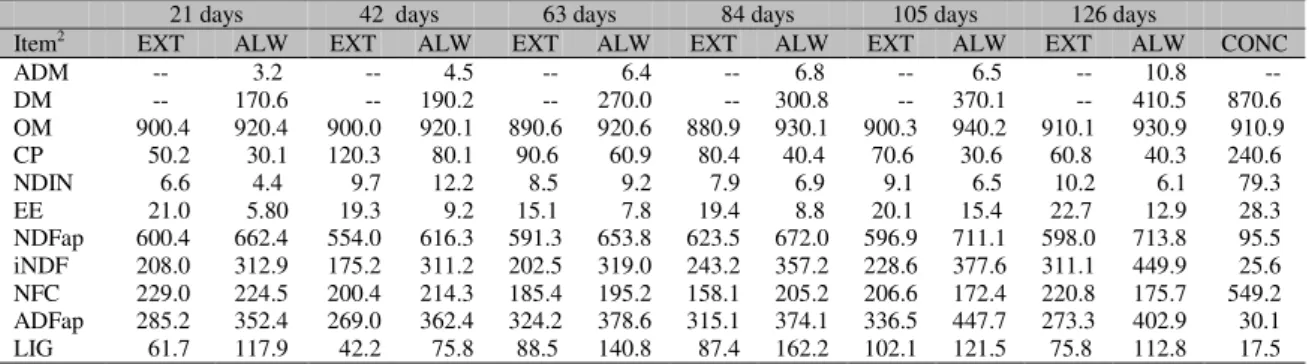
Table 1. Bromatological composition of the concentrate, extrusa and pasture allowance throughout the experimental period1
21 days 42 days 63 days 84 days 105 days 126 days
Item2 EXT ALW EXT ALW EXT ALW EXT ALW EXT ALW EXT ALW CONC
ADM -- 3.2 -- 4.5 -- 6.4 -- 6.8 -- 6.5 -- 10.8 --
DM -- 170.6 -- 190.2 -- 270.0 -- 300.8 -- 370.1 -- 410.5 870.6
OM 900.4 920.4 900.0 920.1 890.6 920.6 880.9 930.1 900.3 940.2 910.1 930.9 910.9
CP 50.2 30.1 120.3 80.1 90.6 60.9 80.4 40.4 70.6 30.6 60.8 40.3 240.6
NDIN 6.6 4.4 9.7 12.2 8.5 9.2 7.9 6.9 9.1 6.5 10.2 6.1 79.3
EE 21.0 5.80 19.3 9.2 15.1 7.8 19.4 8.8 20.1 15.4 22.7 12.9 28.3
NDFap 600.4 662.4 554.0 616.3 591.3 653.8 623.5 672.0 596.9 711.1 598.0 713.8 95.5
iNDF 208.0 312.9 175.2 311.2 202.5 319.0 243.2 357.2 228.6 377.6 311.1 449.9 25.6
NFC 229.0 224.5 200.4 214.3 185.4 195.2 158.1 205.2 206.6 172.4 220.8 175.7 549.2
ADFap 285.2 352.4 269.0 362.4 324.2 378.6 315.1 374.1 336.5 447.7 273.3 402.9 30.1
LIG 61.7 117.9 42.2 75.8 88.5 140.8 87.4 162.2 102.1 121.5 75.8 112.8 17.5
1EXT – esophageal extrusa; ALW – pasture allowance; CONC – concentrate
2ADM – available dry matter (t/ha); DM – dry matter, g/kg; OM – organic matter, g/kg (dry basis); CP – crude protein, g/kg (dry
basis); NDIN – Neutral detergent insoluble nitrogen, g/kg (% NDF); EE – Ether extract, g/kg (dry basis); NDFap – neutral detergent fiber corrected for ash and protein, g/kg (dry basis) ; iNDF – indigestible neutral detergent fiber, g/kg (dry basis) ; NFC –
non-fiber carbohydrates, g/kg (dry basis); ADF – acid detergent fiber, g/kg (dry basis) ; LIG – lignin, g/kg (dry basis).
All pre-drying was done in a ventilated oven at 60 °C for 72 h, and grinding was carried out in a mill with 2 mm mesh sieves. The samples were stored in plastic containers for later analyses of dry matter (DM), organic matter (OM) and crude protein (CP) (AOAC, 1997, method number 934.01 for DM; 930.05 for OM and 981.10 for CP). Ether extract (EE) was analyzed by Soxhlet extraction with petroleum ether. The neutral detergent fiber concentrations, corrected for ash and protein (NDFap), and ADFap were determined using the methodology proposed by Mertens (2002) and were analyzed with the addition of thermostable alpha-amylase (Ankom Tech. Corp., Fairport. NY). Lignin was extracted with 72% sulfuric acid. Neutral detergent insoluble nitrogen (NDIN) was evaluated with the Kjeldahl method (Licitra et al., 1996).
Non-fiber carbohydrates, corrected for ash and protein (NFCap), were calculated as proposed by Detmann and Valadares Filho (2010), where: NFCap = 100 – ([%CP - %CP derived from urea + %urea] + % NDFap + %EE + %ash).
Forage collection, to estimate the pasture allowance, was done on the first day of the experiment and on the last day of each
experimental period. Samples were collected by cutting 10 randomly chosen locations from each paddock, within a 0.49m2 metal frame, as
described by McMeniman (1997) (Table 1). The cows were mechanically milked at 7h00 and 14h00, and daily milk production was recorded. To access the BW change, cows were weighed again every 10 days.
Blood samples were collected on 21th day of each experimental period, by coccygeal venipuncture using test tubes with anticoagulants (EDTA), immediately centrifuged at room temperature and 2.800 x g for 15 min, and after the removal
of the plasma, packed into glass containers and frozen at –15oC, for the subsequent analyses of
NEFAs (Non-esterified fatty acids). To determine the NEFAs, a commercial kit (HR
Series NEFA-HR(2), Wako Diagnostic,
Richmond, VA, USA) was used.
The mathematical model used to fit the lactation curve was: Y = at be−ct(Wood, 1967); where Y =
model from the NRC (Nutrient…, 2001), in which the observed and predicted data were compared by the combined intercept test (Mayer
et al., 1994). In the event the data did not fit the
NRC (Nutrient…, 2001) model, the assessment of DMI using the structure of the model proposed by the NRC (Nutrient…, 2001) and its reparametrization was proposed, as follows: DMI (kg/d) = (a*FCM + b *BW0.75) + (1 – e(c*[WL+d])),
where FCM = 4% fat corrected milk, BW = body weight in kg, WL = week of lactation, and a, b, c, and d = parameters to be estimated, using PROC NLIN of SAS (version 9.1).
To obtain the parameters of non-linear regression equations, the iterative process of the Marquardt algorithm and t statistics were used to determine
confidence intervals for the parameters (1 - α = 0.95). To calculate asymptotic standard-deviation (A-SD), the maximum likelihood estimation method was used. To compare the models between different genetic groups, the test of model identity was used (Regazzi, 1999).
The statistical analyses for the DMI and DMd, as well as NEFAs, were performed using the multiple linear regression model Y = β0 + β1D1 +
β2D2 + β3t + β4(t*D1) + β5(t*D2) + β6t2 +
β7(t2*D1)+ β8(t2*D2) + є; To evaluate BW change
throughout lactation, the statistical analyses were done by adjusting the data to the cube root model, modified to include the effect of genetic groups: Y = D0 + β1D1 + β2D2 + β3t + β4(t*D1) +
β5(t*D2) + β6t½ + β7(t½*D1)+ β8(t½*D2) + β9t³/²+
β10(t³/²*D1)+ β11(t³/²*D2) + є, where D1 and D2
are dummy variables corresponding to the effects of the genetic groups, with D1 = 0 and D2 = 0 for
HNE, D1 = 1 and D2 = 0 for HGU, D1 = 0 and D2
= 1 for HGI, and t was the variable regarding the effect of time over DMI, DMd, NEFA and BW. This study used 5% as the probability for the type I error. The analysis was carried out using the PROC REG of SAS (version 9.1). To compare the models between different genetic groups, the model identification test was used (Regazzi, 1999).
RESULTS
The genetic groups did not have an effect (P>0.05) on the DMI (kg/d and %BW) and the
DMd (Table 2). The regression equation
parameters regarding DMI (kg/d) as a function of days in lactation were significant (P<0.001). The model was quadratic (Table 3), with a positive critical point or maxima. DMI as %BW did not have significant linear or quadratic parameters (P>0.05), and this was also true for the DMd. Since there was no genetic group effect on any DMI parameter, all of the data from the different genetic groups was compiled to develop a DMI equation for F1 cows. The original prediction model from the NRC (Nutrient…, 2001) did not
explain DMI under tropical grazing conditions (P<0.001) according to the combined intercept test.
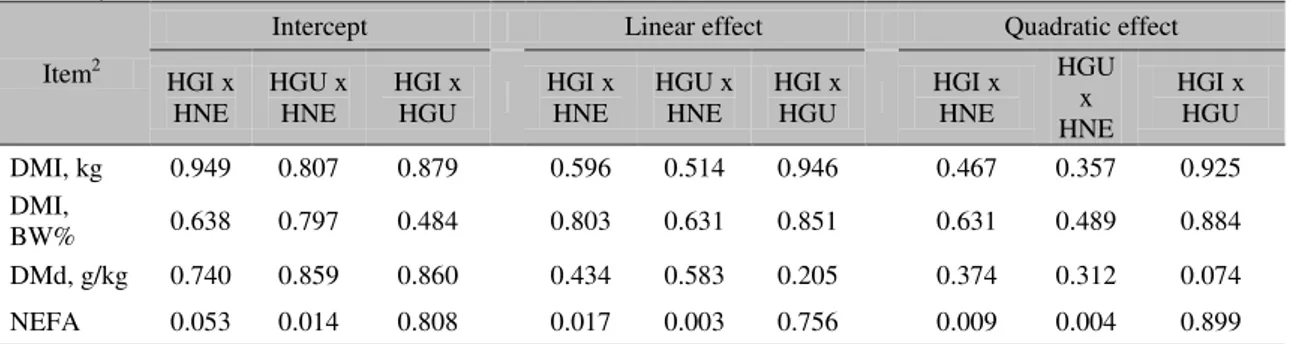
Table 2. Significance level of the genetic group effect (P – value) in multiple linear regression parameters of the days in lactation1
Item2
Intercept Linear effect Quadratic effect
HGI x
HNE HGU x HNE HGI x HGU HGI x HNE HGU x HNE HGI x HGU HGI x HNE
HGU x HNE
HGI x HGU DMI, kg 0.949 0.807 0.879 0.596 0.514 0.946 0.467 0.357 0.925 DMI,
BW% 0.638 0.797 0.484 0.803 0.631 0.851 0.631 0.489 0.884
DMd, g/kg 0.740 0.859 0.860 0.434 0.583 0.205 0.374 0.312 0.074
NEFA 0.053 0.014 0.808 0.017 0.003 0.756 0.009 0.004 0.899
1HGI – F1 Holstein x Gir; HGU – F1 Holstein x Guzerat; HNE – F1 Holstein x Nelore;
2 DMI – Dry matter intake; DMd – Digestible dry matter; NEFA – Non-esterified fat acids, mmol/d
However, the model, when reparametrized (Figure 1), was adequate to predict the DMI of F1 cows under tropical pasture conditions (P=0.1407). After reparametrization of the
model proposed by the NRC (Nutrient…, 2001),
the final equation was obtained, as described:
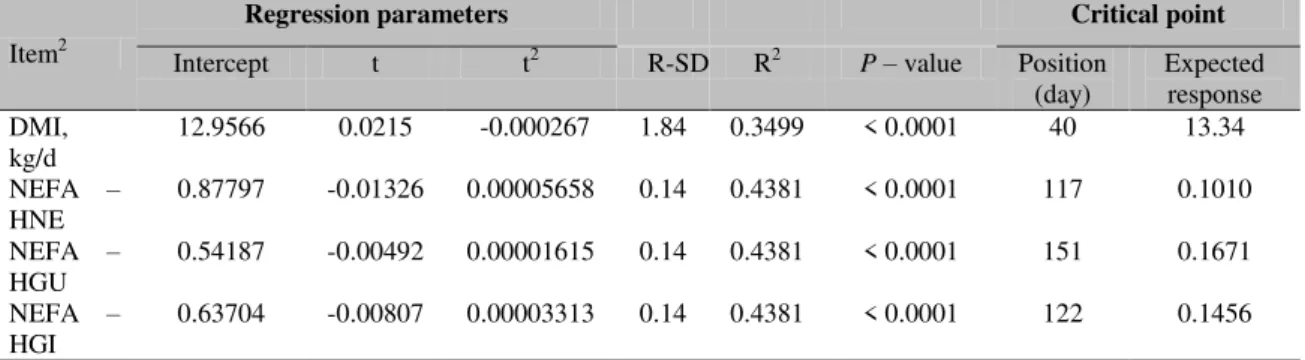
Table 3. Estimated parameters in multiple linear regression models of the days in lactation1
Item2
Regression parameters Critical point
Intercept t t2 R-SD R2
P– value Position
(day) Expected response DMI,
kg/d 12.9566 0.0215 -0.000267 1.84 0.3499 < 0.0001 40 13.34 NEFA –
HNE 0.87797 -0.01326 0.00005658 0.14 0.4381 < 0.0001 117 0.1010 NEFA –
HGU 0.54187 -0.00492 0.00001615 0.14 0.4381 < 0.0001 151 0.1671 NEFA –
HGI 0.63704 -0.00807 0.00003313 0.14 0.4381 < 0.0001 122 0.1456 1t– linear effect of the time; t2– quadratic effect of the time; R-SD – residual standard deviation;
2NEFA – Non esterified fat acids, mmol/d; HGI – F1 Holstein x Gir; HGU – F1 Holstein x Guzerat; HNE – F1 Holstein x Nelore
The parameters of 3 different lactation curves for HGI, HGU and HNE (Table 4) were developed, as follows: HGI = 17.2667*t0.0652*e-0.00424t;
HGU = 18.1470*t0.0332*e-0.00408t; and HNE
=14.2836*t0.1059*e-0.00552t (Figure 1). The lactation curve for HGI cows showed that there was a greater milk production during most of lactation, in comparison to the other groups; its peak lactation was discrete and coincided with those of the HGU cows. The HGI cows had peak
production on day 15, producing 19.33kg/d, and the HGU cows had peak production on day 8, producing 19.08kg/d. The milk production sustained by HGI cows on day 305, in proportion to peak production, was of 35.58% (6.87kg/d), which was a little higher than that of HGU cows (33.60% and 6.41kg/d). The projected total production on day 305 of lactation for HGI cows was greater (3938kg) than HGU cows (3713kg), because of its lower rate of decline in production.
0 3 6 9 12 15 18 21
0 50 100 150 200 250 300
M
il
k
pro
d
u
ct
io
n
,
k
g
Lactation, days
HGI HGU
Figure 1. Lactation curves of the F1 Holstein x zebu cows from different genetic groups as follows: HGI – Holstein x Gir: Y = 17.2667*t0.0652*e-0.00424t; HGU – Holstein x Guzerat: Y = 18.1470*t0.0332*e-0.00408t
and HNE – Holstein x Nelore: Y = 14.2836*t0.1059*e-0.00552t
The HNE cows had, in general, lower cumulative milk production than the other groups (3335kg at day 305), with discrete peak lactation on day 19. Its maximum production was 17.56kg/d, and it had the lowest lactation persistence among the three groups, sustaining only 27.68% of peak production on day 305 of lactation. This group also had the lowest initial production, as can be observed when the intercepts of the equations are
compared (Table 4). The NEFA content (Table 2) varied with genetic group (P<0.05), presenting 3 different equations (P<0.001) as a function of days in lactation (Table 3). Thus, an equation was developed for each group: HGI = 0.63704 - 0.00807*t + 0.00003313*t2; HGU = 0.54187 -
0.00492*t + 0.00001615*t2; and HNE = 0.87797
- 0.01326*t + 0.00005658*t2. The cows birthed
reserves during early lactation, observed by the intercept of the equation. Within 117 days, this group reached a lower level of mobilization compared to the other genetic groups. The cows birthed by Guzerat and Gir dams had lower
NEFA in early lactation and maintained a slower decline in NEFA during lactation, reaching a minimum NEFA at day 151 and 122, respectively. From then on, all of the groups had a resurge of NEFA contents in plasma.
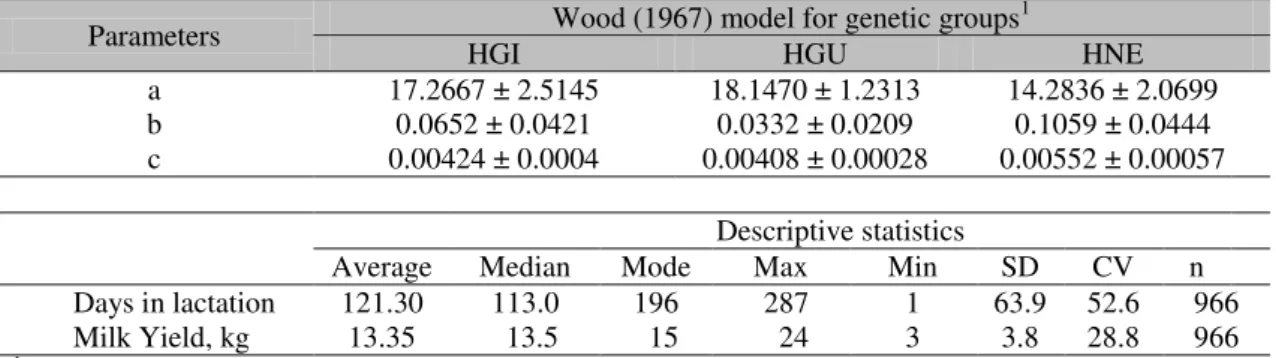
Table 4. Estimated parameters for the Wood (1967) model and descriptive statistics of the observed data
Parameters Wood (1967) model for genetic groups
1
HGI HGU HNE
a 17.2667 ± 2.5145 18.1470 ± 1.2313 14.2836 ± 2.0699
b 0.0652 ± 0.0421 0.0332 ± 0.0209 0.1059 ± 0.0444
c 0.00424 ± 0.0004 0.00408 ± 0.00028 0.00552 ± 0.00057
Descriptive statistics
Average Median Mode Max Min SD CV n
Days in lactation 121.30 113.0 196 287 1 63.9 52.6 966
Milk Yield, kg 13.35 13.5 15 24 3 3.8 28.8 966
1HGI – F1 Holstein x Gir; HGU – F1 Holstein x Guzerat; HNE – F1 Holstein x Nelore; Wood (1967) model: Y=atbe-ct
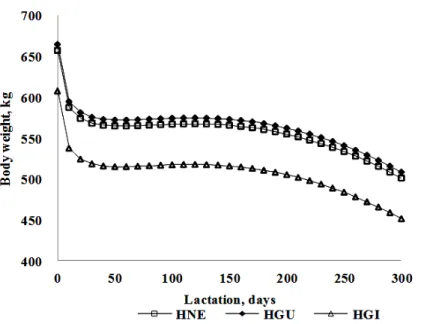
These data may be assessed in combination with those of BW change (Table 5 and Figure 2), because there was a difference in the intercept of the BW change curve for the 3 genetic groups, in addition to describing a second phase of BW loss
after day 150 of lactation, a period that coincided with a reduction in the availability of digestible DM in tropical pasture (after 5 months in pasture).
Table 5. Estimated parameters of the cube root model used to fit the weight variation data throughout days in lactation, different genetic group effects (P– value) and descriptive statistics of the observed data
Iten2 Regression parameters1
intercept t t1/2 t3/2 R-SD R2 P– value
HGI 607.70 3.6957 -32.4659 -0.1352 45.92 0.2379 <0.0001
HGU 664.73 3.6957 -32.4659 -0.1352 45.92 0.2379 <0.0001
HNE 657.42 3.6957 -32.4659 -0.1352 45.92 0.2379 <0.0001
Genetic group effects (P – value)
Intercept t t1/2 t3/2
HGI x HNE < 0.0001 0.0877 0.0616 0.1230
HGU x HNE 0.1913 0.0716 0.0716 0.0650
HGI x HGU 0.0253 0.6214 0.4447 0.8290
Descriptive statistics
average median max min SD CV n
Days in lactation 137.1 140 280 1 68.3 49.8 205
Body weight, kg 552.0 554 667 441 51.9 9.4 205
1t– linear effect; t1/2– cube effect; t3/2– cube root effect; R-SD – residual standard-deviation; 2HGI – F1 Holstein x Gir; HGU –F1 Holstein x Guzerat; HNE – F1 Holstein x Nelore;
There was a difference in the initial BW of the 3 genetic groups (Table 5 and Figure 2) and in the degree of mobilization of NEFA. The HGI and HGU cows had a greater preservation of blood NEFA than the HNE group, at week 7 of lactation, which was the week the cows had the lowest BW since the beginning of lactation.
Despite the different intercepts obtained for the BW change curves, it was observed that the remaining parameters were the same for the different groups (Table 5). Thus, an intercept was defined for each group: HGI = 657.42 + 3.6957*t – 32.4659*t1/2 – 0.1352*t3/2; HGU =
664.73 + 3.6957*t – 32.4659*t1/2 – 0.1352*t3/2;
0.1352*t3/2. This means that all of the genetic
groups had the same rate of BW change throughout lactation.
Thus, the HGI cows, with lower initial weights, had the greatest weight loss when compared to their initial weight, losing 15.25% of their total initial BW through week 18 of lactation, in comparison to 14.08% for the HNE and 13.88% for the HGU groups. The HNE cows, although
showing less BW loss in relation to their initial weight, had a high concentration of circulating NEFAs in the first days of lactation, followed by a sharp reduction, reaching a basal level of 0.101 mmol/ml on day 117 of lactation. HNE circulating NEFA reached 88.5% of the initial concentration, whereas the HGU and HGI reached 69.2% and 76.9%, of their initial concentration, respectively.
Figure 2. Body weight variation curves of the Holstein x zebu cows from different genetic groups as follows: HGI – Holstein x Gir = 607.70 + 3.6957*t – 32.4659*t1/2 – 0.1352*t3/2; HGU – Holstein x
Guzerat = 664.73 + 3.6957*t – 32.4659*t1/2 – 0.1352*t3/2; HNE – Holstein x Nelore = 657.42 + 3.6957*t
– 32.4659*t1/2– 0.1352*t3/2.
DISCUSSION
According to Oldenbroek and Jansen (1978), different breeds or genetic groups together, under grazing systems, have few differences in their
grazing behavior. Feeding behavior is
intrinsically linked to the nature of the food available. Under a grazing system, food must be searched for and gathered by the cow, which turns feeding into a challenge, and other factors associated with pasture characteristics become key factors in determining intake.
Dry matter intake had a maximum value estimated at 13.34kg at 40 days of lactation, a fact that seems to be closely connected to the characteristics of the pasture available. As shown in Table 1, the pasture had lower NDFap content in the extrusa, around day 42, which coincided
with the peak intake for the cows in this experiment. During this period, the pasture also had greater CP and NFCap content and a lower DM content, despite the lower pasture allowance until day 40 of lactation (Table 1).
With the use of new parameters (a = 0.6089 ± 0.0738; b = 0.0244 ± 0.00764; c = -0.2919 ± 0.3774; d = 5.5772 ± 10.4701) for the model proposed by the NRC (Nutrient…, 2001), DMI curves can be obtained for different periods of lactation for F1 cows with different milk production and BW (Figure 1). There was a peak in the curve at approximately 6 week of lactation, when DMI plateaued, remaining constant until the end of lactation. Peak DMI was similar to that proposed by the NRC (Nutrient…, 2001) for multiparous cows, which showed that the structure of this model was adequate to
predict intake based on the inherent
characteristics of the animal, just by reparametrizing the model, even with the large differences in the feeding systems to which the animals were subjected.
Using the model by Wood (1967), peaks of lactation were projected for the different genetic groups. According to Keown et al. (1986) there
is a tendency for delayed peak lactation at higher level of production. Despite the small difference in the number of days, the HGI cows took longer to reach the peak. Nevertheless, this time interval to peak was quite different from that described by Wood (1967), who reported it to be from 5 to 6 weeks, for intensive systems in temperate climates, with Holstein cows that had greater production and greater lactation persistence.
These two crosses also had similar production at the end of lactation, when the milk production was stabilized at the lowest level of production. However, it is possible to affirm that lactation persistence of HGU cows was a little lower than HGI cows. Branton et al. (1974) suggested that
the lower milk production, in pasture-based systems, is the main factor that affects persistence in lactation; that is, the forage allowance is a limiting factor over the dry season, and it is not exactly a climate factor.
Studies in the literature that show the performance of crossbred HNE are non-existent to date. However, some studies may be found for lactation curves of pure breed Nelore cows, with emphasis on calf performance. Few studies measured milk production during the entire
lactation period, showing a linear decrease in milk production and an absence of peak lactation (Alencar, 1988 and Rosado, 1991).
According to Buckley et al. (2000), the first
stage of increased BW loss around 6 weeks was due to expelling the fetus, placenta and other uterine contents, followed by the gradual decrease in BW because of the mobilization of adipose tissues. For Bauman and Currie (1980), in the first month of lactation, the adipose tissue energy may contribute to approximately 33% of milk production. The catabolism of adipose tissue may support the production of 120 to 550kg of milk during the first weeks of lactation. HGI and HGU cows had greater preservation of circulating NEFAs than cows from the HNE group, even after reaching the minimum value during lactation. Rennó et al. (2006), in a review
of several studies, observed that higher genetic-merit cows for milk production showed limited response of adipose tissue to the anti-lipolytic agents, resulting in an increased rate of lipolysis.
Regarding the HNE cows, there was a drop in the level of circulating NEFAs to 88.5% of the initial concentration. This was probably due to the temperament of this group of cows postpartum. Mourão et al. (1997), evaluating the
temperament of different zebu breeds, observed a worse temperament for the Nelore animals. The animals classified as having the worst temperaments are more excitable, ingest less food, are more agitated, do not adapt easily to new situations, and are more difficult to manage (Grandin and Deesing, 1998).
Increased NEFA mobilization at the beginning of lactation, however, was not reflective of greater BW loss. This phenomenon was possible because, as reported by Andrew et al. (1994),
CONCLUSIONS
The peak DMI, estimated by the reparametrized equation from the NRC (2001), occurred during the sixth week of lactation, when there was the stabilization of DMI from pasture. Nonetheless, the cows went through a negative energy balance phase during the seventh week because of the characteristics of the tropical pasture. The HGI group presented the greatest cumulative milk production at 305 days.
REFERENCES
ALENCAR, M.M. Productive Performance of femelas canchim and nelore breed. Rev. Bras. Zootec., v.17, p.411-420, 1988.
ANDREW, S.M.; WALDO, D.R.; ERDMAN, R.A. Direct analysis of body composition of dairy cows at three physiological stages. J. Dairy Sci., v.77, p.3022-3033, 1994.
BAUMAN, D.E.; CURRIE, W.B. Partitioning of nutrients during pregnancy and lactation: A review of mechanisms involving homeostasis and homeorhesis. J. Dairy Sci., v.63,
p.1514-1529, 1980.
BRANTON, C.; RIOS, G.; EVANS, D.L. et al.
Genotype-climatic and other interaction effects for productive responses in Holsteins. J. Dairy Sci., v.57, p.833-841, 1974.
BUCKLEY, F.; DILLON, P.; RATH, M. et al.
The relationship between genetic merit for yield and live weight, condition score, and energy balance of spring calving holstein friesian dairy cows on grass based systems of milk production.
J. Dairy Sci., v.83, p.1878-1886, 2000.
CASALI, A.; DETMANN, E.; VALADARES FILHO, S.C. et al. Influence of incubation time
and particles size on indigestible compounds contents in cattle feeds and feces obtained by in situ procedures. Rev. Bras. Zootec., v.37,
p.335-342, 2008.
DETMANN, E.; VALADARES FILHO, S.C.
et al. On the estimation of non-fibrous
carbohydrates in feeds and diets. Arq. Bras. Med. Vet. Zootec., v.62, p.980-984, 2010.
FORBES, J.M. Voluntary food intake and diet selection in farm animals. Oxon: CAB
International, 1995.
GRANDIN, T.; DEESING, D. Behavioral genetics and animal sciences. In: GRANDIN, T. (Ed). Genetics and behavioral of domestic animals. San Diego: Acad. Press, 1998. p.
341-356.
KEOWN, J.F.; EVERETT, R.W.; EMPET, N.B.
et al. Lactation curves. J. Dairy Sci., v.69,
p.769-781, 1986.
LICITRA, G.; HERNANDEZ, T.M.; VAN SOEST, P.J. Standardization of procedures for nitrogen fractionation of ruminant feeds. Anim. Feed Sci. Technol., v.57, p.347-358, 1996.
MAYER, D.G.; STUART, M.A.; SWAIN, A.J. Regression of real-world data on model output: An appropriate overall test of validity. Agric. Syst., v.45, p.93-104, 1994.
MCMENIMAN, N.P. Methods of estimating intake of grazing animals. In: REUNIÃO ANUAL DA SOCIEDADE BRASILEIRA DE ZOOTECNIA, 34., 1997, Juiz de Fora. Anais… Juiz de Fora:1997. p.131-137.
MERTENS, D.R. Gravimetric determination of amylase-treated neutral detergent fiber feeds with refluxing in beakers or crucibles: Collaborative study. J. AOAC Inst., v.85,
p.1217-1240, 2002.
MOURÃO, G.B.; BERGMANN, J.A.G.;
FERREIRA, M.B.D. Medidas lineares, pelagem e temperamento em fêmeas mestiças F1. Cad. Tec. Esc. Med. Vet. Zootec., v.18, p.61-70, 1997.
MYERS, W.D.; LUDDEN, P.A.; NAYIGIHUGU, V.
Technical note: A procedure for the preparation and quantitative analysis of samples for titanium dioxide. J. Anim. Sci., v.82, p.179-183, 2004.
NUTRIENT requirements of Dairy Cattle, 7.ed. Washington: National Academy Press, 2001. OFFICIAL methods of analysis - AOAC. 15. ed. Washington: Assoc. Off. Anal. Chem., 1990. OLDENBROEK, J.K.; JANSEN, A.A.M. The effect of the grazing behaviour of a breed on the performance of another breed, when they are grazing together. Zeit. für Tierzüch. und Züchtungsb., v.95, p.132-139, 1978.
PEREIRA., J.C.C. Fundamentos de
bioclimatologia aplicada à produção animal.
REGAZZI, A.J. Test for parameter equality in nonlinear regression models. Rev. Ceres, v.46,
p.383-410, 1999.
RENNÓ, F.P.; PEREIRA, J.C.; SANTOS, A.D.F. et al. Effects of body condition at calving
on milk yield and composition, lactation curve and body reserve mobilization of Holstein cows. Arq. Bras. Med. Vet. Zootec., v.58,
p.220-233, 2006.
ROSADO, M.L. Características reprodutivas, produtivas e biométricas de fêmeas Nelore e F1
europeu-Nelore. 1991. 55f. Dissertação
(Mestrado em Zootecnia) – Departamento de Zootecnia, Universidade Federal de Viçosa, Viçosa.