Lactose and milk urea nitrogen: fluctuations during lactation in Holstein cows
Andrés F. Henao-Velásquez1, Oscar David Múnera-Bedoya1, Ana Cristina Herrera1, Jorge H. Agudelo-Trujillo2, Mario Fernando Cerón-Muñoz1,2
1 Genética, Mejoramiento y Modelación Animal, GaMMA, Research Group. Facultad de Ciencias Agrarias, Universidad de Antioquia, Medellín, Colombia. 2 Escuela de Producción Agropecuaria, Facultad de Ciencias Agrarias, Universidad de Antioquia, Medellín, Colombia.
ABSTRACT - The objective of this study was to evaluate lactose and milk urea nitrogen (MUN) in milk from Holstein cows and their relationship with days in milk (DIM), milk yield, milk fat, milk protein, and somatic cell count (SCC). A total of 1,034 records corresponding to morning and afternoon milkings of 148 Holstein cows were used. Records were taken from 16 herds located in the Northern and Eastern dairy regions of Antioquia (Colombia). The curves were fitted using a generalized additive mixed model with smoothed estimates to find the best smoothing intensity factors involved in MUN and lactose concentration. Regarding MUN, the contemporary group effect was highly significant, but the parity effect was not significant. The DIM, lactose and milk fat smoothed covariates were highly significant, while milk yield and fat and SCC showed no statistical difference. Regarding lactose content, the contemporary group effect was highly significant, while the parity effect was not significant. Days in milk, MUN, milk fat, milk protein, and afternoon-milking SCC smoothed covariates were highly significant, while milk yield and morning-milking SCC were not significant. Lactose and milk urea nitrogen concentrations are affected by various factors throughout lactation, mainly by days in milk.
Key Words: dairy cattle, generalized additive model, milk metabolites, milk yield
Introduction
The water content in milk largely determines milk fat and protein concentrations. Furthermore, the rate of water secretion depends on lactose synthesis, and lactose determines milk osmolarity (Miglior et al.,2006). Lactose levels, in turn, can change according to variations in glucose concentration, somatic cell count, and energy availability for physiological processes.
Milk urea nitrogen (MUN), which is a normal constituent of milk, represents a portion of milk non-protein nitrogen and a variable fraction of milk total nitrogen. Milk urea nitrogen is synthetized as urea in blood serum, so it can pass through the secretory cells of the mammary gland, which would be an indication of the amount of degradable protein in the rumen (Gustafsson and Palmquist, 1993).
Urea, a major end product of nitrogen metabolism in dairy cows, is mostly synthesized in the liver and transported to the kidneys for excretion via urine. The concentration of urea in the blood rapidly equilibrates
with other body fluids, including milk (Gustafsson and Palmquist, 1993).
Milk urea nitrogen and lactose concentrations in milk may vary from herd to herd, between cows of the same herd, and along the course of lactation. It is important to determine how both metabolites fluctuate as well as their influence on other milk fractions because concentrate feed is an important component of the cost structure of dairy farms and excessive dietary nitrogen can affect the reproductive efficiency of cows and cause negative environmental impacts (Rajala-Schultz and Saville, 2003). Because milk metabolites normally vary throughout lactation, their concentration can be affected by metabolic and physiological changes. The analysis of changes in milk metabolites should consider different sources of variation and statistical methods. Generalized additive statistical models (GAM) are regularly used in biology and ecology. These models are an extension of generalized linear models (GLM). By the addition of terms and factors in the model they can be set as parametric or non-parametric smoothed functions (Gu, 2002; Hastie and Tibshirani, 1986; Wood, 2008) which allow for replacing linear functions of the predictor variables with “smoothing” functions (Zuur et al., 2007).
The objective of this study was to model MUN and lactose levels in Holstein cows and their relationship with days in milk (DIM), milk yield, milk fat, milk protein, and somatic cell count (SCC) to understand the excretion path of both metabolites during lactation.
ISSN 1806-9290
www.sbz.org.br R. Bras. Zootec., 43(9):479-484, 2014
Received December 20, 2013 and accepted July 16, 2014. Corresponding author: [email protected] http://dx.doi.org/10.1590/S1516-35982014000900004
Material and Methods
Records were taken from a dairy herd improvement program led by the GaMMA research group of a University of Antioquia (Colombia) and Corporación Antioquia Holstein. This program controls milk yield (lactose), milk fat (g kg–1), milk protein (g kg–1), lactose (g kg–1), MUN
(mg dL–1) and SCC (1,000 cells mL–1) records per animal.
A total of 1,034 records from 148 Holstein cows of first, second, and third parity were used. The program measured individual milk yield according to a 4 × 2methodology set by the International Committee for Animal Recording (ICAR, 2002). Samples were taken monthly during the morning and afternoon milkings between January and October 2012. Milk analysis for composition and sanitary traits were conducted based on flow cytometry and Fourier transform infrared. The equipment was previously calibrated with a raw-milk standard (Eastern Laboratory Services, Medina, OH, USA).
The study was conducted in 16 dairy herds from Antioquia (Colombia). Thirteen herds were located in the Northern dairy region of the province (San Pedro de los Milagros, Entrerrios, and Belmira municipalities) and three in the Eastern region (Rionegro, El Carmen de Viboral, and La Ceja municipalities). Both areas correspond to a per-humid premontane forest life zone, with 16 °C average temperatures, heights between 2,000 and 3,000 m over the sea level, annual rainfall ranging between 2,000 and 4,000 mm, and topography ranging from flat to wavy.
The studied herds were managed under intensive rotational grazing on Kikuyu grass (Pennisetum clandestinum) highly fertilized with nitrogen. Cows were suplemented with 160 to 180 g kg–1 protein concentrates
(each cow was given 1.0 kg concentrate per 4.0 kg milk produced). Records from animals over three parities or cows over 305 days in milk were excluded from the analysis.
A generalized additive model (GAM) with smoothed estimates was used to evaluate MUN and lactose. This model considered the nested effect of animal within farm and the effects of farm, parity, and contemporary group. The classes were: a first group corresponding to records from January, February and March (13.6 ºC and 85.4% humidity); a second group for April, May and June records (14.4 ºC and 84.6% humidity) and a third group for July, August, September and October (14.4 ºC and 81.4% humidity). The somatic cell counts from morning and afternoon milkings were transformed (SCCT) using Log2 (cell mL−1*100−1)+3,
as adapted by Dabdoub and Shook (1984).
The model used to estimate the MUN curve was as follows:
yijklmnopqrst = α + Ci + Nj + hk + al:k + s(dm) + s(mn) + s(fo) + s(pp) + s(lq) + s(tr) + s(qs) + eijklmnopqrst,
in which: yijklmnopqrst = milk urea nitrogen (mg dL–1); α =
intercept; Ci = fixed effect of contemporary group;Nj = fixed effect of parity; hk = random effect of farm; al:k = Random effect of cow nested within farm; s(dm) = smoothed, non-parameterized function of the m-th day in milk; s(mn) = smoothed, non-parameterized function of the n-th milk yield; s(fo) = smoothed, non-parameterized function of the
o-th fat; s(pp) = smoothed, non-parameterized function of the
p-th protein; s(lq) = smoothed, non-parameterized function of the q-th lactose; s(tr) = smoothed, non-parameterized function of the r-th somatic cell count (transformed) in the afternoon milking; s(qs) = smoothed, non-parameterized function of the s-th somatic cell count (transformed) in the morning milking; and eijklmnopqrst = residual effect.
The model for lactose had the same structure as that used for MUN. The only changes were the degree of smoothing intensity used for each covariate, and the latter model does not take into account the smoothing lactose effect and replaces it with the smoothing MUN effect.
The Bayesian Information Criterion (BIC) was used to decide the smoothing intensity of covariates and the other effects in the MUN and lactose models. The procedure consisted of increasing the degree of smoothing of each covariate from three to thirteen to finally select the lowest BIC value. This was done to find the fit that best smoothed the curve for each covariate.
The statistical analysis for modeling the curve was performed with the gamm4 function of “gamm4” library (Wood, 2014) using the R software (R Core Team, 2014). Assumption of normality of residuals was tested for the models using the Kolmogorov-Smirnov method modified by Lilliefors (Lilliefors, 1967; Gross and Ligges, 2012). Homogeneity of residual variances was tested with the Fligner-Killeen test (Fligner and Killeen, 1976; R Core Team, 2014).
Results
The means for milk yield, milk fat, milk protein, lactose, and MUN were 22.01±6.20 L, 35.1±5.3 g kg−1, 30.1±2.7 g kg−1,
45.5 ±2.2 g kg−1, and 17.28±3.66 mg dL−1, respectively. The
SCC medians were 67,000 and 82,000 cells mL−1 for the
a phenotypic variance ratio of 0.27 and 0.17, respectively (Table 2).
Milk yield, protein, and somatic cell count smoothed covariates (morning and afternoon milkings) were not statistically significant (P>0.05), but DIM, fat, and lactose were highly significant (P<0.01), with five, four and three degrees of smoothing, respectively.
The average MUN in the first 115 DIM increased from 14.1 to 17.75 mg dL−1, then dropped to 17.40 mg dL−1 on
195 DIM and increased to 18.50 mg dL−1 until 300 DIM
(Figure 1a). The average MUN (14.55 to 18.55 mg dL−1)
increased when lactose increased from 37.7 to 51.3 g kg−1
(Figure 1b). Average MUN increased from 16.17 to 18.59 mg dL−1 when milk fat increased from 25 to 45 g kg−1, remained
at 18.59 mg dL−1 from 45 to 48 g kg−1 and then decreased to
17.0 mg dL−1 when milk fat was 59.9 g kg−1, but with a very
wide confidence band for smooths (Figure 1c).
The model for lactose showed highly significant difference for the contemporary group effect (P<0.01) but parity order was not significant (P>0.05). The variances for farm and cow nested in farm were 0.81 and 1.30 (g kg−1)2,
with a ratio of phenotypic variance of 0.19 and 0.35, respectively (Table 2).
Figure 1 - Association of milk urea nitrogen (MUN) with days in milk (DIM; a), lactose (b) and milk fat (c) in Holstein cows.
Table 1 - Milk traits and yield of Holstein cows in Antioquia (Colombia)
Trait Mean±SD Minimum Median Maximum
Days in milk 143.2±76.69 2 140 303
Milk yield (L) 22.01±6.20 8 22 46
Fat (g kg−1) 35.1±5.3 25 34.5 59.6
Protein (g kg−1) 30.1±2.7 24.2 29.8 39.1
SCC a.m. 184.9±421.78 5 67 4363
SCCT a.m. 12.57±1.74 8.32 12.39 18.41
SCC p.m. 215.4±531.31 3 82 7833
SCCT p.m. 12.80±1.71 7.9 12.68 19.26
Milk urea nitrogen (mg dL−1) 17.28±3.66 3.33 17.20 29.41
Lactose (g kg−1) 45.5±2.2 37.7 45.7 51.3
SSC - somatic cell count (1,000 cells mL–1); SSCT - somatic cell count transformed by Log
2 (cells mL–1 × 100–1) + 3; a.m. - morning milking; p.m. - afternoon milking.
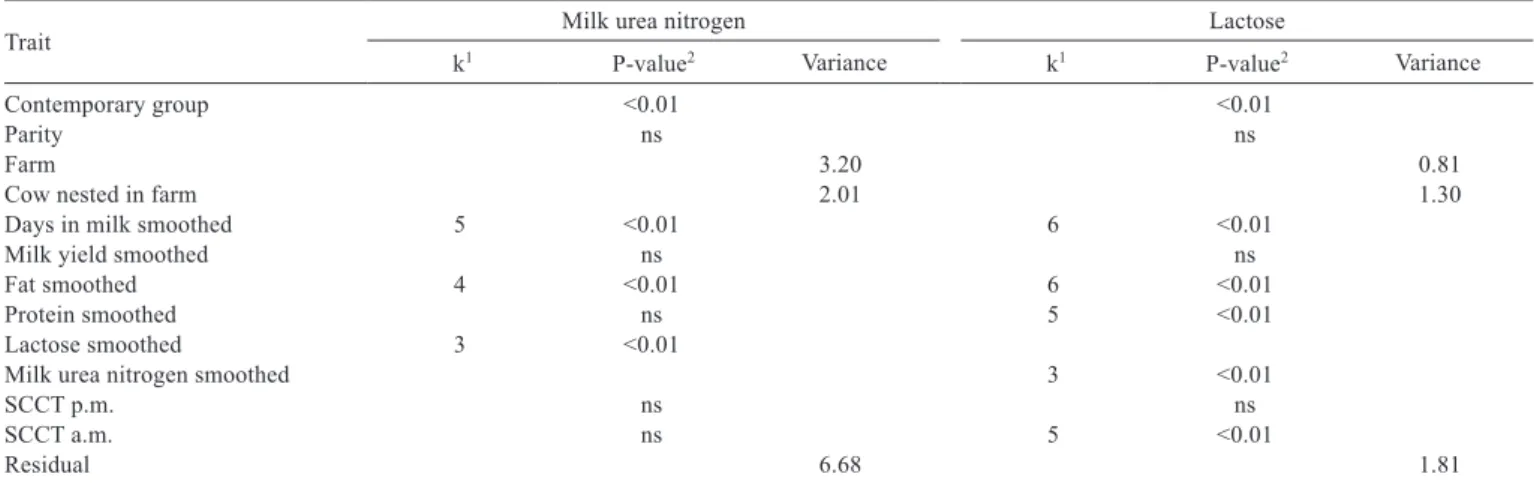
Table 2 - Analysis of variance of milk urea nitrogen and lactose in milk of Holstein cows in Antioquia (Colombia)
Trait Milk urea nitrogen Lactose
k1 P-value2 Variance k1 P-value2 Variance
Contemporary group <0.01 <0.01
Parity ns ns
Farm 3.20 0.81
Cow nested in farm 2.01 1.30
Days in milk smoothed 5 <0.01 6 <0.01
Milk yield smoothed ns ns
Fat smoothed 4 <0.01 6 <0.01
Protein smoothed ns 5 <0.01
Lactose smoothed 3 <0.01
Milk urea nitrogen smoothed 3 <0.01
SCCT p.m. ns ns
SCCT a.m. ns 5 <0.01
Residual 6.68 1.81
1 k sets the upper limit on the degrees of freedom associated with a smooth (1 degree of freedom is usually lost to the identifiability constraint on the smooth). 2 P-value is a highly significant (P<0.01) or not significant (ns; P<0.05) statistical effect.
The MUN model met the assumption of normality of the residuals (P>0.05) according to the Kolmogoroy-Smirnov test modified by Lilliefors (1967). The MUN and lactose models met the assumption of variance of the residuals (P>0.05) according to the Fligner-Killeen test (Fligner and Killeen, 1976).
Discussion
In regard to MUN variances, the farm:phenotypic variance, and the animal within farm:phenotypic variance ratios were moderate, suggesting that there is a farm-management component involved and a genetic component of each animal that affects MUN levels, which is in agreement with Rajala-Schultz and Saville (2003). The contemporary group was highly significant (P<0.01), with the lowest MUN concentration in contemporary group Two, period which coincided with the rainy season. This result is similar to reports by Carlsson et al. (1995), Miglior et al. (2006), and Rajala-Schultz and Saville (2003), who found that MUN tended to decrease in winter and early summer. This corresponded to a period of good biomass availability in the farms of our study, favoring an adequate protein-energy balance in the diet.
The smoothed DIM, milk fat, and lactose variables were highly significant with respect to MUN concentration. Jilek et al. (2006) and Arunvipas et al. (2003) found similar results that followed a similar path to that observed in the present study.
The MUN concentrations relative to DIM results were similar to those reported by Arunvipas et al. (2003), Carlsson et al. (1995), Godden et al. (2001), Johnson and Young (2003), Jilek et al. (2006), and Rajala-Schultz and Saville (2003), who found that the lowest MUN concentration occurred at the beginning of lactation and then increased to a maximum between days 90 to 120. Milk urea nitrogen stabilized in the second third and even during part of the last third of lactation (day 230) with very slight changes- and then increased again towards the end of lactation. This is contrary to reports by Carlsson et al. (1995) and Godden et al. (2001), whose results show MUN concentration declining after 150 days in milk, following a path similar to the lactation curve. Meanwhile, Ng-Kwai-Hang et al. (1985) reported that MUN fell rapidly after calving and then increased gradually at the end of lactation, which is similar to the results found in this study, as the MUN curve also showed a slight increase in the first 115 d and after 195 d of lactation.
The path followed by MUN versus the milk fat curve resembles a parabola. Arunvipas et al. (2003) and Jilek et al.
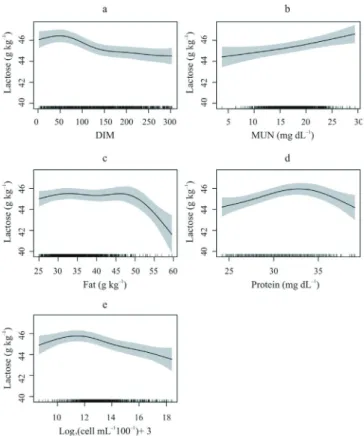
Figure 2 - Association of lactose concentration with days in milk (DIM; a), milk urea nitrogen (MUN; b), fat (c), protein (d) and transformed somatic cell counts (e) in the morning milking in Holstein cows.
Milk yield and afternoon-milking somatic cell count smoothed covariates were not significant (P>0.05). The DIM, MUN, milk fat, milk protein and morning-milking SCCT were highly significant (P<0.01), with six, three, six, five and five degrees of smoothing, respectively.
The lactose contents decreased from 46.5 to 44.6 g kg−1
from baseline until 300 days of lactation (Figure 2a). Lactose increased from 44.3 to 46.6 g kg−1 when MUN
increased from 3.33 to 29.41 mg dL−1 (Figure 2b). Average
lactose increased from 44.9 to 45.5 g kg−1 when milk fat
increased from 25 to 32 g kg−1. Lactose remained close to
45.6 g kg−1 when milk fat was between 32 and 47 g kg−1.
Subsequently, lactose was drastically reduced to 41.3 g kg−1
when milk fat was 60 g kg−1 (Figure 2c).
The average lactose concentration increased from 44.19 to 45.97 g kg−1 when milk protein increased from
24.20 to 32.2 g kg−1. When milk protein increased from
33.6 to 39.10 g kg−1, lactose was reduced to 44.17 g kg−1
(Figure 2d)
The average lactose concentration increased from 45.2 to 45.8 g kg−1 when the SCCT increased from 8.32 to 11.5
(5,000 to 36,203 cells mL−1, respectively). Subsequently,
a lactose reduction to 43.7 g kg−1 occurred when the count
(2006) reported a similar result, highly significant for MUN relative to milk fat, and a quadratic negative curve for the association of both metabolites whereas the contrary was reported by Godden et al. (2001), who also found statistical significance, but with a negative association. Meanwhile, Johnson and Young (2003) and Rajala-Schultz and Saville (2003) found a positive association between MUN and milk fat, a result that contrasts with this study and the report by Jilek et al. (2006).
Milk yield showed no significant difference in this study, differing from reports by Carlsson et al. (1995), Pedraza et al. (2006), and Rajala-Schultz and Saville (2003), who found significant difference (P<0.05) for MUN concentration with respect to milk yield.
In a study on factors associated with MUN concentration, Godden et al. (2001) found a positive relationship between MUN and milk yield, which is similar to the results of the present study, where MUN described a positive trajectory as milk yield increased. Both results contrast with those by Pedraza et al. (2006), who found that low MUN concentrations were associated with high yields. Other researchers have reported high MUN at peak lactation (Carlsson et al., 1995; Johnson and Young, 2003). The increase in MUN as yield increases can be explained by the high amount of protein consumed required to increase milk production (Jonker et al., 1999).
In regard to milk protein content, no relationship between milk protein and MUN was found, contrary to the findings by Pedraza et al. (2006), who reported that protein values below and above 32 g kg−1 were significantly
associated with MUN concentration (P<0.05). Our result also differs from Godden et al. (2001) and Johnson and Young (2003), who reported increasing protein content with decreasing MUN levels.
On the other hand, Cao et al. (2010) found a statistically significant association between MUN and lactose. Milk urea nitrogen concentration reached the peak when lactose percentage was 42 g kg−1. The relationship between lactose
and MUN may be an indirect result of milk yield, explained by the role of lactose synthesis in the regulation of milk secretion. Miglior et al. (2006) deduced an association between MUN and lactose concentrations with cow in the longevity of cow.
The transformed-SCC was not different with respect to MUN (P>0.05). This is contrary to reports by Godden et al. (2001), Hojman et al. (2004), and Rajala-Schultz and Saville (2003), who found a highly significant negative relationship between MUN and SCC. On the contrary, Pedraza et al. (2006) reported that MUN concentration increased significantly with increasing SCC values.
According to McDonald et al. (1995), this happens when a highly swollen mammary gland with elevated levels of somatic cells has flaws in the bond between cells allowing the passage of elements such as urea, chloride, sodium, and serum proteins from blood to milk. Meanwhile, Ng-Kwai-Hang et al. (1985) found no association between the content of MUN and SCC.
In the present study, the lactose curve showed a progressive decrease as DIM advanced, with a maximum value at the beginning. This disagrees with reports by Miglior et al. (2006) and Ptak et al. (2012), who found that the lactose curve was very similar to the milk yield curve, with a maximum value between 30 and 60 days and a gradual decrease in the remaining days.
Miglior et al. (2006) found that the lowest lactose concentration occurred in summer time. This differs from this study, where the lowest lactose concentration values were observed in April, May and June, months that coincide with the rainy season. This can be explained by the high forage supply with adequate non-protein nitrogen content at this time of the year. Furthermore, supplementation levels are lower in these months, favoring an energy:protein balance in the diet.
The lactose showed a negative relationship with respect to the transformed-SCC in the morning milking. Miglior et al. (2006) found a similar result in cows that had low lactose when SCC levels increased. Miglior et al. (2007) found that lactose was negatively correlated with SCC (−0.20).
Finally, Miglior et al. (2007) reported that lactose was not correlated with milk yield (0.096). Our study did not find statistical differences between them.
Conclusions
Variations of milk urea nitrogen during lactation are highly influenced by the changes in days in milk, lactose, and fat percentage. Furthermore, lactose levels depend on days in milk and are related to fat, milk urea nitrogen, and somatic cell count.
Acknowledgments
(Project: Modeling the Lactose and Milk Urea Nitrogen Curve for Holstein Cows in Antioquia and its Relationship with Genetics and Breeding), and was also supported by “Corporacion Antioquia Holstein”.
References
Arunvipas, P.; Dohoo, I. R.; VanLeeuwen, J. A. and Keefe, G. P. 2003. The effect of non-nutritional factors on milk urea nitrogen levels in dairy cows in Prince Edward Island, Canadá. Preventive Veterinary Medicine 59:83-93.
Cao, Z.; Huang, W.; Wang, T.; Wang, Y.; Wen, W.; Ma, M. and Li, S. 2010. Effects of parity, days in milk, milk production and milk components on milk urea nitrogen in chinese Holstein. Journal of Animal and Veterinary Advances 9:688-695.
Carlsson, B. J.; Bergstrom, J. and Pehrson, B. 1995. Variations with breed, age, season, yield, stage of lactation, and breed in the concentration of urea in bulk milk and individual cow’s milk. Acta Veterinaria Scandinavica 36:245-254.
Dabdoub, S. M. and Shook G. E. 1984. Phenotypic relations among milk yield, somatic cell count and clinical mastitis. Journal of Dairy Science 67:163-164.
Fligner, M. and Killeen, T. 1976. Distribution-free two simple test for scale. Journal of the American Statistical Association 71:210-213. Godden, S. M.; Lissemore, K. D.; Kelton, D. F.; Leslie, K. E.; Walton,
J. S. and Lumsden, J. H. 2001. Factors associated with milk urea concentrations in Ontario dairy cows. Journal of Dairy Science 84:107-114.
Gross, J. and Ligges, U. 2012. Nortest: Tests for normality version. 1.0–2. R package. Available at: <http://cran.r-project.org/web/ packages/nortest/nortest.pdf>. Accessed on: Nov. 28, 2013. Gu, C. 2002. Cross-validating non-Gaussian data. Journal of
Computational and Graphical Statistics 1:169-179.
Gustafsson, A. H. and Palmquist, D. L. 1993. Diurnal variation of rumen ammonia, serum urea and milk urea in dairy cows at high and low yields. Journal of Dairy Science 76:475-484.
Hastie, T. and Tibshirani, R. 1986. Generalized additive models. Statistical Science 1:297-318.
Hojman, D.; Kroll, O.; Adin, G.; Gips, M.; Hanochi, B. and Ezra, E. 2004. Relationships between milk urea and production, nutrition, and fertility traits in Israeli dairy herds. Journal of Dairy Science 87:1001-1011.
ICAR - International Committee for Animal Recording. 2002. Frequency of milk visits. ICAR International agreement of recording practices. Section 2.3.1.2. Available at: <http://www.icar.org>. Accessed on: Feb. 25, 2013.
Jilek, F.; Řehak, D.; Volek, J.; Štipkova, M.; Němcova, E.; Fiedlerova, M.; Rajmon, R. and Švestkova, D. 2006. Effect of herd, parity, stage of lactation and milk yield on urea concentration in milk. Czech Journal of Animal Science 51:510-517.
Johnson, R. G. and Young, A. J. 2003. The association between milk urea nitrogen and DHI production variables in western commercial dairy herds. Journal of Dairy Science 86:3008-3015.
Jonker, J. S.; Kohn, R. A. and Erdman, R. A. 1999. Milk urea nitrogen target concentrations for lactating dairy cows fed according to National Research Council recommendations. Journal of Dairy Science 82:1261-1273.
Lilliefors, H. 1967. On the Kolmogorov-Smirnov test for normality with mean and variance unknown. Journal of the American Statistical Association 62:399-402.
McDonald, P.; Edwards, R. A.; Greenhalgen, J. and Morgan, C. 1995. Nutrición animal. 5th ed. Acribia, Zaragoza.
Miglior, F.; Sewalem, A.; Jamrozik, J.; Lefebvre, D. M. and Moore, R. K. 2006. Analysis of milk urea nitrogen and lactose and their effect on longevity in Canadian dairy cattle. Journal of Dairy Science 89:4886-4894.
Miglior, F.; Sewalem, A.; Jamrozik, J. Bohmanova, J.; Lefebvre, D. M. and Moore, R. K. 2007. Genetic analysis of milk urea nitrogen and lactose and their relationships with other production traits in Canadian Holstein cattle. Journal of Dairy Science 90:2468-2479. Ng-Kwai-Hang, K. F.; Hayes, J. F.; Moxley, J. E. and Monardes, H.
G. 1985. Percentages of protein and non protein nitrogen with varying fat and somatic cells in bovine milk. Journal of Dairy Science 68:1257-1262.
Pedraza, C.; Mansilla, A.; Merucci, F.; Pinedo,P. and Contreras, H. 2006. Niveles de urea láctea en vacas de la Región del Bío-Bío, Chile. Chilean Journal of Agricultural Research 66:264-270. Ptak, E.; Brzozowski, P. and Bieniek, J. 2012. Genetic parameters
for lactose percentage in the milk of Polish Holstein-Friesians. Journal of Animal and Feed Sciences 21:251-262.
Rajala-Schultz, P. J. and Saville, W. J. 2003. Sources of variation in milk urea nitrogen in Ohio dairy herds. Journal of Dairy Science 86:1653-1661.
R Development Core Team. 2014. R: A language and environment for statistical computing. Version 3.0.3 Viena, Austria. Available at: <http://www.R-project.org/>. Accessed on: Apr. 8, 2014.
Wood, S. N. 2008. Fast stable direct fitting and smoothness selection for generalized additive models. Journal of the Royal Statistical Society. Series B Statistical Methodology 70:495-518.
Wood, S. N. 2014. gamm4: Generalized additive mixed models using mgcv and lme4. version 0.2–2. R package. Available at <http:// CRAN.R-project.org/package=gamm4>. Accessed on: Apr. 8, 2014. Zuur, A. F.; Leno, E. N. and Smith, G. M. 2007. Analysing ecological