Elaboration and characterization of snack bars made
with ingredients from the Amazon
Isadora Cordeiro dos PRAZERES1, Alessandra Ferraiolo Nogueira DOMINGUES2*,
Ana Paula Rocha CAMPOS1, Ana Vânia CARVALHO2
1 Universidade Federal do Pará, Rua Augusto Corrêa, 01, Bairro Guamá, CEP: 66.075-110, Belém, Pará, Brasil.
2 Embrapa Amazônia Oriental, Laboratório de Agroindústria, Travessa Doutor Enéas Pinheiro, s/n, Bairro Marco, CEP: 66.095-903, Belém, Pará, Brasil.
* Corresponding author: [email protected]
ABSTRACT
Snack bars were launched on the market as an alternative for people seeking healthier food options. They are popular portable snacks commonly eaten between meals. This study aimed to develop snack bars made with tapioca flour, Brazil nut and native fruit pulps (açaí, cupuaçu, muruci and taperebá) as well as to assess their physical, physicochemical, microbiological and sensory attributes. The preferred concentration of fruit pulp was 10% in the açaí bar, and 15% in the cupuaçu, muruci and taperebá bars. The acceptance rate of the açaí bars was greater than 70% for the attributes appearance, color, texture, and overall impression, but was lower for flavour. This result may be related to the eating habits of some panelists, who eat açaí pulp without adding any other ingredients that can impart the unique flavour of the fruit. The cupuaçu and muruci snack bars had higher sensory acceptance than the açaí and taperebá bars; therefore, they are more likely to have better market prospects.
KEYWORDS: Amazon fruits, Brazil nut, palm oil, sensory analysis, tapioca flour
Elaboração e caracterização de barras de cereais à base de
ingredientes da Amazônia
RESUMO
Como uma alternativa para as pessoas que procuram opções para uma alimentação saudável, as barras de cereais foram lançadas no mercado. Elas são populares como alimentos portáteis e podem ser consumidas entre as refeições. Este trabalho teve como objetivo desenvolver e determinar as variáveis físicas, físico-químicas, microbiológicas e sensoriais de barras de cereais à base de farinha de tapioca, castanha-do-brasil e polpas de frutas regionais (açaí, cupuaçu, muruci e taperebá). A concentração preferida de polpa na barra sabor açaí foi de 10% e nas barras sabor cupuaçu, muruci e taperebá de 15%. O índice de aceitação da barra sabor açaí foi superior a 70% nos atributos aparência, cor, textura e impressão global e inferior no sabor. Este comportamento pode estar relacionado à cultura de alguns provadores, os quais têm o hábito de consumir a polpa de açaí sem adição de qualquer outro ingrediente que possa mascarar o sabor intrínseco e peculiar do fruto. As barras sabor cupuaçu e muruci, por apresentarem maior aceitação sensorial, quando comparadas às barras sabor açaí e taperebá, têm melhores perspectivas de mercado caso sejam comercializadas.
INTRODUCTION
Snack bars were introduced in Brazil a decade ago, initially targeted at sports fans, but their target market expanded over time, reaching a much wider public, from students to corporate executives. They are popular portable snacks commonly eaten between meals (Freitas and Moretti 2006; Pallavi et al. 2013).
The use of regional raw materials to formulate snack bars can be very interesting from a nutritional and sensory point of view, besides adding value to raw materials and products from the Amazon region. Tapioca flour, a by-product of cassava (Manihot esculenta Crantz), is widely consumed in the Amazon region and commonly sold on street markets (Alves and Modesto Júnior 2012; Chisté et al. 2012; Silva et al. 2013). Cassava and its by-products are naturally gluten-free foods and therefore can be added to products labeled “gluten-free” (Milde et al. 2010; Schamne et al. 2010).
Brazil nuts (Bertholletia excelsa Humb. & Bonpl.) are widely recognized for being high in calories and for their nutritional value (Jayasinghe and Caruso 2011). They have been the focus of numerous studies aiming to extract their main nutritional and functional components (John and Shahidi 2010; Stockler-Pinto et al. 2010; Colpo et al. 2014).
The Amazon has the most important repository of fruit species in Brazil (Gordon et al. 2011). Fruits such as cupuaçu (Theobroma grandiflorum (Willd. ex Spreng.) K. Schum.), açaí (Euterpe oleracea Mart.), taperebá (Spondias mobin L.), and muruci (Byrsonima crassifolia (L.) Rich.) are commonly found in this region (Freitas and Mattietto 2013). The açaí pulp has gained increasing international attention due to its nutritional benefits and therapeutic potential (Barros et al. 2015; Romualdo et al. 2015; Barbosa et al. 2016). It contains approximately 13% protein, 48% lipids, 1.5% of total sugars, and several other components such as lignans, fibers, vitamin E and polyphenols (Darnet et al. 2011; Bonomo et al. 2014; Wycoff et al. 2015).The taperebá pulp has, on average, 0.2% protein, 0.1% lipids, and 12.4% carbohydrates (Salgado et al. 2013). Cupuaçu pulp has, on average, 1% of proteins and lipids and 11% carbohydrates (Brasil 2015). Muruci pulp contains approximately 0.18% protein, 0.87% lipids, and 2.59% total sugars (Souza et al. 2012). Due to its high content of polyphenols and flavonoids, which confer its high antioxidant capacity, muruci is considered a functional food (Barreto et al. 2009; Almeida et al. 2011; Maldini et al. 2011).
Given the economic and social importance of the cassava production chain in the Northern region of Brazil, and the nutritional and functional characteristics of Brazil nut and Amazonian fruits, the objective of this study was to prepare snack bars using a multicomponent mixture of tapioca flour, Brazil
nut, and regional fruit pulps, and to evaluate their physical, physicochemical, microbiological, and sensory variables.
MATERIALS AND METHODS
The tapioca flour (type 1- granular subclass) and Brazil nut used to prepare the snack bars were purchased from local producers in the vicinity of Belém (state of Pará, northern Brazil). The other ingredients were obtained from commercial establishments.
In addition to the tapioca flour and Brazil nut, oat flakes (Quaker, Porto Alegre, Brazil) and quinoa grains (Mãe Terra, Osasco, Brazil) were also used. The following ingredients were used to prepare the agglutination syrup: refined sugar (União, Sertãozinho, Brazil) glucose syrup (Arcolor, São Paulo, Brazil), maltodextrin (Athletica Nutrition, Matão, Brazil), double distilled glycerin (Arcolor, São Paulo, Brazil), soy lecithin (GastronomyLab, Brasília, Brazil), palm oil (Agropalma, Belém, Brazil), and pulps of açaí (Iaçá, Castanhal, Brazil), cupuaçu, taperebá, and muruci (Camta, Tomé-Açu, Brazil), depending on the particular flavour of the snack bar.
Formulation and elaboration of snack bars
Preliminary tests were performed changing the ingredients’ concentration, searching for the best multicomponent snack bar formulation (Mourão et al. 2012; Khouryieh and Aramouni 2013; Mendes et al. 2013). The chosen formulation was determined considering the best technological interaction between the ingredients. The amount of the dry ingredients and agglutination syrup used in these tests ranged from 60-70% and 30-40%, respectively. The oat flakes, tapioca flour, and quinoa grains were previously dried in a forced convection/air circulation oven at 100 °C for 15 minutes.
The agglutination syrup was heated under and stirring in a stainless steel pan, and the total soluble solids content was measured using a digital ABBE refractometer (REFAB-1000S, BioBrix, São Paulo, Brazil) until reaching 85-89 °Brix. The dry ingredients were then added to the syrup (95 °C), and the mixture was compressed into a baking pan and allowed to stand at room temperature. After the cooling interval, the mixture was cut into bars of 0.065 m x 0.03 m x 0.015 m parallelepiped pieces and removed from the pan. The bars, each weighing about 0.025 kg, were individually wrapped in plastic wrap.
Sensory analysis
Sensory evaluation included the quantitative affective test for preference ordering and acceptance test. The study was approved by the Research Ethics Committee of Universidade da Amazônia (UNAMA) on December 16th, 2014 (protocol
A sensory test for preference ordering, considering the taste attribute, was used to determine which fruit pulp concentration (10, 15, or 20%) in the snack bars was preferred by the tasters. The test was performed with 80 untrained panelists from both sexes. The results obtained were analyzed using a Newell and MacFarlane table (Newell and MacFarlane 1987). After analyzing the results, the fruit pulp concentration preferred by the panelists (final formulation) for each flavour of the snack bars prepared was selected.
The final formulations, prepared after applying the affective test for preference ordering, were evaluated for acceptance using an unstructured 9-point hedonic scale (ranging from like extremely to dislike extremely) considering the attributes appearance, color, flavour, texture, and overall impression. One hundred and two untrained panelists from both sexes and aged between 18 and 63 years participated in these analyses.
The acceptance rate was calculated according to the method proposed by Teixeira et al. (1987) in which the highest score (9) corresponds to 100% of acceptance.These authors argue that for a product to be considered acceptable based on its sensory characteristics, it is necessary that its acceptance rate is greater than or equal to 70%.
Physical and physicochemical characterization
The physical and physicochemical variables of the final formulations, prepared after applying the affective test for preference ordering, were also evaluated. The color of the snack bars was determined using a spectrophotometer (Color Quest XE, Hunter Lab, Reston, USA). The color was determined using the CIELAB system (L*, a*, and b*) (Commission Internationale de L’Eclairage 1986), at 22 °C and 1-inch viewing distance using a 0.02 m path length glass cuvette. The results were the mean of 10 replicates.
Texture was determined using a texture analyzer (TA. XT Plus, Stable Micro Systems, Surrey, England). Shear force resistance was measured (expressed in Newton (N)) using a Warner Bratzler Blade Set (Heavy Duty Platform/ Blade Set with Knife) and the settings for cookies: pre-test speed of 0.0015 m s-1, test speed of 0.0020 m s-1, post-test
speed of 0.010 m s-1, and crosshead travel distance of 0,017
m; samples with a dimension of 0.04 m x 0.03 m x 0.015 m were evaluated. The results were the mean of 10 replicates.
As for the physicochemical characterization, moisture, proteins, lipids, and ashes were determined according to the official method of the Association of Official Analytical Chemists (2011). Fibers were analyzed using the acid detergent method of Goering and Van Soest (1970). The carbohydrate content was calculated by difference based on the values of protein, lipids, ash, and moisture. Energy value was calculated using the Atwater conversion factors: 4000 kcal
kg-1 for protein, 4000 kcal kg-1 for carbohydrate, and 9000
kcal kg-1 for lipids (United States Department of Agriculture
1963). All analyses were performed in triplicate.
Microbiological analysis
Microbiological analyses were performed according to the APHA (American Public Health Association) official methods (Vanderzant and Splittstoesser 1992), and the Brazilian technical regulation on sanitary microbiological standards for food (Brazil 2001), that defines the most probable number (MPN) analyses for total coliforms, fecal coliforms, yeast, and mold counting, and the determination of presence or absence of Salmonella spp. and Bacillus cereus.
Statistical analysis
All statistical analyses were performed using the Biostat version 5.0 Software package (Ayres et al. 2007). The data were subjected to analysis of variance (ANOVA) followed by the Tukey test (p<0.05).
RESULTS
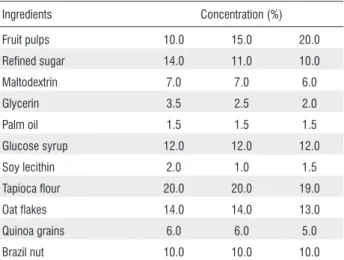
The final chosen formulation of the açaí, cupuaçu, taperebá, and muruci snack bars prepared with different fruit pulp concentrations was defined after the preliminary tests with different concentrations of the ingredients (Table 1). The açaí and cupuaçu bars containing 10% and 15% of pulp were preferred by the panelists, therefore these concentrations were chosen as the pulp percentage to be used in the final formulation of these bars. As there was no significant difference between the muruci and taperebá snack bars prepared with different pulp concentrations (10, 15, and 20%), the pulp concentration used in the final formulation of these bars was 15%.
Table 1. Formulation of snack bars prepared with different Amazonian fruit (açaí, cupuaçu, muruci, taperebá) pulp concentrations.
Ingredients Concentration (%)
Fruit pulps 10.0 15.0 20.0
Refined sugar 14.0 11.0 10.0
Maltodextrin 7.0 7.0 6.0
Glycerin 3.5 2.5 2.0
Palm oil 1.5 1.5 1.5
Glucose syrup 12.0 12.0 12.0
Soy lecithin 2.0 1.0 1.5
Tapioca flour 20.0 20.0 19.0
Oat flakes 14.0 14.0 13.0
Quinoa grains 6.0 6.0 5.0
The results of the affective test for preference ordering for the açaí, cupuaçu, muruci, and taperebá snack bars are presented in Table 2. According to the Newell and MacFarlane table, the critical value of absolute differences in the rank sums (ordering test) was 30 (p<0.05). This means that, if the difference in the rank sums is greater than or equal to the tabulated value, there is a significant difference between same flavour formulations, at the chosen significance level.
For açaí snack bars there was a significant difference between the pulp concentrations of 10 and 15% and 10 and 20%, but no significant difference between the bars containing 15 and 20%of pulp. For the cupuaçu snack bars, significant differences were observed between the pulp concentrations of 10 and 15% and 15 and 20%. For muruci and taperebá snack bars no difference was observed among the pulp concentrations tested.
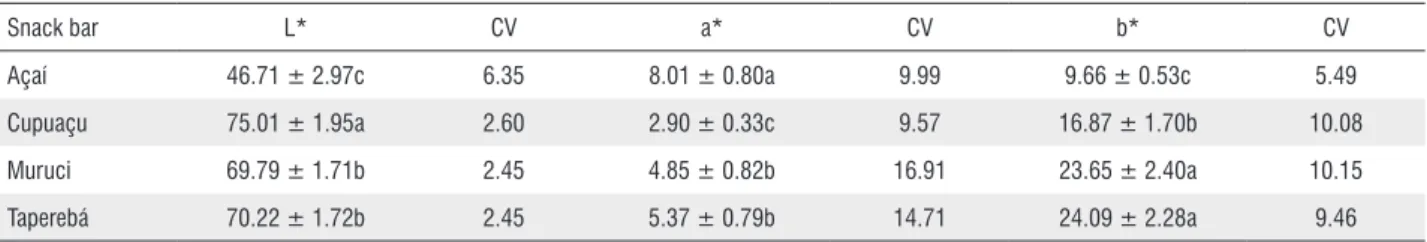
In the color analysis of the snack bars (Table 3) the higher the L* value, the lighter (less dark) the specimen. The cupuaçu, muruci, and taperebá bars were the lightest, with the highest L* values, and the açaí bars were the darkest. All samples had positive chromaticity values (a* and b*), and thus were in the red and yellow regions. There was no significant difference between the snack bars in terms of texture (Table 4).
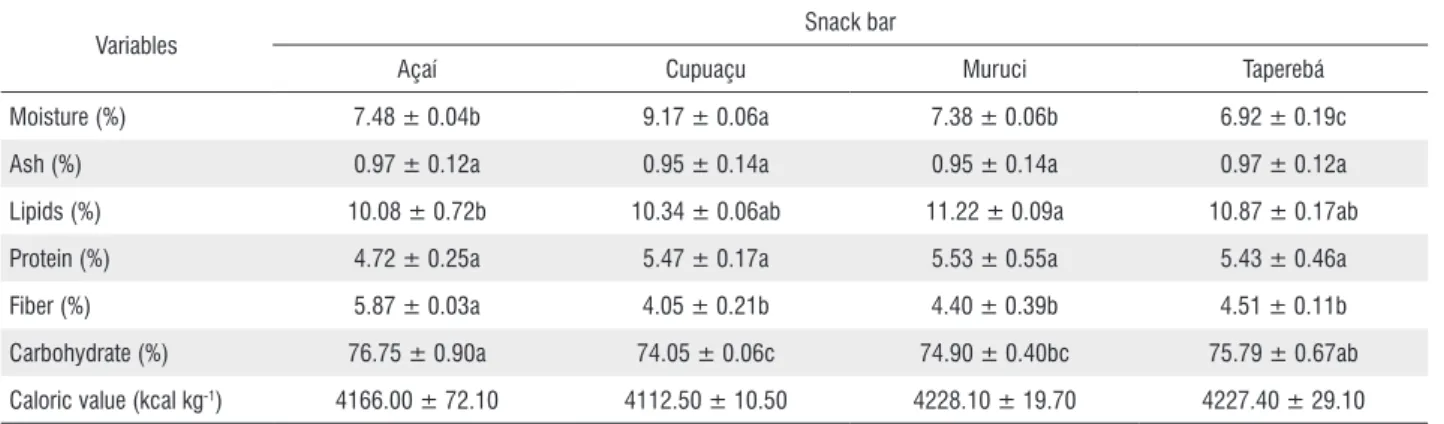
The physicochemical analysis of the snack bars (Table 5) showed that the moisture content varied between 7.38 and 9.17%. No significant difference was observed in the ash and
protein contents among the snack bars. Lipid, carbohydrate, and fiber contents were very similar, although there were significant differences between some formulations.
The mold and yeast analyses of açaí, cupuaçu, muruci and taperebá bars were 1.0 x 10², 1.5 x 10, 2.0 x 10 and 1.3 x 10
CFU, respectively. For coliforms at 35 °C, the results were 23 NMP/g (açaí and cupuaçu bars) and <3NMP/g (muruci and taperebá bars). For coliforms at 45 °C and Bacillus cereus, the results were <3NMP/g and <10-1 CFU, respectively, for
all bars analyzed. Salmonella spp. was not detected in any of the samples analyzed.
The scores obtained for the sensory attributes in the acceptance test indicated that the snack bars were generally well accepted by the panelists for all sensory attributes evaluated (Figure 1). The scores given by the panelists ranged between 6 and 8. The hedonic scale point value 6 corresponds to “like slightly” and the hedonic value 8 to “like extremely”. With regard to appearance and color, there were no significant differences between the four formulations. As for the attributes flavour, texture, and overall impression, there were significant differences between some formulations. Açaí and taperebá had significantly low scores for flavour. Taperebá had the lowest scores in all attributes, particularly so for flavour, texture and overall impression. The cupuaçu and muruci snack bars were the only ones with acceptance rate greater than 70% for all sensory attributes evaluated.
Table 2. Sensory test for preference ordering for snack bars prepared with different Amazonian fruit pulp concentrations.
Snack bar
Fruit pulp (%)
10 15 20
Açaí 182a 151b 147b
Cupuaçu 154b 184a 142b
Muruci 149a 163a 168a
Taperebá 154a 162a 165a
Values are the sum of the ranks assigned by all panelists to each sample. Values followed by the same letter in the line are not significantly different from one another according to the Newell and MacFarlane table (Newell and MacFarlane 1987).
Table 3. Color variables of snack bars prepared with different Amazonian fruit pulps.
Snack bar L* CV a* CV b* CV
Açaí 46.71 ± 2.97c 6.35 8.01 ± 0.80a 9.99 9.66 ± 0.53c 5.49
Cupuaçu 75.01 ± 1.95a 2.60 2.90 ± 0.33c 9.57 16.87 ± 1.70b 10.08
Muruci 69.79 ± 1.71b 2.45 4.85 ± 0.82b 16.91 23.65 ± 2.40a 10.15
Taperebá 70.22 ± 1.72b 2.45 5.37 ± 0.79b 14.71 24.09 ± 2.28a 9.46
CIELAB system. L* defines lightness, a* denotes the red/green value, b* the yellow/blue value (Commission Internationale de L’Eclairage 1986) and CV the coefficient of variation. Values are means followed by standard deviation. Means followed by the same letter in the column are not significantly different from one another by the Tukey test (p<0.05).
Table 4. Instrumental texture measurements for the snack bars prepared with different Amazonian fruit pulps.
Snack bar Shear force resistance (N)
Açaí 97.68 ± 7.44a
Cupuaçu 93.50 ± 18.99a
Muruci 108.85 ± 19.47a
Taperebá 97.98 ± 21.99a
Table 5. Physicochemical characterization of snack bars prepared with different Amazonian fruit pulps (wet base).
Variables Snack bar
Açaí Cupuaçu Muruci Taperebá
Moisture (%) 7.48 ± 0.04b 9.17 ± 0.06a 7.38 ± 0.06b 6.92 ± 0.19c
Ash (%) 0.97 ± 0.12a 0.95 ± 0.14a 0.95 ± 0.14a 0.97 ± 0.12a
Lipids (%) 10.08 ± 0.72b 10.34 ± 0.06ab 11.22 ± 0.09a 10.87 ± 0.17ab
Protein (%) 4.72 ± 0.25a 5.47 ± 0.17a 5.53 ± 0.55a 5.43 ± 0.46a
Fiber (%) 5.87 ± 0.03a 4.05 ± 0.21b 4.40 ± 0.39b 4.51 ± 0.11b
Carbohydrate (%) 76.75 ± 0.90a 74.05 ± 0.06c 74.90 ± 0.40bc 75.79 ± 0.67ab
Caloric value (kcal kg-1) 4166.00 ± 72.10 4112.50 ± 10.50 4228.10 ± 19.70 4227.40 ± 29.10
Values are the mean followed by the standard deviation. Means followed by the same letter on the line are not significantly different from one another by the Tukey test (p<0.05).
Figure 1.Acceptance rate of snack bars for the sensory attributes appearance, color, flavour, texture, and overall impression. Bars topped by the same letter are not significantly different according to the Tukey test (p<0.05).
DISCUSSION
The differences in L* values (lightness) were expected because the color of fruit pulps used in the snack bar formulations are different from one another. The significantly higher variable a* value for açaí is related to the higher concentration of red pigments in this formulation, while the variable b* values for muruci and taperebá bars showed higher concentration of yellow pigments. Differences in the structure, size, and shape of the ingredients, as well as their interaction, can explain the difference between the forces exerted by the texture analyzer on the samples, which resulted in the high observed standard deviations (Silva et al. 2011).
Determining food moisture is very important since water is one of the factors favoring the growth and proliferation of fungi, yeasts, and bacteria. The moisture values were in compliance with the Collegiate Directory Resolution No. 263 of September 22th 2005, which establishes the limit
of 15% moisture content for cereal-based food products (Brasil 2005). The difference between the ash, protein, lipid,
carbohydrate, and fiber contents among the snack bars can be attributed to the different chemical composition of the fruit pulps, and, in the case of the açaí bar, it can be due to the low percentage of this ingredient in the formulation. The caloric values measured can be explained by the concentration of ingredients rich in carbohydrates and lipids. According to the Collegiate Directory Resolution No. 359 of December 23th 2003, snack bars should not exceed 150 kcal per serving
(Brasil 2003). Therefore, each snack bar prepared (1 unit) in this study weighs approximately 0.025 kg, resulting in approximately 105 kcal per unit.
According to Brazilian legislation, the reference values for coliforms at 35 and 45 ºC, and for Bacillus cereus in food are, respectively, <5 x 10 NMP/g, and <5 x 10² CFU, while Salmonella spp. are to be completely absent (Brasil 2001). Therefore our snack bars were within the legal microbiological criteria, and were suitable for consumption. Although existing Brazilian technical regulations on microbiological standards in food do not require control of food spoilage fungus in snack bars, there should be close and regular monitoring to minimize risks to the health of consumers.
The low score observed for flavour of açaí snack bars in the acceptance tests, despite high scores in the other attributes, may be related to the eating habits of some panelists, who eat açaí pulp without adding any other ingredients (sugar, honey, etc.) that may alter the unique flavour of the fruit.
CONCLUSION
in sensory acceptance attributes, indicating good commercial potential. Açaí and taperebá bars scored below sensory acceptability in one or more attributes with the formulations tested in here.
ACKNOWLEDGEMENTS
The authors are grateful to the Conselho Nacional de Desenvolvimento Científico e Tecnológico (CNPq - Brasil) for financial support (process number 407764/2013-5).
REFERENCES
Almeida, M.M.B.; Sousa, P.H.M.; Arriaga, A.M.C.; Prado, G.M.; Magalhães, C.E.C.; Maia, G.A.; Lemos, T.L.G. 2011. Bioactive compounds and antioxidante activity of fresh exotic fruits from
northeastern Brazil. Food Research International, 44: 2155-2159.
Alves, R.; Modesto Júnior, M.S. 2012. Custo e rentabilidade do processamento de farinha de tapioca no distrito de Americano,
município de Santa Isabel, Pará. Amazônia: Ciência &
Desenvolvimento, 15: 91-102.
Association of Official Analytical Chemists. 2011. Official methods of
analysis of the Association of Official Analytical Chemists. AOAC International, Gaithersburg, 2590p.
Ayres, M.; Ayres Júnior, M.; Ayres, D.L.; Santos, A. 2007. Bioestat
-Aplicações estatísticas nas áreas das ciências biomédicas. UFPA, Belém, 324p.
Barbosa, P.O.; Pala, D.; Silva, C.T.; Souza, M.O.; Amaral, J.F.; Vieira, R.A.L.; Folly, G.A.F.; Volp, A.C.P.; Freitas, R.N. 2016. Açai (Euterpe oleracea Mart.) pulp dietary intake improves cellular antioxidant enzymes and biomarkers of serum in healthy women.
Nutrition, 32: 674-680.
Barreto, G.P.M.; Benassi, M.T.; Mercadante, A.Z. 2009. Bioactive compounds from several tropical fruits and correlation by
multivariate analysis to free radical scavenger activity. Journal of
the Brazilian Chemical Society, 20: 1856–1861.
Barros, L.; Calhelha, R.C.; Queiroz, M.J.R.P.; Santos-Buelga, C.; Santos, E.A.; Regis, W.C.B.; Ferreira, I.C.F.R. 2015. The
powerful in vitro bioactivity of Euterpe oleracea Mart. seeds and
related phenolic compounds. Industrial Crops and Products, 76:
318–322.
Bonomo, L.F.; Silva, D.N.; Boasquivis, P.F.; Paiva, F.A.; Guerra,
J.F.; Martins, T.A.; et al. 2014. Açaí (Euterpe oleracea Mart.)
modulates oxidative stress resistance in Caenorhabditis elegans by
direct and indirect mechanisms. PLoS ONE, 9: e89933.
Brasil, 2001. Resolução-RDC nº 12, 02 de janeiro de 2001. Regulamento técnico sobre padrões microbiológicos para alimentos. (www.anvisa.gov.br). Accessed on 17/08/2015. Brasil, 2003. Resolução-RDC nº 359, 23 de dezembro de 2003.
Regulamento técnico de porções de alimentos embalados para fins de rotulagem nutricional (www.anvisa.gov.br). Accessed on 17/08/2015.
Brasil, 2005. Resolução-RDC nº 263, 22 de setembro de 2005. Regulamento técnico para produtos de cereais, amidos, farinhas e farelos (www.anvisa.gov.br). Accessed on 17/08/2015.
Brasil. 2015. Alimentos regionais brasileiros. 2da ed. Ministério da
Saúde, Brasília. 484p.
Chisté, R.C.; Silva, P.A.; Lopes, A.S.; Pena, R.S. 2012. Sorption
isotherms of tapioca flour. International Journal of Food Science
and Technology, 47: 870–874.
Commission Internationale de L’Eclairage. 1986. Colorimetry. Second
Edition. 3ra ed. Commission Internationale de L’Eclairage, Vienna, 72p.
Colpo, E.; Vilanova, C.D.D.A.; Reetz, L.G.B.; Duarte, M.M.M.F.;
Farias, I.L.G.; Meinerz, D.F. et al. 2014. Brazilian nut
consumption by healthy volunteers improves inflammatory
parameters. Nutrition, 30: 459-465.
Darnet, S.; Serra, J.L.; Rodrigues, A.M.C.; Silva, L.H.M. 2011. A high-performance liquid chromatography method to measure
tocopherols in assai pulp (Euterpe oleracea). Food Research
International, 44: 2107-2111.
Freitas, G.C.; Mattietto, R.A. 2013. Ideal sweetness of mixed juices
from Amazon fruit. Ciência e Tecnologia de Alimentos, 33: 148-154.
Freitas, G.C.; Moretti, R.H. 2006. Caracterização e avaliação sensorial de barra de cereais funcional de alto teor proteico e
vitamínico. Ciência e Tecnologia de Alimentos, 26: 318- 324.
Goering, H.K.; Van Soest, P.J. 1970. Forage fiber analysis (apparatus,
reagents, procedures and some applications). Agricultural Research Service, Washington, 379p.
Gordon, A.; Jungfer, E.; Silva, B.A.; Maia, J.G.S.; Marx, F. 2011. Phenolic constituents and antioxidante capacity of
four underutilized fruits from the Amazon region. Journal of
Agricultural and Food Chemistry, 59: 7688–7699.
Jayasinghe, S.B.; Caruso, J.A. 2011. Investigation of Se-containing
proteins in Bertholletia excelsa H.B.K. (Brazil nuts) by ICPMS,
MALDI-MS and LC–ESI-MS methods. International Journal
of Mass Spectrometry, 307: 16-25.
John, J.A.; Shahidi, F. 2010. Phenolic compounds and antioxidant
activity of Brazil nut (Bertholletia excelsa). Journal of Functional
Foods, 2: 196-209.
Khouryieh, H.; Aramouni, F. 2013. Effect of flaxseed flour incorporation on the physical properties and consumer
acceptability of cereal bars. Food Science and Technology
International, 19: 549-556.
Maldini, M.; Montoro, P.; Pizza, C. 2011. Phenolic compounds
from Byrsonima crassifolia L. bark: Phytochemical investigation
and quantitative analysis by LC-ESI MS/MS. Journal of Pharmaceutical and Biomedical Analysis, 56: 1-6.
Mendes, N.S.R.; Gomes-Ruffi, C.R.; Lage, M.E.; Becker, F.S.; Melo, A.A.M.; Silva, F.A.; Damiani, C. 2013. Oxidative stability of cereal bars made with fruit peels and baru nuts packaged in different
types of packaging.Food Science Technology, 33: 730-736.
Milde, L.B.; Ramallo, L.A.; Puppo, M.C. 2010. Gluten-free bread
based on tapioca starch: texture and sensory studies. Food
Bioprocess Technology, 5: 888-896.
Mourão, L.H.E.; Pontes, D.F.; Rodrigues, M.C.P.; Brazil, I.M.; Cavalcante, M.T.B. 2012. Avaliação de barras de cereais de caju
Newell, G.J.; MacFarlane, J.D. 1987. Expanded tables for multiple
comparison procedures in the analysis of ranked data. Journal
of Food Science, 52: 1721-1725.
Pallavi, B.V.; Chetana, R.; Ravi, R.; Reddy, R.Y. 2013. Moisture sorption curves of fruit and nut cereal bar prepared with sugar
and sugar substitutes. Journal of Food Science and Technology,
50: 1-7.
Romualdo, G.R.; Fragoso, M.F.; Borguini, R.G.; Santiago, M.C.P.A.; Fernandes, A.A.H.; Barbisan, L.F. 2015. Protective
effects of spray-dried açaí (Euterpe oleracea Mart) fruit pulp
against initiation step of colon carcinogenesis. Food Research
International, 77: 432-440.
Salgado, H.; Lourenço, L.; Sousa, C.; Araújo, E. 2013. Dessert made from cupuassu fruit on eastern amazon: preparation and shelf
life. Journal of Food Processing and Preservation, 37: 391-398.
Schamne, C.; Dutcosky, S.D.; Demiate, I.M. 2010. Obtention
and characterization of gluten-free baked products. Ciência e
Tecnologia de Alimentos, 30: 741-750.
Silva, F.D.; Pante, C.F.; Prudêncio, S.H.; Ribeiro, A.B. 2011. Elaboração de uma barra de cereal de quinoa e suas propriedades
sensoriais e nutricionais. Alimentos e Nutrição, 22: 63-69.
Silva, P.A.; Cunha, R.L.; Lopes, A.S; Pena, R.S. 2013. Caracterização
de farinhas de tapioca produzidas no estado do Pará. Ciência
Rural, 43: 185-191.
Souza, V.R.; Pereira, P.A.P.; Queiroz, F.; Borges, S.V.; Carneiro, J.D.S. 2012. Determination of bioactive compounds, antioxidant activity and chemical composition of Cerrado Brazilian fruits.
Food Chemistry, 134: 381-386.
Stockler-Pinto, M.B.; Mafra, D.; Farage, N.E.; Boaventura, G.T.; Cozzolino, S.M. 2010. Effect of Brazil nut supplementation on the blood levels of selenium and glutathione peroxidase in
hemodialysis patients. Nutrition, 26: 1065-1069.
Teixeira, E.; Meinert, E.M.; Barbetta, P.A. 1987. Análise sensorial de
alimentos. Editora da UFSC, Florianópolis, 180p.
United States Department of Agriculture. 1963. Composition of
foods. Agricultural Research Center Service, Washington, 190p.
Vanderzant, T.; Splittstoesser, E.F. 1992. Compendium of methods for
the microbiological examination of foods. American Public Health Association, Washington, 1219p.
Wycoff, W.; Luo, R.; Schauss, A.G.; Neal-Kababick, J.; Sabaa-Srur, A.U.O.; Maia, J.G.S.; Tran, K.; Richards, K.M.; Smith, R.E. 2015. Chemical and nutritional analysis of seeds from purple
and white (Euterpe oleracea Mart.). Journal of Food Composition
and Analysis, 41: 181–187.