Food Science and Technology
DOI:
D httpsI://doi.org/10.1590/fst.33817
OSSN 1678-457X (Dnline)
1 Introduction
Numerous dissolved substances are found in the hydrophilic phase of milk, including those which present antioxidant activity, a property of milk which has been investigated in recent years (Baghbadorani et al., 2017; Zulueta et al., 2009; Havemose et al., 2006). Antioxidants found in or added to milk may diminish or even inhibit the oxidation of lipid compounds, which occurs as a result of exposure to light, heat, contamination by metal ions or the activity of pro-oxidative enzymes. As a consequence, these antioxidants prevent lipid oxidation, improving the quality and shelf life of these products. Fat-soluble substances such as vitamin E also exhibit antioxidant activity, but their contribution to overall antioxidant activity is small (Zulueta et al., 2009).
Furthermore, the antioxidants found in milk strengthen defenses against oxidative stress in those who ingest it, as has already been observed in rats (Bay et al., 1999; Zommara et al., 1998). Similarly, antioxidants may decrease the incidence of cancer and degenerative and inflammatory diseases in humans. The addition of antioxidants to milk may further assist in human protection against oxidative stress. Considering that milk composition varies according to several factors (among them, the animals’ feed), adding natural products with beneficial
properties such as antioxidant activity to the diet of ruminants can positively contribute to the health of the animal producing the milk as well as those consuming the product.
Propolis extracts are among the natural antioxidants already studied which can be used as natural food additives (Reis et al., 2017; Cottica et al., 2015a; Bodini et al., 2013). Propolis is a resinous mixture of plant origin that is produced by honeybees which has a complex chemical composition (Silva-Carvalho et al., 2015; Moţ et al., 2010). Bees are highly selective when choosing plant substances to produce propolis, which is a strong antioxidant and protects the hive against invaders such as bacteria and fungi. On other words, the bees extract the substances with antioxidant activity directly from the plants. These are mostly phenolic compounds, principally flavonoids. Propolis also has other features that are beneficial to human health, such as anti-inflammatory, antifungal (Ali et al., 2014), and anticancer activity. For this reason, its chemical composition and properties have been extensively studied (Kunrath et al., 2017; Cottica et al., 2015b; Dalben-Dota et al., 2010; Marcucci et al., 2008; Dliveira et al., 2006).
Antioxidant activity and lipid oxidation in milk from cows with soybean oil and
propolis extract added to their feed
Solange Maria CDTTOCA1,2*, Daieni Alves Vieira AMADD1, Silvia Cristina de AGUOAR3, Joana Schuelter BDEONG2, Selma Lucia FRANCD4, Lucia Maria ZEDULA3, Jesuí Vergílio VOSENTAONER2
Received 16 Oct., 2017 Accepted 10 April, 2018
1 Universidade Tecnológica Federal do Paraná - UTFPR, Toledo, PR, Brasil
2 Departmento de Química, Universidade Estadual de Maringá – UEM, Maringá, PR, Brasil 3 Departamento de Produção Animal, Universidade Estadual de Maringá – UEM, Maringá, PR, Brasil 4 Departamento de Farmácia, Universidade Estadual de Maringá – UEM, Maringá, PR, Brasil *Corresponding authorI: [email protected]
Abstract
The presence of PUFA (polyunsaturated fatty acids) in cow milk, including conjugated linoleic acids (CLA) isomers, makes milk susceptible to lipid oxidation, and may lead to the formation of volatile products responsible for a rancid smell. Consequently, including natural antioxidants in the diet of dairy cattle can assist in preventing lipid oxidation. On this study, soybean oil (a source of PUFA) and different ethanolic extracts of Brazilian propolis were included in the cows’ feed, and the antioxidant activity and lipid oxidation of the animals’ milk was assessed. Antioxidant activity was analyzed using the DPPH method, potassium ferricyanide reduction and chelating ability. Total phenolic compounds and flavonoids were also determined. Lipid oxidation was assessed by determining conjugated dienes and the production of aldehydes (propanal, pentanal, hexanal and octanal). Oncreased antioxidant activity was seen in the samples of milk from cows receiving propolis. Similarly, the addition of ethanolic extract of propolis to the diet of dairy cattle increased milk protection for two treatments with propolis against lipid oxidation in terms of production of propanal and hexanal. These results confirm the positive effect of applying this natural additive to the diet of lactating cows, improving the nutritional quality of the milk produced.
Keywords: natural additive; dairy product; phenolic compounds; fatty acids; aldehydes.
The objective of this study was to increase antioxidant activity and protection against lipid oxidation in cow milk by adding ethanolic extracts of propolis to the animals’ diet.
2 Materials and methods 2.1 Sampling and treatments
The experiment was carried out using four primiparous Holstein cows with 147 days in milk and an average body weight (BW) of 550 ± 34.16 kg. Cows were milked twice daily at 06I:00 h and 15I:00 h, and milk yield was recorded daily. The cows were cared for according to the guidelines of the Committee for the Ethical Care and Use of Animals in research of the Universidade Estadual de Maringá (no. 027/2011) and were subjected to the experimental treatments in a 4 × 4 Latin square design. The total mixed ration or basal diet was fed twice daily (08I:00 h and 16I:00 h) and consisted of 591.9 g/kg corn silage and 408.1 g/kg concentrate [dry matter (DM) basis] (Aguiar et al., 2014).
The 4 treatments used in the experiment wereI:
• ControlI: basal diet;
• Treatment 1I: basal diet + excipient + propolis extract B1;
• Treatment 2I: basal diet + excipient + propolis extract C3;
• Treatment 3I: basal diet + excipient + propolis extract C1.
Propolis samples were obtained from the apiary of the Experimental Farm of Oguatemi (FEO), belonging to the Universidade Estadual de Maringá, Paraná State, Brazil. The apiary is located within a reserve of eucalyptus plants (Eucalyptus sp.) surrounded by native forest and the presence of alecrim-do-campo (Baccharis dracunculifolia). The product-based propolis - PBP (excipient plus propolis extract) is protected by the intellectual property application under no. 0605768-3 in Brazil. The propolis extracts B1, C3 and C1 were obtained at a concentration of propolis ranging from 5.0 to 30.0 g diluted in 100 mL of a water–alcohol solution ranging from 60.0 to 93.8 mL of alcoholby turbo extraction, for 15 min. The extracts were filtered under vacuum, after which the alcohol was removed in a rotaryevaporator (model RT 210, Büchi Laboratory Equipment, Flawil, St. Gallen, Switzerland). Subsequently, the extracts were spray dried in a nebulizer (MSD 1.0, Labmaq, Ribeirão Preto, SP, Brazil) with a capacity of 1 L/h and an inlet temperature of 100 °C. The PBP powder fed to the animals contained the dried propolis extracts and an excipient (i.e., ground corn and soybean meal). The excipient was used to add volume to the propolis extract and facilitate feeding.
To analyze antioxidant activity, the chemical composition of antioxidants and lipid oxidation were sampled from milk taken from all animals in two milkings per day (morning and afternoon), totaling two samples/animal/period on the 17th and 18th days of each period. All milk samples were placed in plastic bottles and frozen at -10 °C for posterior analysis.
2.2 Preparation of extracts for antioxidant analysis
To analyze antioxidant activity and chemical composition of the different treatments, the methanolic extracts of these products were prepared using magnetic stirring in methanol
at a 1I:10 ratio (m/v) for 5 hours, during which time they were protected from light. After filtering, the solvent was removed in a rotating evaporator under reduced pressure at 40 °C.
The milk samples were prepared for analysis of antioxidant activity (reduction power and chelating ability) and chemical composition (total phenolics and flavonoid content) according to Zulueta et al. (2009) by precipitating the milk proteins with trichloroacetic acid (TCA) 20%, in a 1I:1 ratio (v/v) of milk and TCA.
2.3 Analysis of antioxidants
2.3.1 DPPH radical scavenging activity
The free radical scavenging activity was measured using DPPH• as already described (Bondet et al., 1997) with some
modifications. Briefly, various volumes of PBP or propolis extract solutions (2.0 mg mL-1) were added to 2.0 mL of DPPH• methanolic
solution (0.1192 mmol L-1) and maintained in the dark for
30 min at room temperature. Then, absorbance was measured at 517 nm. Methanol was used instead of propolis extract solutions as a control and Trolox was used as a positive control. The results were expressed by EC50 value (half maximal effective concentration), which determines the extract concentration (μg mL- 1) that provides 50% inhibition; the lower its value is,
the greater the efficiency of the antioxidant. The scavenging capacity of the DPPH radical was calculated with Equation 1 (percent inhibition of the DPPH radical).
(
)
100
⋅
⋅ −
⋅= DPPH sample X
DPPH
ABS ABS
% of Inhibition DPPH
ABS
(1)
Results also were expressed as Antioxidant Activity Ondex (AAO) (Scherer & Godoy, 2009) that evaluates antioxidant efficiency in plant extracts considering DPPH concentration and values for OC50.
2.3.2 Ferric Reducing Ability Power (FRAP)
The FRAP was determined as previously described (Benzie & Strain, 1996) with modifications. The absorbance at 593 nm was read using a spectrophotometer (Cary 50 – Varian) for 3.0 mL of a freshly prepared Fe3+–TPTZ (tripyridyltriazine) complex
solution pre-incubated at 37 °C. Different concentrations of 100 μL of propolis extract solutions were added to cuvettes with 300 μL of distilled water and 3.0 mL of Fe3+–TPTZ complex,
totaling 1I:34 dilution. The mixtures were homogenized and incubated at 37 °C for 30 min before absorbance reading at 593 nm. All treatments were run in triplicate and Trolox™ was used as a positive control. The potential of the antioxidants in the PBP and propolis extract to reduce Fe3+ to Fe2+ was expressed
in μmol Fe2+ g-1 of propolis extract using a calibration curve of
FeSD4
.7H
2D (0-2000 μmol L -1).
2.3.3 Potassium ferricyanide reducing power (FER)
water) or 1.0 mL of the supernatant extracted from milk were mixed with 2.5 mL of phosphate buffer solution (50 mmol L1,
pH 7.0) and an equal volume potassium ferricyanide solution 1%. After 20 minutes in a warming bath at 50 °C, 2.5 mL of trichloroacetic acid solution 10% was added, and the sample was centrifuged for 10 minutes. The supernatant resulting from centrifugation (2.5 mL) was diluted with 2.5 mL of distilled water and then added to 0.5 mL FeCl3 0.1% solution, and absorbance
at 700 nm was immediately read.
The results were expressed as mg of gallic acid equivalent (GAE) L-1 for the milk samples, in mg GAE g-1 extract for the
propolis extracts, and in mg EAG 100 g-1 of the sample on a
dry basis for samples of PBP, and the same were obtained by calibration curves with gallic acid (0-60 mg L- 1) according to
the absorbance range observed.
2.3.4 Chelating Ability (CA)
Analysis of antioxidant activity by measuring chelating ability was conducted according to Lue et al. (2010). The solutions for extracts of PBP and propolis were prepared in the concentration range of 0.5 to 1.0 mg mL-1 in methanol. Next, 0.7 mL of the
milk serum and 3.0 mL of distilled water were added to a test tube, or 3.7 mL of the PBP or propolis extract solution, with 0.1 mL of FeCl2 2.0 mmol L-1, and the absorbance reading was
done at 562 nm. Subsequently, 0.2 mL of ferrozine 5.0 mmol L-1 was added, and after 10 minutes of rest, absorbance was
measured at 562 nm.
As a positive control, a solution of Trolox® at 25 µmol L-1
was used. The inhibition percentage of ferrozine-Fe (OO) complex formation was calculated by Equation 2I:
( )
blank 1 0
blank
A A A
% chelating ability 1 00
A
− −
= x (2)
where Ablank represents the initial absorbance of the ferrozine-Fe(OO)
complex with 3.7 mL of distilled water, A0 represents the absorbance of the sample solution, and A1 represents the absorbance of the sample in the presence of ferrozine.
2.4 Total Phenolic Compounds (TPC)
The total level of phenolic compounds was determined using gallic acid as a standard by the Folin-Ciocalteu method (Singleton & Rossi, 1965) with some modifications. Methanolic solutions of propolis extracts or PBP (2.5 mg mL-1) were prepared and 250 μL
of these solutions or milk extracts or standard solutions of gallic acid or methanol as blank were added into separate test tubes. The sample absorbance was read against the blank at 725 nm using a spectrophotometer (Cary 50 – Varian). The results were expressed as mg L-1 of gallic acid equivalents (GAE) for milk,
mg GAE g-1 of extract for propolis extracts, and mg GAE 100 g-1
of the sample on a dry basis for samples of PBP. The analyses were done in triplicate.
2.5 Flavonoid Content (FLA)
The level of flavonoids was determined according to the methodology described by Woisky & Salatino (1998) with modifications. Methanolic solutions of propolis extract or PBP (2.5 mg mL-1) were prepared and 500 μL of this solution or milk
extract or quercetin standard solutions using methanol as a blank were added to separate test tubes. The absorbance was read at 425 nm using a spectrophotometer (Cary 50 – Varian) at room temperature. The results were expressed as mg L-1 of quercetin
equivalent (QE) for milk, mg QE g-1 of extract for the propolis
extracts, and mg QE 100 g-1 of the sample on a dry basis for samples
of the PBP. The analyses were done in triplicate.
2.6 Lipid oxidation
2.6.1 Conjugated dienes (CD)
The analysis of conjugated dienes in milk samples was conducted after 0, 3, 6 and 10 days of light-protected storage at 50 °C, as described by Kiokias et al. (2006), with some modifications. The CD concentration was calculated using the molar ratio of linoleic acid (ɛ = 26000) absorption and its molar mass (280 g mol -1), and
values were expressed in mg g -1 lipids.
2.6.2 Aldehydes
To test the formation of aldehydes (propanal, pentanal, hexanal, and octanal), 10 grams of the sample was sealed in 20 mL vials and stored at 50 °C (protected from light) for 0, 3, 6, and 10 days. After the storage period the samples were stirred and brought to 70 °C for 7 minutes and the headspace was analyzed according to Fritsch & Gale (1977), with modifications, with a 10 mL syringe at 60 °C in a Thermo Trace model gas chromatograph with an automatic Triplus gun equipped with a flame ionization detector and a CP-Sil 88 fused silica capillary column (100 m, 0.25 mm, and 0.25 μm of cyanopropyl polysiloxane). The volatile compounds were inserted into the input port of the gas chromatograph in splitless mode for 1 minute at 200 °C, with a total analysis time of 27 minutes.
Sample injections were made with a volume of 1 mL. Peak areas were determined using ChromQuest 5.0, and aldehydes were identified by standard addition (spiking) (SOGMA-EUA). The aldehydes were quantified by using the calibration curve with standard addition in the sample. The standard solutions of the aldehydes used were prepared in hexane at a concentration of 1.0 mg mL -1 and the results were expressed as parts per million
(ppm).
2.7 Statistical analysis
On order to study lipid oxidation, the samples were split and analyzed according to split-plot factorial design with the treatment, period and animal on the main level, and time heat-induced oxidation on the secondary level. Statistical analysis was performed using Statistical Analysis Systems software (Sistemas de Análises Estatísticas, 2002) and analysis of variance (ANDVA) was used to determine if the factors and their interactions had a significant effect, with 95% confidence for the measured parameters. The mean values were compared using the Tukey test.
3 Results and discussion
3.1 Antioxidant activity and antioxidant compounds
propolis extracts. To analyze the antioxidant activity of the milk samples, different methodologies were tested, including DPPH•, FRAP, FER, and CA. Nevertheless, as we chose to work with a methodology for each active mechanism, the ones presenting the best results were CA and FER.
According to Karadag et al. (2009) is important to use different techniques to determine antioxidant activity because antioxidants have different action mechanisms and there is still no consensus among researchers on a single technique, standard, or form of expressing results. The chemical composition of the antioxidants, phenolic compounds, and flavonoids were determined for all the samples, milk, cattle feed, and propolis extracts.
The analyses of antioxidant activity for the propolis extracts are shown in Table 1. The propolis extract used in treatment 3 (P3) showed the highest antioxidant activity for all analysis techniques, as well as a higher content of total phenolic compounds, indicating their relationship with antioxidant activity, which has already been mentioned in the literature (Cottica et al., 2011).
Considering the proposal by Scherer & Godoy (2009) with respect to the index of antioxidant activity OAA (where OAA = [DPPH.]/(EC
50) in µg mL
-1), samples with
OAA values of <0.5 have low antioxidant activity, 0.5-1.0 indicates moderate activity, and 1.0-2.0 strong activity. Using this structure, for the concentrations of DPPH. solution used in the assays, only
propolis extract P3 showed strong antioxidant activity, and P2 was moderate, with OAA values of 1.02 and 0.70, respectively. Propolis extract P1 presented an OAA value below 0.50, consequently showing weak antioxidant activity by the DPPH method.
The flavonoid content of extract P3 was equal to that of the propolis extract used in treatment 2 (P2), to a 95% confidence
level. The results for antioxidant activity shown in Table 1 suggest that the antioxidants present in the extracts exhibit both action mechanisms for free radical capture as well as reducing power and chelating ability, with the exception of extract P2, where the chelating ability did not show the same intensity as the other analysis techniques. A similar proportion was observed among the results of for reducing power using FRAP and ferricyanide for extracts P1 and P3, the same was not true for extract P2, which for FER presented an intermediate value between P1 and P3, and for FRAP the results was closer to the P1 value.
Dn the other hand, the same pattern was not observed in analyzing the antioxidant activity of cattle feed with the propolis extracts used in the different treatments (Table 2).
Antioxidant activity was also higher in the DPPH technique for PBP3 compared with the other treatments, and all PBP samples exhibited weak antioxidant activity according to OAA for the DPPH method (Scherer & Godoy, 2009). However, for potassium ferricyanide reducing power and chelating ability, PBP1 showed higher values for antioxidant activity than the other treatments and the excipient. PBP1 also exhibited the highest content of total phenolic compounds (Table 2), which may be responsible for the antioxidant activity observed in PBP1 for power reduction mechanisms and chelating ability. Dn the other hand, higher flavonoid content was observed in PBP3, and may be responsible for the antioxidant activity of PBP3 in radical capture method (DPPH).
Comparing the values for antioxidant activity of the pure propolis extracts with the propolis-based products (propolis extracts + excipient), it was expected that PBP3 would show higher antioxidant activity values than the other samples for
Table 1. Antioxidant activity of pure propolis extracts (without excipient).
Propolis extract FER (mg GAE g- 1)
FRAP (μmol Fe(OO) g-1)
CA (%)#
EC50 DPPH (µg mL-1)
TPC (mg GAE g-1)
FLA (mg QE g-1)
P1 12.73 ± 0.42c 527.90 ± 0.43c 44.82 ± 1.06b 160.15 ± 3.46ª 48.70 ± 1.75c 9.89 ± 0.60b
P2 25.64 ± 0.31b 591.89 ± 0.29b 29.17 ± 0.84c 68.50 ± 0.56b 73.99 ± 3.43b 26.16 ± 1.01ª
P3 42.64 ± 0.34ª 1365.07 ± 1.67ª 87.77 ± 0.72ª 46.90 ± 1.40c 86.53 ± 2.65ª 23.94 ± 1.81ª
CV (%) 1.33 0.12 1.64 1.81 2.70 6.14
#Values obtained for an extract concentration of 1.0 mg mL-1. Average followed by different letters in the same column are statistically different by Tukey test (P < 0.05). P1 = propolis extract 1; P2 = propolis extract 2; P3 = propolis extract 3; CV = coefficient of variation; FER = reducing power by potassium ferricyanide on gallic acid equivalent (GAE); FRAP = reducing power by FRAP method; CA = chelating ability; EC50 DPPH = amount of antioxidant necessary to decrease the initial DPPH. Concentration by 50% (Efficient Concentration); TPC = total phenolic compounds on gallic acid equivalent (GAE); FLA = flavonoid content on quercetin equivalent (QE). Analyses were done in triplicate.
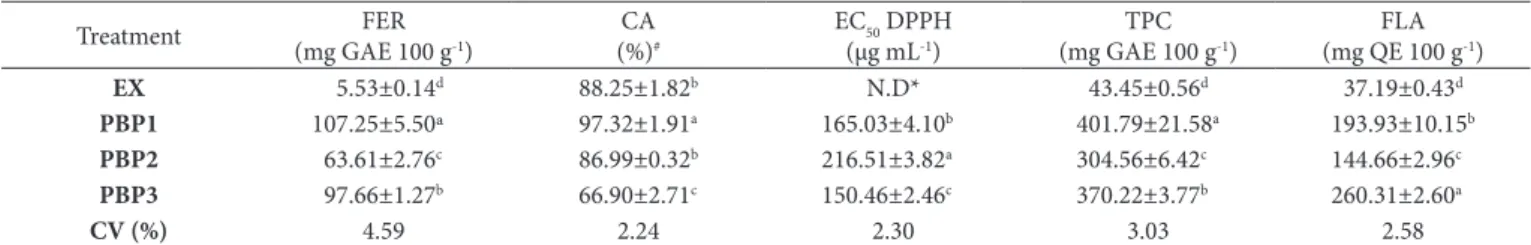
Table 2. Antioxidant activity and composition of different treatments used.
Treatment FER
(mg GAE 100 g-1)
CA (%)#
EC50 DPPH (µg mL-1)
TPC (mg GAE 100 g-1)
FLA (mg QE 100 g-1)
EX 5.53±0.14d 88.25±1.82b N.D* 43.45±0.56d 37.19±0.43d
PBP1 107.25±5.50ª 97.32±1.91a 165.03±4.10b 401.79±21.58a 193.93±10.15b
PBP2 63.61±2.76c 86.99±0.32b 216.51±3.82a 304.56±6.42c 144.66±2.96c
PBP3 97.66±1.27b 66.90±2.71c 150.46±2.46c 370.22±3.77b 260.31±2.60a
CV (%) 4.59 2.24 2.30 3.03 2.58
*N.D. = non determined value; #Values obtained for an extract concentration of 0.5mg mL-1. Average followed by different letters in the same column are statistically different by Tukey test (P < 0.05). EX = excipient; PBP1 = based-propolis product 1; PBP2 = based-propolis product 2; PBP3 = based-propolis product 3; CV = coefficient of variation; FER = reducing power by potassium ferricyanide on gallic acid equivalent (GAE); CA = chelating ability; EC50 DPPH = amount of antioxidant necessary to decrease the initial DPPH
. concentration
all techniques, which was not observed. The same occurred for the chemical composition of the antioxidants. These differences between pure propolis extracts and PBP may have occurred due to some synergistic or antagonistic effect between the antioxidants present in each of the different propolis extracts and the antioxidants or other components of the soybean and corn bran and soybean oil, which comprise the excipient.
All treatments with propolis extracts demonstrated an increase in antioxidant activity of the milk samples compared with the control milk (Table 3). The treatment resulting in increased antioxidant activity in milk by reduction power was MT3, while the treatments showing this result by chelating ability and radical capture were MT1 and MT3.
The extracts of propolis used in treatments 1 and 3 correspond to those prepared with lower alcohol content (propolis B1 and C1). This indicates that the percentage of ethanol used in the extraction of propolis affects the antioxidant compounds found therein, which presented different antioxidant behaviors, according to the environment in which they are found, whether in pure propolis extract, mixed with excipients (PBP), or in milk. According to Rashidi et al. (2016), antioxidants work synergistically in presence of others antioxidants.
As for the chemical composition of antioxidants, the milks from the propolis extract treatments showed higher flavonoid values compared to the control (MC), while only MT3 presented a significant difference from MC in relation to total phenolic compounds content. This indicates that the flavonoids present in different propolis extracts may be the main factor responsible for the antioxidant activity transferred to the milk.
3.2 Lipid oxidation products
Lipid oxidation can form toxic chemicals which create a rancid smell (off flavor), such as aldehydes, ketones, alcohols, carboxylic acids and hydrocarbons (Romeu-Nadal et al., 2007; Jamshidian et al., 2013). Among these hydrocarbons are conjugated dienes, which are the product of oxidation of polyunsaturated fat resulting from the reaction between oxygen and peroxides (3D
2) (Choe & Min, 2006). As published in previously work
(Aguiar et al., 2014), the milk analyzed exhibited the following polyunsaturated fatty acids (PUFA)I: linoleic acid (18I:2n-6), alpha-linolenic acid (18I:3n-3), di-homo-gamma-linolenic acid
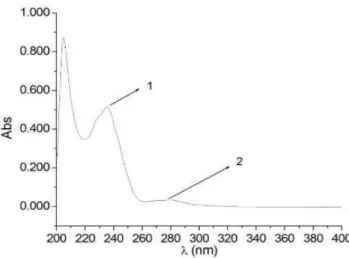
(20I:3n-6), and arachidonic acid (20I:4n-6). These fatty acids can be oxidized to form conjugated dienes responsible for absorbance at 232 nm (Figure 1).
Figure 1 shows a scan of wavelengths to confirm the absorbance of conjugated dienes (peak 1) in a milk sample oxidized at 50 °C for 10 days. Peak 2, around 270 nm, can correspond to the conjugated trienes or secondary products of the oxidation of the conjugated dienes such as α-diketones or unsaturated ketones (Luzia & Jorge, 2009).
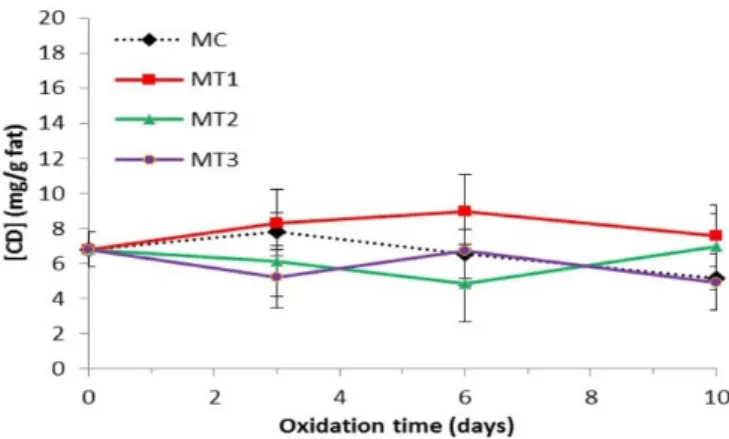
On addition to the PUFA mentioned here, in the analyzed milk samples we also found isomers of conjugated linoleic acid (CLA) (18I:2n(9c11t) and 18I:2n(10t12c)) (Aguiar et al., 2014). Since the CLA isomers are fatty acids with conjugated double bonds (in other words, they are conjugated dienes), analysis of absorbance at 232 nm may be slightly higher than the values caused by oxidation products. Consequently, the CLA content was subtracted from the total CD value of each milk sample (Figure 2), which permitted the observation of the conjugated dienes resulting exclusively from the milk oxidation test.
On the results obtained, there was no significant difference between treatments for CD content after 10 days of oxidation at 50 °C. Similarly, there was no interaction between storage time versus treatment. The CD values obtained (17-34 mmol/Kg of fat) were similar to those obtained by Boroski et al. (2012) for oxidation of dairy drinks enriched with linseed oil induced by heat. However, these values are considerably lower when oxidation is induced by light, which can reach approximately 350 mmol/kg of fat (Boroski et al., 2012).
Dn the other hand, there was a significant difference between the treatments and interaction between treatments versus oxidation time in producing some of the analyzed aldehydes during storage of milk at 50 °C for 10 days (Figure 3). Four aldehydes were selected to monitor lipid oxidationI: propanal, pentanal, hexanal and octanal, according to the availability of standards for these aldehydes. Aldehydes are secondary products of lipid oxidation which even in low concentrations can affect the
Figure 1. Milk absorbance spectrum at different wavelengths (λ) after
10 days of heating at 50 °C. Peaks 1 and 2 represent conjugated dienes and secondary oxidation products of conjugated dienes, respectively.
Table 3. Antioxidant activity and chemical composition of milks.
Treatment TPC (GAE mg L-1)
FLA (QE mg L-1)
FER (GAE mg L-1)
CA (%) MC 12.04±0.42bc 0.28±0.01d 1.16±0.03c 32.27±3.22c
MT1 11.36±0.47c 0.64±0.01ª 1.81±0.15b 51.45±3.69ª
MT2 12.99±0.93b 0.36±0.04c 1.65±0.09b 41.87±1.85b
MT3 15.40±0.50a 0.57±0.02b 2.44±0.09ª 57.40±5.56ª
CV (%) 4.88 4.49 5.84 5.81
sensory properties of food. The minimum concentration that is sensorially detectable (the threshold) is 1.6 ppm, 0.5 ppm, 0.15 ppm (Frankel, 2005) and 0.02 ppm (Marco et al., 2007) for propanal, pentanal, hexanal and octanal, respectively, in
different matrices. The samples analyzed did not reach threshold values after 10 days of oxidation at 50 °C, possibly due to their low lipid content.
According to Romeu-Nadal et al. (2007), propanal is a marker for the oxidation of n-3 fatty acids, whereas pentanal and hexanal are markers for the oxidation of n-6 fatty acids. As the initial amount of aldehydes in the samples was not equal (Figure 3), probably due to the different lipid composition of the milks (Aguiar et al., 2014), the difference in aldehyde content was determined at time zero and after 10 days of oxidation (ΔC = C10-C0, where C = aldehyde concentration in ppm, at 10 and 0 days of oxidation). Ot was observed that MT1 and MT2 presented ΔC of 0.24 and 0.36 ppm, while MC and MT3 exhibited ΔC of 0.63 and 0.67 ppm, respectively, for production of propanal, with significant difference between treatments and effect of interaction between treatments versus oxidation time (P< 0.05). The same behavior was observed in the inhibition of hexanal production, where MT1 and MT2 were seen to be more effective against lipid oxidation, with lower values for ΔC; a significant interaction was seen between storage time versus treatment for MC and MT3 (P< 0.05). For analyzing pentanal, there was a significant interaction between treatments and
Figure 2. Variation on conjugated dienes concentration from lipid
oxidation during storage of milk at 50 °C, where MC = control milk; MT1 = milk of treatment 1; MT2 = milk of treatment 2; MT3 = milk of treatment 3.
Figure 3. Change on concentration of a) hexanal, b) propanal, c) octanal and d) pentanal during milk storage at 50 °C, where MC = control milk;
oxidation time only for MT2 and MT3, while for octanal no treatment exhibited a significant difference or interaction effect.
The results showed that MT1 and MT2 presented greater protection against lipid oxidation related to the production of propanal and hexanal. This protection exhibited in MT1 may be related to the increased antioxidant activity observed in this sample when compared to MC. Although the MT3 milk exhibited antioxidant activity similar to MT1, its protection against lipid oxidation was not as efficient, possibly due to the nature of the antioxidant compounds present in the propolis extract used in this treatment.
4 Conclusions
The most appropriate techniques used to analyze antioxidant activity in the milk samples were FER, and CA, which showed an increase in antioxidant activity in the milks whose treatments contained propolis, especially samples for treatments MT1 and MT3. On addition, the flavonoid content in the milk also increased for all treatments, and the total phenolic compound content increased for the milk that underwent treatment with MT3. On contrast, MT1 and MT2 proved more efficient against lipid oxidation related to the production of propanal and hexanal.
Consequently, we can conclude that the addition of propolis to the diet of dairy cattle increased antioxidant activity, and may increase the protection of milk against lipid oxidation. Considering these parameters, the propolis extract present in milk MT1 proved to be most effective, leading to a product with better nutritional characteristics for the consumer.
Acknowledgements
The authors thank the Conselho Nacional de Desenvolvimento Científico e Tecnológico (CNPq, Brazil) and the Ministério da Agricultura, Pecuária e Abastecimento (MAPA, Brazil) for their financial support (CNPq/MAPA 578698/2008-0).
REFERENCES
Aguiar, S. C., Cottica, S. M., Boeing, J. S., Samensari, R. B., Santos, G. T., Visentainer, J. V., & Zeoula, L. M. (2014). Effect of feeding phenolic compounds from propolis extracts to dairy cows on milk production, milk fatty acid composition, and the antioxidant capacity of milk. Animal Feed Science and Technology, 193, 148-154. httpI:// dx.doi.org/10.1016/j.anifeedsci.2014.04.006.
Ali, A., Chow, W. L., Zahid, N., & Dng, M. K. (2014). Efficacy of propolis and cinnamon oil coating in controlling post-harvest anthracnose and quality of chilli (Capsicum annuum l.) during cold storage. Food and Bioprocess Technology, 7(9), 2742-2748. httpI://dx.doi. org/10.1007/s11947-013-1237-y.
Baghbadorani, S. T., Ehsani, M. R., Mirlohi, M., Ezzatpanah, H., Azadbakht, L., & Babashahi, M. (2017). Antioxidant capability of ultra-high temperature milk and ultra-high temperature soy milk and their fermented products determined by four distinct spectrophotometric methods. Advanced Biomedical Research, 6(1), 62. httpI://dx.doi.org/10.4103/2277-9175.207150. PMidI:28603703. Bay, B. H., Lee, Y. K., Tan, B. K. H., & Ling, E. A. (1999). Lipid peroxidative
stress and antioxidative enzymes in brains of milk-supplemented
rats. Neuroscience Letters, 277(2), 127-130. httpI://dx.doi.org/10.1016/ S0304-3940(99)00872-1. PMidI:10624826.
Benzie, O. F. F., & Strain, J. J. (1996). The ferric reducing ability of plasma (FRAP) as a measure of “antioxidant power”I: the FRAP assay. Analytical Biochemistry, 239(1), 70-76. httpI://dx.doi.org/10.1006/ abio.1996.0292. PMidI:8660627.
Bodini, R. B., Sobral, P. J. A., Favaro-Trindade, C. S., & Carvalho, R. A. (2013). Properties of gelatin-based films with added ethanol–propolis extract. Lebensmittel-Wissenschaft + Technologie, 51(1), 104-110. httpI://dx.doi.org/10.1016/j.lwt.2012.10.013.
Bondet, V., Brand-Williams, W., & Berset, C. (1997). Kinetics and mechanisms of antioxidant activity using the DPPH. free radical method. Lebensmittel-Wissenschaft + Technologie, 30(6), 609-615. httpI://dx.doi.org/10.1006/fstl.1997.0240.
Boroski, M., Giroux, H. J., Sabik, H., Petit, H. V., Visentainer, J. V., Matumoto-Pintro, P. T., & Britten, M. (2012). Use of oregano extract and oregano essential oil as antioxidants in functional dairy beverage formulations. Lebensmittel-Wissenschaft + Technologie, 47(1), 167-174. httpI://dx.doi.org/10.1016/j.lwt.2011.12.018.
Choe, E., & Min, D. B. (2006). Mechanisms and factors for edible oil oxidation. Comprehensive Reviews in Food Science and Food Safety, 5(4), 169-186. httpI://dx.doi.org/10.1111/j.1541-4337.2006.00009.x. Cottica, S. M., Sabik, H., Bélanger, D., Giroux, H. J., Visentainer, J. V., & Britten, M. (2015a). Use of propolis extracts as antioxidant in dairy beverages enriched with conjugated linoleic acid. European Food Research and Technology, 241(4), 543-551. httpI://dx.doi.org/10.1007/ s00217-015-2483-1.
Cottica, S. M., Sabik, H., Antoine, C., Fortin, J., Graveline, N., Visentainer, J. V., & Britten, M. (2015b). Characterization of Canadian propolis fractions obtained from two-step sequential extraction. LWT - Food Science and Technology, 60(1), 609-614. httpsI://doi.org/10.1016/j. lwt.2014.08.045.
Cottica, S. M., Sawaya, A. C. H. F., Eberlin, M. N., Franco, S. L., Zeoula, L. M., & Visentainer, V. V. (2011). Antioxidant activity and composition of propolis obtained by different methods of extraction. Journal of the Brazilian Chemical Society, 22(5), 929-935. httpI://dx.doi. org/10.1590/S0103-50532011000500016.
Dalben-Dota, K. F., Faria, M. G. O., Bruschi, M. L., Pelloso, S. M., Lopes-Consolaro, M. E., & Svidzinski, T. O. E. (2010). Antifungal activity of propolis extract against yeasts isolated from vaginal exudates. Journal of Alternative and Complementary Medicine, 16(3), 285-290. httpI:// dx.doi.org/10.1089/acm.2009.0281. PMidI:20192913.
Frankel, E. N. (2005). Lipid oxidation (2nd ed.). BridgwaterI: The Dily Press. httpI://dx.doi.org/10.1533/9780857097927.
Fritsch, C. W., & Gale, J. A. (1977). Hexanal as a measure of rancity in low fat foods. Journal of the American Chemical Society, 54, 225-228. Havemose, M. S., Weisbjerg, M. R., Bredie, W. L., Poulsen, H. D., &
Nielsen, J. H. (2006). Dxidative stability of milk influenced by fatty acids, antioxidants, and copper derived from feed. Journal of Dairy Science, 89(6), 1970-1980. httpI://dx.doi.org/10.3168/jds.S0022-0302(06)72264-0. PMidI:16702260.
Jamshidian, M., Tehrany, E. A., & Desobry, S. (2013). Antioxidants release from solvent-cast pla filmI: investigation of pla antioxidant-active packaging. Food and Bioprocess Technology, 6(6), 1450-1463. httpI://dx.doi.org/10.1007/s11947-012-0830-9.
Karadag, A., Dzcelik, B., & Saner, S. (2009). Review of methods to determine antioxidant capacities. Food Analytical Methods, 2(1), 41-60. httpI://dx.doi.org/10.1007/s12161-008-9067-7.
Physico-chemical characteristics of microencapsulated propolis co-product extract and its effect on storage stability of burger meat during storage at -15 °C. Lebensmittel-Wissenschaft + Technologie, 76, 306-313. httpI://dx.doi.org/10.1016/j.lwt.2016.05.033.
Romeu-Nadal, M., Chavez-Servin, J. L., Castellote, A. O., Rivero, M., & Lopez-Sabater, M. C. (2007). Dxidation stability of the lipid fraction in milk powder formulas. Food Chemistry, 100(2), 756-763. httpI:// dx.doi.org/10.1016/j.foodchem.2005.10.037.
Scherer, R., & Godoy, H. T. (2009). Antioxidant activity index (AAO) by the 2,2-diphenyl-1-picrylhydrazyl method. Food Chemistry, 112(3), 654-658. httpI://dx.doi.org/10.1016/j.foodchem.2008.06.026. Silva-Carvalho, R., Baltazar, F., & Almeida-Aguiar, C. (2015). PropolisI: a complex natural product with a plethora of biological activities that can be explored for drug development. Evidence-Based Complementary and Alternative Medicine : eCAM, 2015, 206439. httpI://dx.doi.org/10.1155/2015/20643.9. PMidI:26106433. Singleton, V. L., & Rossi, J. A. (1965). Colorimetric of total phenolics
with phosphomolybdic-phosphotungstic acid reagents. American Journal of Enology and Viticulture, 16, 144-146.
Sistemas de Análises Estatísticas – SAS. (2002). Sistemas de análises estatísticas. CaryI: SAS Onc.
Woisky, R. G., & Salatino, A. (1998). Analysis of propolisI: some parameters and procedures for chemical quality control. Journal of Apicultural Research, 37(2), 99-105. httpI://dx.doi.org/10.1080/0 0218839.1998.11100961.
Zhu, Q. Y., Hackman, R. M., Ensunsa, J. L., Holt, R. R., & Keen, C. L. (2002). Antioxidative activities of oolong tea. Journal of Agricultural and Food Chemistry, 50(23), 6929-6934. httpI://dx.doi.org/10.1021/ jf0206163. PMidI:12405799.
Zommara, M., Toubo, H., Sakono, M., & Omaizumi, K. (1998). Prevention of peroxidative stress in rats fed on a low vitamin E-containing diet by supplementing with a fermented bovine milk whey preparationI: effect of lactic acid and beta-lactoglobulin on the antiperoxidative action. Bioscience, Biotechnology, and Biochemistry, 62(4), 710-717. httpI://dx.doi.org/10.1271/bbb.62.710. PMidI:9614701.
Zulueta, A., Maurizi, A., Frígola, A., Esteve, J. M., Coli, R., & Burini, G. (2009). Antioxidant capacity of cow milk, whey and deproteinized milk. International Dairy Journal, 19(6-7), 380-385. httpI://dx.doi. org/10.1016/j.idairyj.2009.02.003.
deterioration of novel food emulsions. Food Biophysics, 1(3), 115-123. httpI://dx.doi.org/10.1007/s11483-006-9015-2.
Kunrath, C. A., Savoldi, D. C., Mileski, J. P. F., Novello, C. R., Alfaro, A. T., Marchi, J. F., & Tonial, O. B. (2017). Application and evaluation of propolis, the natural antioxidant in Otalian-type salami. Brazilian Journal of Food Technology, 20(0), 1-10. httpI://dx.doi.org/10.1590/1981-6723.3516.
Lue, B. M., Nielsen, N. S., Jacobsen, C., Hellgren, L., Guo, Z., & Xu, X. (2010). Antioxidant properties of modified rutin esters by DPPH, reducing power, iron chelation and human low density lipoprotein assays. Food Chemistry, 123(2), 221-230. httpI://dx.doi.org/10.1016/j. foodchem.2010.04.009.
Luzia, D. M. M., & Jorge, N. (2009). Antioxidant activity of lemon seed extract (Citrus limon) added to soybean oil in accelerated incubator-storage test. Quimica Nova, 32, 946-949. httpI://dx.doi. org/10.1590/S0100-40422009000400022.
Marco, A., Navarro, J. L., & Flores, M. (2007). Quantitation of selected odor-active constituents in dry fermented sausages prepared with different curing salts. Journal of Agricultural and Food Chemistry, 55(8), 3058-3065. httpI://dx.doi.org/10.1021/jf0631880. PMidI:17381109. Marcucci, M. C., Sawaya, A. C. H. F., Custodio, A. R., Paulino, N.,
& Eberlin, M. N. (2008). HPLC and ESO-MS typificationI: new approaches for natural products. On N. Drsolić & O. Basić (Drgs.), Scientific evidence of the use of propolis in ethnomedicine (pp. 33-54). KeralaI: Transworld Research Network.
Moţ, A. C., Soponar, F., & Sârbu, C. (2010). Multivariate analysis of reflectance spectra from propolisI: geographical variation in Romanian samples. Talanta, 81(3), 1010-1015. httpI://dx.doi.org/10.1016/j. talanta.2010.01.052. PMidI:20298886.
Dliveira, A. C. P., Shinobu, C. S., Longhini, R., Franco, S. L., & Svidzinski, T. O. E. (2006). Antifungal activity of propolis extract against yeasts isolated from onychomycosis lesions. Memorias do Instituto Oswaldo Cruz, 101(5), 493-497. httpI://dx.doi.org/10.1590/ S0074-02762006000500002. PMidI:17072451.
Rashidi, L., Gholami, Z., Nanvazadeh, S., & Shabani, Z. (2016). Rapid method for extracting and quantifying synthetic antioxidants in all edible fats and oils. Food Analytical Methods, 9(9), 2682-2690. httpI://dx.doi.org/10.1007/s12161-016-0443-4.