KEEPING TRACK OF SUSTAINABILITY PROGRESS -
BENCHMARKING INSIGHTS FROM INTERNATIONAL
INDEXES
Claudia Ogrean1 ABSTRACT
Accompanied by a plethora of controversies, sustainability – assumed and proclaimed by the Agenda 2030 (UN, 2016) as global concern and desideratum – has become a ubiquitous hot topic nowadays: both positive and negative references to it are made each day, emphasizing on the complexity and dy-namism of this ever emerging and never ending process. However, sustainability’s multiple facets and kinds of expression seem to be more visible at the lower levels of the global system, where the search for sustainability phenomenon – fuelled by the (media intermediated) positive interplays between the increased accountability of firms and the proliferation of highly informed customers – has led to the disruption of industries and ways of life. Thus, concepts and practices such as: sustainable travel, fashion, fisheries or consumption; green products, processes, buildings, or jobs; eco-friendly energy, materials, cars, or cities – have redefined industries and/or created new ones, while changing peoples’ lives. But: what is the aggregate effect of all these transformation, their cumulative impact?; what positive and/or negative spillovers have they generated and to whom? – these are the questions this paper ultimately aims to answer to. The main objective of the paper is to find out how are countries po-sitioning themselves against the requirements of global sustainability, and what is the measure of their real progress towards them. Based on the analysis of a series of internationally renowned reports and indexes – such as: The Global Sustainable Competitiveness Index (SolAbility, 2017), The Sustainable De-velopment Goals Index (Sustainable DeDe-velopment Solutions Network & the Bertelsmann Stiftung, 2018), and the Sustainable Society Index (Sustainable Society Foundation, 2016) – the paper will compare and contrast data and indicators across countries, in order to identify and benchmark the progress different groups of countries have made towards sustainability, as well as the main challenges ahead of them.
1. INTRODUCTION
Following the Millennium Development Goals, the 17 Sustainable Development
Goals (SDGs) of the 2030 Agenda for Sustainable Development have officially came
into force on 1 January 2016. The “17 Goals to transform our World” represent “a
call for action by all countries (…) to promote prosperity while protecting the
plan-et” and they refer to: (1) No poverty; (2) Zero hunger; (3) Good health &
well-be-ing; (4) Quality education; (5) Gender equality; (6) Clean water & sanitation; (7)
Affordable & clean energy; (8) Decent work & economic growth; (9) Industry,
inno-vation & infrastructure; (10) Reduced inequalities; (11) Sustainable cities &
com-munities; (12) Responsible consumption and production; (13) Climate action; (14)
Life below water; (15) Life on land; (16) Peace, justice & strong institutions; and
(17) Partnerships for the goals (UN, 2016).
Later on, the General Assembly has adopted (on 6 July 2017) the Resolution
con-taining “the global indicator framework for the SDGs and targets of the 2030
Agen-da for Sustainable Development”, which will be refined annually when necessary
(UN, 2017); at this point, the official list “includes 232 indicators on which general
agreement has been reached”. In the same time, a “dissemination platform of the
Global SDG Indicators Database” has been developed – in order to provide “access
to data compiled through the UN System in preparation for the
Secretary-Gener-al’s annual report on <<Progress towards the Sustainable Development Goals>>”
(https://unstats.un.org/sdgs/indicators/database/). Moreover, Sustainable
Devel-opment Goals Reports are annually released (UN, 2018a), as well as Reports of
the Secretary-General on the Progress towards the Sustainable Development Goals
(UN, 2018b), accompanied by Statistical Annexes (UN, 2018c).
But sustainability – and particularly its country-related perspective/dimension
is not a new topic; quite the opposite: a plethora of academics and/or different
organizations have had sustainability on the top of their agenda, trying to develop
different frameworks in order to properly capture and define the concept, to make
it operational at country level and to asses / measure the progress towards some
pre-determined goals/targets, both before (Moran, Wackernagel, Kitzes,
Goldfin-ger, Boutaud, 2008; Hák, Moldan, Dahl, 2012; WEF, 2014) and after (Strezov, Evans,
Evans, 2017; Schmidt-Traub, Kroll, Teksoz, Durand-Delacre, Sachs, 2017, Leal Filho
et al., 2018) the emergence of the SDGs.
The reminder of the paper is organized as follows: the second section is
dedi-cated to the analysis of the “oldest” index (whose development and publication
have started in 2006) – the Sustainable Society Index (SSI) – which is “
showing at
a glance the level of sustainability of a country” (Sustainable Society Foundation,
2017); the third section will address the “younger” (firstly developed in 2012)
Global Sustainable Competitiveness Index (GSCI) – which is “a measurement for
social, environmental and economic development. Measuring wealth, and
prosper-ity – inclusively” (SolAbilprosper-ity, 2017); the forth section will deal with the “youngest”
index (available since 2016) – the
SDG Index – which “provides a report card for
country performance on the historic Agenda 2030 and the SDGs” (Bertelsmann
Stiftung, Sustainable Development Solutions Network, 2018); then will follow the
conclusion and finally the bibliography.
2. THE SUSTAINABLE SOCIETY INDEX (SSI)
In order to address the question “How sustainable is your country?” in a
con-crete, measurable manner,
th
e Sustainable Society Foundation has developed a
composite tool – the Sustainable Society Index (SSI) – which it has been published
every two years since 2006. Based on the
Brundtland Report definition of
sustain-able development, SSI considers
that
“a sustainable society is a society: (a). that
meets the needs of the present generation; (b). that does not compromise the
ability of future generations to meet their own needs; (c). in which each human
being has the opportunity to develop itself in freedom, within a well-balanced
society and in harmony with its surroundings” (Sustainable Society Foundation,
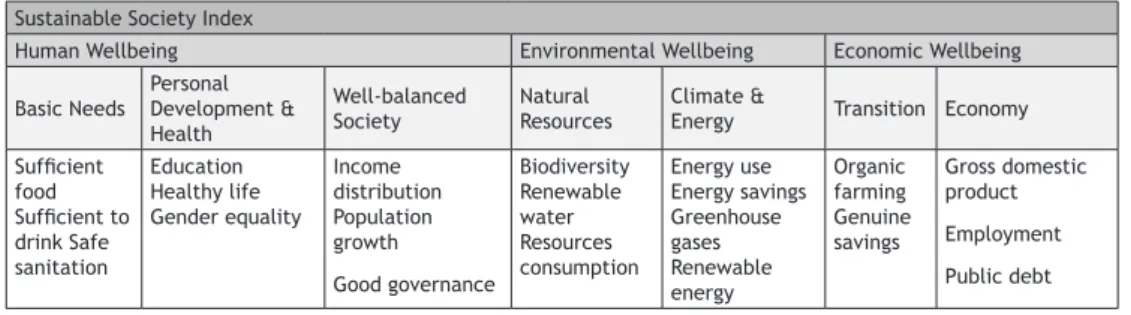
2017). The SSI Framework
(Table 1) gathers 21 indicators, grouped in 7 categories,
which form and define the 3 wellbeing dimensions of SSI: human, environmental,
and economic.
Table 1: SSI Framework (http://www.ssfindex.com/ssi/framework/)
Sustainable Society Index
Human Wellbeing Environmental Wellbeing Economic Wellbeing
Basic Needs Personal Development & Health
Well-balanced
As concerns the most recent SSI available (2016): (a). 154 countries have been
ranked on the three dimensions, based on a scale of 1-10 (10=sustainable, 1=not
sustainable); (b).
the scores of the indicators were aggregated into scores for the
three wellbeing dimensions; (c). the dimension levels have not been aggregated
“into one single figure for the overall index [...due to...] the negative correlation
between Human and Environmental Wellbeing” (Sustainable Society Foundation,
2017).
The analysis of the 2016 SSI reveals the following:
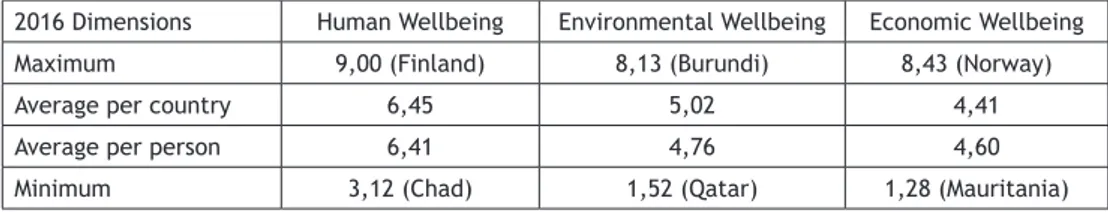
If considering the SSI Scores – by Dimensions (Table 2): Human Wellbeing (HB)
scores the best – in terms of both maximum and minimum; Environmental
Wellbe-ing (EB) scores the second in terms of minimum and the last in terms of maximum,
while Economic Wellbeing (EcW) scores the second in terms of maximum and the
last in terms of minimum. With averages (both per country and per person) above
6,4 (on the scale of 1-10), the human dimension of sustainability is far ahead of the
environmental dimension and especially of the economic one.
Table 2: SSI 2016 Scores – by Dimensions (http://www.ssfindex.com/data-all-countries/)
2016 Dimensions Human Wellbeing Environmental Wellbeing Economic Wellbeing
Maximum 9,00 (Finland) 8,13 (Burundi) 8,43 (Norway)
Average per country 6,45 5,02 4,41
Average per person 6,41 4,76 4,60
Minimum 3,12 (Chad) 1,52 (Qatar) 1,28 (Mauritania)
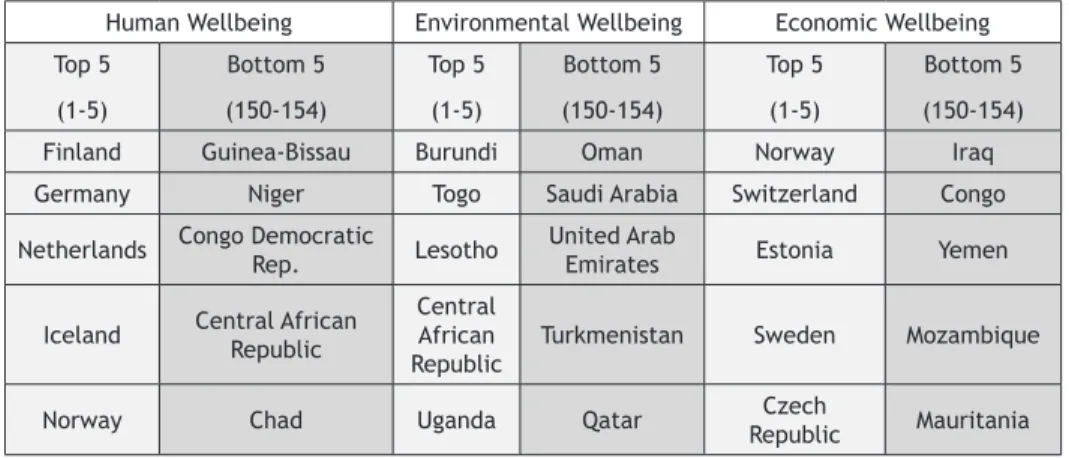
If considering the Top 5 and Bottom 5 countries, by Dimensions (Table 3): five high
income European countries make the Top 5 on the human and economic dimensions
of sustainability (only Norway being present in both of them, but in opposite
plac-es); with respect to the environmental dimension, Top 5 is occupied by five
Afri-can (four of them low income, and the fifth lower middle income) countries. The
Bottom 5 on the HW dimension is made by five African low income countries; four
Western Asia high income countries and a Central Asia upper middle income one
are making the Bottom 5 of EW, while the Bottom 5 of EcW is occupied by three
African countries (two of them with lower middle income, and the third one with
low income) and two (upper middle income and lower middle income respectively)
Asian countries. Central African Republic (the second country that appears twice),
scores the forth global in terms of EW and the penultimate global in terms of HW.
Table 3: SSI 2016 – Top 5 & Bottom 5 Countries, by Dimensions (http://www.ssfindex.com/results/ ranking-all-countries/)
Human Wellbeing Environmental Wellbeing Economic Wellbeing Top 5 (1-5) Bottom 5 (150-154) Top 5 (1-5) Bottom 5 (150-154) Top 5 (1-5) Bottom 5 (150-154)
Finland Guinea-Bissau Burundi Oman Norway Iraq
Germany Niger Togo Saudi Arabia Switzerland Congo
Netherlands Congo Democratic
Rep. Lesotho
United Arab
Emirates Estonia Yemen
Iceland Central African Republic
Central African
Republic Turkmenistan Sweden Mozambique
Norway Chad Uganda Qatar RepublicCzech Mauritania
3. THE GLOBAL SUSTAINABLE COMPETITIVENESS INDEX (GSCI)
Aiming “to measure sustainable success and competitiveness of nations that
integrate all three dimensions of sustainable development”, (SolAbility, 2017),
SolAbility has developed a comprehensive Global Sustainable Competitiveness
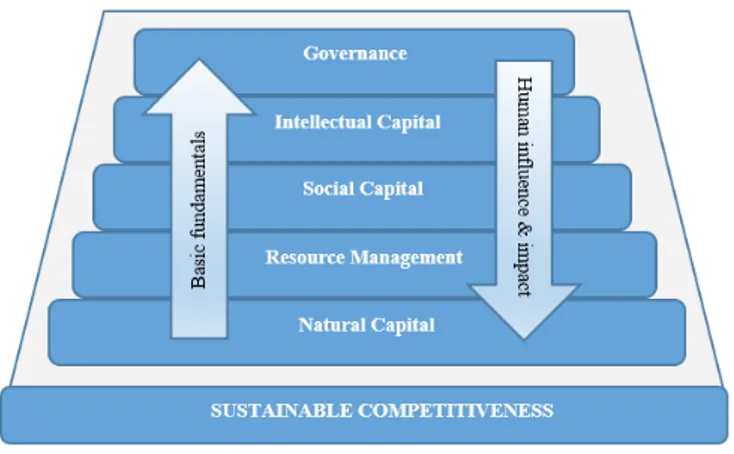
In-dex (GSCI), which it releases annually (since 2012). Considering that “sustainable
competitiveness is the ability to generate and sustain inclusive wealth without
diminishing the future capability of sustaining or increasing current wealth levels,
[…] the sustainable competitiveness model is based on a pyramid (Figure 1), where
each level is required to support the next higher level. In the top-down direction,
the different levels of the pyramid have influence the state of the lower levels”
(SolAbility, 2017).
Figure 1: The Sustainable Competitiveness Pyramid (SolAbility, 2017)
With reference to the most recent Global Sustainable Competitiveness Report
and GSCI (2017): (a). “the GSCI is based on 111 measurable and comparable
quan-titative indicators”; (b). 180 countries have been included; (c). for each indicator,
country scores were calculated from 100 (highest) to 0 (lowest); (d). “the
Sustain-able Competitiveness Index is calculated based on the [...5...] sub-indexes, each
weighted equally” (SolAbility, 2017).
The analysis of the 2017 GSCI reveals the following:
In terms of GSCI 2017 – Top 5 & Bottom 5 Countries (Table 4): the overall score
of GSCI varies from 60,5 (Sweden – quite far from 100) to 30,2 (Iraq); five HIC
Eu-ropean countries make the Top 5, while the Bottom 5 is composed by three African
countries (two LIC and one HIC) and two Asian countries (one LIC and the other
one UMIC).
Table 4: GSCI 2017 – Top 5 & Bottom 5 Countries (http://solability.com/the-global-sustaina-ble-competitiveness-index/downloads)
Top 5 Country Score Bottom 5 Country Score
1 Sweden 60,5 176 Haiti 34,5
2 Norway 58,2 177 South Sudan 32,3
3 Iceland 57,6 178 Seychelles 32,0
4 Finland 57,4 179 Yemen 31,0
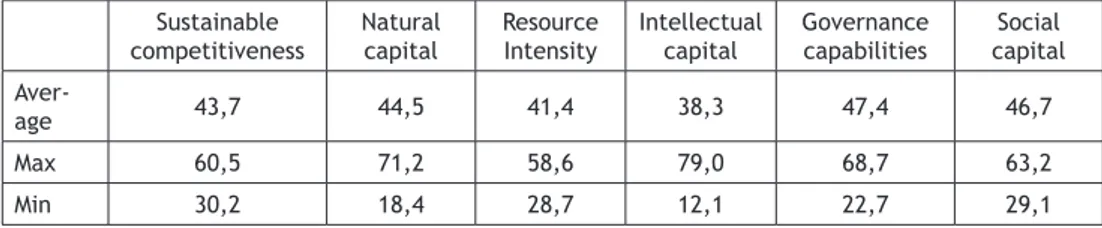
In terms of sub-indexes scores (Table 5): Governance capabilities has the
high-est average score (47,4), while Intellectual capital has the lowhigh-est average score
(38,3) – against the GSCI average score of 43,7; looking at the maximum values,
Intellectual capital scores the highest (79,0), while Resource intensity scores the
lowest (58,6); looking at the minimum values, Social capital scores the highest
(29,1), while Intellectual capital scores the lowest (12,1).
Table 5: Sustainable Competitiveness Scores – by Sub-indexes (http://solability.com/the-glob-al-sustainable-competitiveness-index/downloads)
Sustainable
competitiveness Natural capital Resource Intensity Intellectual capital Governance capabilities capitalSocial
Aver-age 43,7 44,5 41,4 38,3 47,4 46,7
Max 60,5 71,2 58,6 79,0 68,7 63,2
Min 30,2 18,4 28,7 12,1 22,7 29,1
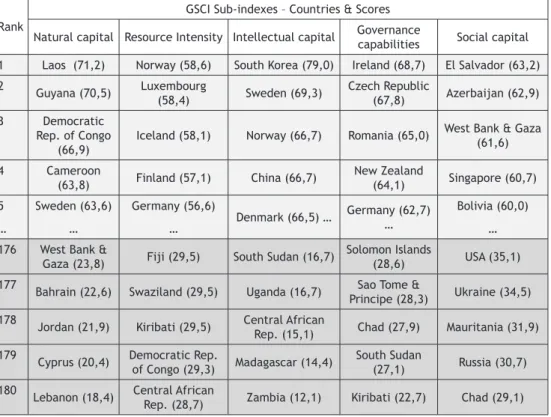
In terms of GSCI 2017 – Top 5 & Bottom 5 Countries – by Sub-indexes (Table 6): out
of the Top 5 countries by GSCI only two countries score for two categories of Top
5 countries by sub-indexes (Sweden and Norway), while the other three countries
(Iceland, Finland and Denmark) score for just one category; out of the Bottom 5
countries by GSCI, South Sudan is the only country that also score (at two
catego-ries) for Top 5 countries by sub-indexes; other countries score for both Top 5 and
Bottom 5 Countries (at different sub-indexes): Democratic Rep. of Congo and West
Bank & Gaza, while countries such as Kiribati, Chad and Central African Republic
score for two categories of Bottom 5.
Table 6: GSCI 2017 – Top 5 & Bottom 5 Countries – by Sub-indexes (http://solability.com/the-glob-al-sustainable-competitiveness-index/downloads)
Rank
GSCI Sub-indexes – Countries & Scores
Natural capital Resource Intensity Intellectual capital Governance capabilities Social capital 1 Laos (71,2) Norway (58,6) South Korea (79,0) Ireland (68,7) El Salvador (63,2) 2 Guyana (70,5) Luxembourg
(58,4) Sweden (69,3) Czech Republic (67,8) Azerbaijan (62,9) 3 Democratic
Rep. of Congo (66,9)
Iceland (58,1) Norway (66,7) Romania (65,0) West Bank & Gaza (61,6)
4 Cameroon
(63,8) Finland (57,1) China (66,7) New Zealand (64,1) Singapore (60,7) 5 … Sweden (63,6) … Germany (56,6) … Denmark (66,5) … Germany (62,7) … Bolivia (60,0) … 176 West Bank &
Gaza (23,8) Fiji (29,5) South Sudan (16,7) Solomon Islands (28,6) USA (35,1) 177 Bahrain (22,6) Swaziland (29,5) Uganda (16,7) Sao Tome &
Principe (28,3) Ukraine (34,5) 178 Jordan (21,9) Kiribati (29,5) Central African
Rep. (15,1) Chad (27,9) Mauritania (31,9) 179
Cyprus (20,4) Democratic Rep. of Congo (29,3) Madagascar (14,4) South Sudan (27,1) Russia (30,7) 180 Lebanon (18,4) Central African
Rep. (28,7) Zambia (12,1) Kiribati (22,7) Chad (29,1)
4. THE SDG INDEX (SDGI)
Aiming to benchmark the performance of countries on the SDGs – by presenting
“a revised and updated assessment of countries’ distance to achieving the SDGs,
[…while including…] detailed SDG Dashboards to help identify implementation
pri-orities for the SDGs, […and…] a ranking of countries by the aggregate SDG Index of
overall performance” (Bertelsmann Stiftung, Sustainable Development Solutions
Network, 2018), Bertelsmann Stiftung and Sustainable Development Solutions
Net-work have annually produced and released (since 2016) the SDG Index and
Dash-boards Report.
As regards the 2018 edition of the Report: (a). “country profiles are generated
for all 193 member states but total country scores and ranks are available for
156 countries”; (b). it includes 86 global indicators – which means, on average,
around five indicators per goal, but the actual number of indicators per goal varies
between one (SDG10) and fourteen (SDG3); (c). “the global SDG Index score and
scores by goal can be interpreted as the percentage of achievement (Lafortune,
Fuller, Moreno, Schmidt-Traub, Kroll, 2018).
The analysis of the 2018 SDG Index and Dashboards Report reveals the following:
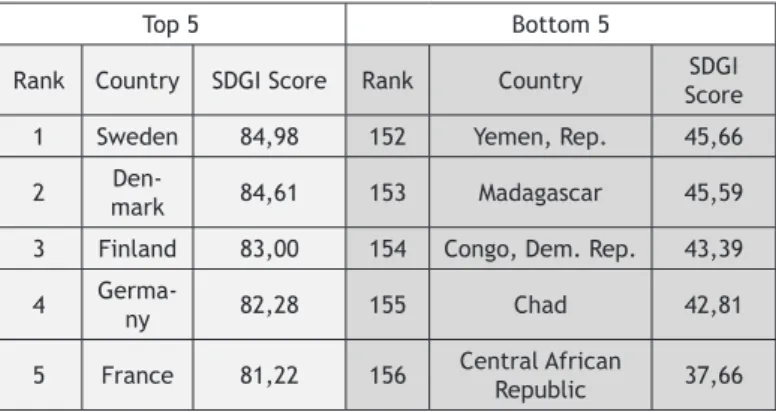
If considering the Top 5 and Bottom 5 countries by SDGI Score (Table 7): The
SDGI scores vary from 84,98 (Sweden) to 37,66 (Central African Republic); Three
Northern Europe (OECD members and High Income) countries top the 2018 ranking,
while three Middle Africa (Low Income) countries are positioned at the bottom of
it; Top 5 is completed by two Western European countries, while Bottom 5 is
com-pleted by an Eastern Africa (Low Income) and a Western Asia (MENA, Lower Middle
Income) country.
Table 7: Top 5 and Bottom 5 countries by SDGI Score, 2018 (http://www.sdgindex.org/reports/)
Top 5 Bottom 5
Rank Country SDGI Score Rank Country Score SDGI
1 Sweden 84,98 152 Yemen, Rep. 45,66
2 markDen- 84,61 153 Madagascar 45,59
3 Finland 83,00 154 Congo, Dem. Rep. 43,39
4 Germa-ny 82,28 155 Chad 42,81
5 France 81,22 156 Central African Republic 37,66
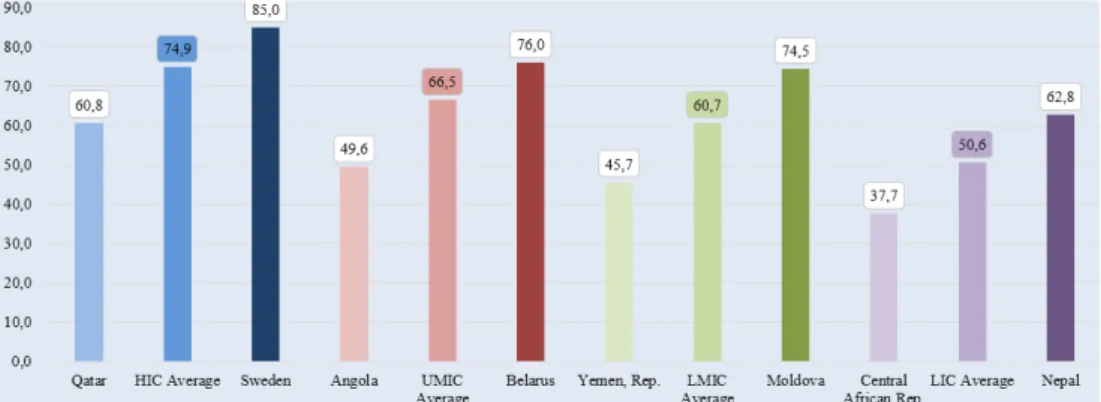
If considering the Income Classes (Figure 2): The High Income Countries’ ranks
vary from 1 (Sweden – 85,0 SDGI) to 106 (Qatar – 60,8 SDGI); The Upper Middle
Income Countries’ ranks vary from 23 (Belarus – 76,0 SDGI) to 144 (Angola – 49,6
SDGI); The Lower Middle Income Countries’ ranks vary from 28 (Moldova – 74,5
SDGI) to 152 (Yemen, Rep. – 45,7 SDGI); The Low Income Countries’ ranks vary from
102 (Nepal – 62,8 SDGI) to 156 (Central African Rep. – 37,7 SDGI).
Figure 2: SDGI 2018by Income Classes (http://www.sdgindex.org/reports/)
If considering the regions used for the SDG Index & Dashboard (Figure 3): The
OECD region gathers 35 countries, ranking from 1 (Sweden) to 84 (Mexico); The
E. Europe & C. Asia region gathers 24 countries, ranking from 21 (Croatia) to 151
(Afghanistan); The LAC region gathers 23 countries, ranking from 33 (Costa Rica)
to 145 (Haiti); The East & South Asia region gathers 18 countries, ranking from 43
(Singapore) to 126 (Pakistan); The MENA Region gathers 15 countries, ranking from
60 (United Arab Emirates) to 152 (Yemen, Rep); The Africa region gathers 41
coun-tries, ranking from 88 (Cabo Verde) to 156 (Central African Rep.).
5. CONCLUSION
As regards the evolution of countries towards sustainability and the challenges
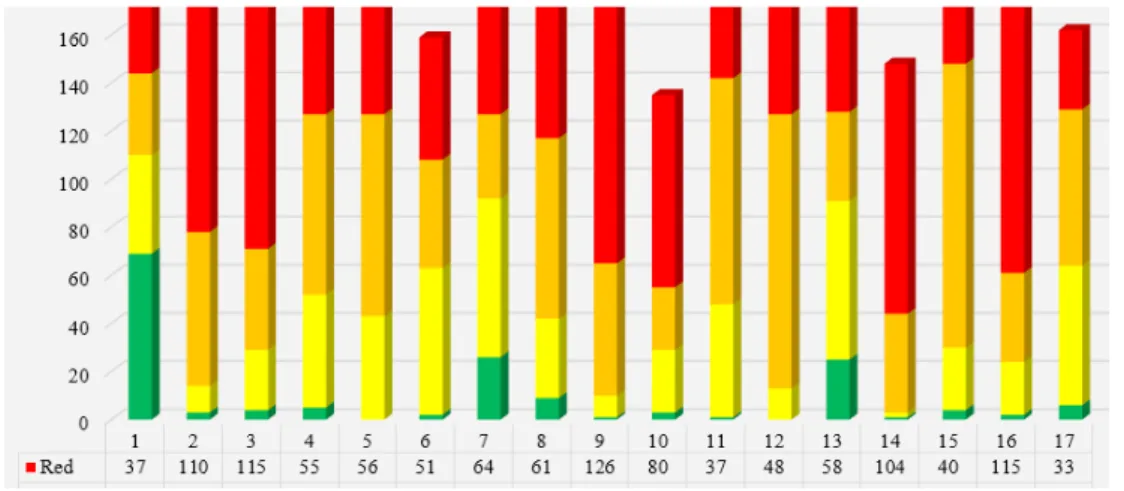
ahead, the SDG Dashboards (Figure 4) provide an eloquent picture of both the
pro-gress made by countries and the unsolved issues – as the SDG Dashboards’ “color
scheme (green, yellow, orange and red) illustrates how far a country is from
achiev-ing a particular goal” (Lafortune, Fuller, Moreno, Schmidt-Traub, Kroll, 2018). A
synthesis of the main aspects – by SDGs (and regions) is presented in Table 8.
Table 8: SDG Dashboards – main findings & challenges ahead – by SDGs 1. No poverty – available data: 181 countries; missing data: 12 countries
It is the most “balanced” goal, with the highest “green area” – 69 countries, and the second best in terms of “red lights” – 37 countries. Three regions (OECD, Eastern Europe and Central Asia, and Middle East and North Africa) are “Red free”, while one (Sub-Saharan Africa) has 28 Red countries and 16 Orange ones (out of its total of 49 countries). 2. Zero hunger – available data: 188 countries; missing data: 5 countries
The goal is dominated by Red and Orange areas – that gather together more than 90 percent of the countries (174). Six regions have no Green area, while only one (Eastern Europe and Central Asia) has three Green countries. 43 countries in Sub-Saharan Africa (out of 49) and 20 countries in East and South Asia (out of 22) are Red.
3. Good health & well-being – available data: 186 countries; missing data: 7 countries
The goal is dominated by Red and Orange areas – that count together for more than 80 percent of the countries (157). Five regions have no Green area, while OECD has three Green countries and Eastern Europe and Central Asia has one Green country. 48 countries in Sub-Saharan Africa (out of 49) and 19 countries in East and South Asia (out of 22) are Red.
4. Quality education – available data: 182 countries; missing data: 11 countries
The goal is dominated by Orange and Red areas (130 countries); the remaining 52 countries are Green (5) or Yellow (47). Four regions have no Green area, while two of them (OECD & Eastern Europe and Central Asia) have two Green countries and one (Oceania) has one Green country. Yellow and Orange dominate in OECD (28 countries out of 35), East and South Asia (18 countries out of 22), Eastern Europe and Central Asia (22 countries out of 28), and Latin America and the Caribbean (26 countries out of 31). In Sub-Saharan Africa 36 countries (out of 49) are Red and 11 are Orange.
5. Gender equality – available data: 183 countries; missing data: 10 countries
The dominant color here is Orange (84 countries), followed by Red (56 countries) and Yellow (43 countries); there is no Green country. Yellow and Orange dominate in four regions (29 countries out of 35 in OECD, 16 countries out of 22 in East and South Asia, 24 countries out of 28 in Eastern Europe and Central Asia, and 27 countries out of 31 in Latin America and the Caribbean), while Orange and Red dominate in the other three regions (all the 16 countries in Middle East and North Africa, 43 countries out of 49 in Sub-Saharan Africa and 8 countries out of 12 in Oceania).
6. Clean water & sanitation – available data: 159 countries; missing data: 34 countries
The goal ranks the third in terms of missing data. Only two countries – one in East and South Asia and the other one in Eastern Europe and Central Asia – are Green. Yellow is the most prominent color in three regions (24 countries out of 35 in OECD, 10 countries out of 28 in Eastern Europe and Central Asia and 18 countries out of 31 in Latin America and the Caribbean), Orange colors almost a half of one region (10 countries out of 22 in East and South Asia), while Red is the most prominent color in the remained three regions (7 countries out of 16 in Middle East and North Africa, 35 countries out of 49 in Sub-Saharan Africa, and 3 countries out of 12 in Oceania).
7. Affordable & clean energy – available data: 191 countries; missing data: 2 countries
The goal ranks the first (alongside the ninth goal) in terms of data availability, and it ranks the second in terms of Green areas – they “cover” 26 countries, belonging to five out of the seven regions (with Middle East and North Africa and Oceania being the exceptions). The best represented Green area is the Latin America and the Caribbean region (with 10 countries out of 31). Yellow is the most prominent color in three regions (20 countries out of 28 in Eastern Europe and Central Asia, 14 countries out of 31 in Latin America and the Caribbean, and 13 countries out of 16 in Middle East and North Africa), Orange defines 13 countries out of 35 in the OECD countries, while Red is the most prominent color in the remaining three regions (10 countries out of 22 in East and South Asia, 44 countries out of 49 in Sub-Saharan Africa, and 5 countries out of 12 in Oceania).
8. Decent work & economic growth – available data: 178 countries; missing data: 15
countries
Orange and Red areas cover more than three quarters of the countries (136 in total). Two regions (Sub-Saharan Africa and Oceania) have no Green country, one region (East and South Asia region) has three Green countries, two regions (OECD and Middle East and North Africa) have two Green countries, while Latin America and the Caribbean has just one Green country. Yellow is the most prominent color in OECD (20 countries out of 35) and it is at parity with Orange in Oceania (3 countries out of 12). Orange is the most prominent color in East and South Asia (13 countries out of 22), Eastern Europe and Central Asia (12 countries out of 28) and Latin America and the Caribbean (17 countries out of 31), while Red defines 32 countries (out of 49) in Sub-Saharan Africa.
9. Industry, innovation & infrastructure – available data: 191 countries; missing data:
2 countries
The goal ranks the first (alongside the seventh goal) in terms of data availability, and, unfortunately, it ranks also the first in terms of Red areas – 126 countries (belonging to all the seven regions). Only one country – in the East and South Asia region is Green, while Yellow defines another nine countries (7 countries belonging to OECD region, one from East and South Asia and one from Eastern Europe and Central Asia). Orange is the most prominent color in Eastern Europe and Central Asia (16 countries out of 28) and Middle East and North Africa (9 countries out of 16). Red dominates in OECD (16 countries out of 35), East and South Asia (17 countries out of 22), Latin America and the Caribbean (19 countries out of 31), Sub-Saharan Africa (47 countries out of 49), and Oceania (9 countries out of 12).
10. Reduced inequalities – available data: 135 countries; missing data: 58 countries
It is the goal with the most “missing data”. Only three countries are Green (two in OECD and one in Eastern Europe and Central Asia), while Red dominates (80 countries); Yellow and Orange are at parity (26 countries). Yellow is the most prominent color in OECD (14 countries out of 35) and Red is the defining color of five regions (East and South Asia – 9 countries out of 22; Eastern Europe and Central Asia – 10 countries out of 28; Latin America and the Caribbean – 17 countries out of 31; Middle East and North Africa – 4 countries out of 16; and Sub-Saharan Africa – 31 countries out of 49).
11. Sustainable cities & communities – available data: 179 countries; missing data: 14
countries
Only one country (belonging to the East and South Asia) is Green, while Orange defines more than a half of countries (94). Yellow is the most prominent color in Oceania (7 countries out of 12), Yellow (17 countries) and Orange (18 countries) are almost equal sharing OECD countries, Orange is the most prominent color in: East and South Asia (12 countries out of 22), Eastern Europe and Central Asia (16 countries out of 28), Latin America and the Caribbean (13 countries out of 31), and Middle East and North Africa (14 countries out of 16), and Red defines 26 countries (out of 49) in Oceania.
12. Responsible consumption and production – available data: 175 countries; missing
data: 18 countries
The goal is dominated by Orange (114 countries), followed by Red (48 countries) and Yellow (13 countries); no Green area is present. OECD countries score the highest percentage of Red areas (24 countries out of 35), and no Yellow zones either. Yellow is present in only 13 countries belonging to four regions (Eastern Europe and Central Asia, Latin America and the Caribbean, Middle East and North Africa, and Sub-Saharan Africa); all the other regions except from OECD are defined by Orange (East and South Asia – 19 countries; Eastern Europe and Central Asia – 17 countries; Latin America and the Caribbean – 19 countries; Middle East and North Africa – 7 countries; Sub-Saharan Africa – 37 countries; and Oceania – 4 countries).
13. Climate action – available data: 186 countries; missing data: 7 countries
The goal is dominated by Yellow (66 countries) and red (58 countries). 32 of the OECD countries are Red, while 3 are Orange (out of 35); no country in this region is Green or Yellow. At the other end of the spectrum, 6 countries in Oceania (out of 12) are Green and 2 of them are Yellow. The other five regions are in between: 30 countries in Sub-Saharan Africa (out of 49) and 14 countries in Latin America and the Caribbean (out of 31) are Yellow, 7 countries in East and South Asia (out of 22) are Orange, while 7 countries in Middle East and North Africa (out of 16) are Red (to mention only the colors with the highest number of records for each group).
14. Life below water – available data: 148 countries; missing data: 45 countries
It is the goal ranked the second in terms of “missing data”, and it is dominated by Red (104 countries). Oceania is the only region with a full distribution of colors (1 Green, 1 Yellow, 5 Orange, and 4 Red); all the other regions, except from OECD countries, are only defined by Orange and especially Red (15 countries out of 22 in East and South Asia; 12 countries out of 28 in Eastern Europe and Central Asia; 18 countries out of 31 in Latin America and the Caribbean; 10 countries out of 16 in Middle East and North Africa; and 26 countries out of 49 in Sub-Saharan Africa), while the OECD region counts for one Yellow country, 9 Orange and 19 Red countries respectively (out of 35 countries).
15. Life on land – available data: 188 countries; missing data: 5 countries
The goal is dominated by Orange (118 countries), followed by Red (40 countries), Yellow (26 countries) and Green (4 countries). The 4 Green countries belong to Sub-Saharan Africa (3 countries) and Eastern Europe and Central Asia (one country). Orange prevail in: OECD (21 countries out of 35); East and South Asia (15 countries out of 22); Eastern Europe and Central Asia (20 countries out of 28); Latin America and the Caribbean (20 countries out of 31); Middle East and North Africa (11 countries out of 16); and Sub-Saharan Africa (28 countries out of 49). Yellow and Red complete the picture with different, less important contributions.
16. Peace, justice & strong institutions – available data: 176 countries; missing data:
17 countries
The goal is dominated by Red (115 countries). Only two countries are Green (one belonging to OECD and the other one to Eastern Europe and Central Asia). Yellow and Orange count for more than three quarters in OECD (27 countries out of 35), while 7 countries here are Red. Red is prevalent in all the remaining 6 regions – 15 countries (out of 22) in East and South Asia; 13 countries (out of 28) in Eastern Europe and Central Asia; 25 countries (out of 31) in Latin America and the Caribbean; 8 countries (out of 16) in Middle East and North Africa; 45 countries (out of 49) in Sub-Saharan Africa; and 2 countries (out of 12) in Oceania.
17. Partnerships for the goals – available data: 162 countries; missing data: 31 countries
The goal is dominated by Orange (65 countries) and Yellow (58 countries), followed by Red (33 countries). Out of the 6 Green countries, 3 are in Sub-Saharan Africa and the other three are in Latin America and the Caribbean, Middle East and North Africa and Oceania. In OECD 21 countries are Red, and 12 are Orange (out of 35). A half of the East and South Asia region (11 countries out of 22) is Orange. In Eastern Europe and Central Asia (28 countries in total), Yellow and Orange share the same number of countries (10), as well as in Latin America and the Caribbean (31 countries in total, out of which 11 are Yellow and another 11 are Orange).
The majority of countries (11 out of 16) are Yellow in In Middle East and North Africa, while they are Yellow (19) and Orange (17) in Sub-Saharan Africa (49 countries in total).
6. BIBLIOGRAPHY
Bertelsmann S. (2018). Sustainable Development Solutions Network. SDG Index and Dashboards Report 2018. Global Responsibilities. Implementing the Goals. Retrieved 24.09.2018 from http://www.sdgindex.org/reports/2018/.
Hák, T., Moldan, B., Dahl, A. L. (Eds.). (2012). Sustainability indicators: a scientific assessment. Washington. Covelo. London: Island Press.
Lafortune, G., Fuller, G., Moreno, J., Schmidt-Traub, G., Kroll, C. (2018). SDG Index and Dashboards Detailed Methodological paper. Retrieved 01.10.2018 from http://www. sdgindex.org/assets/files/2018/Methodological%20Paper_v1_gst_jmm_Aug2018__ FINAL_rev10_09.pdf.
Leal Filho, et al. (2018). Reinvigorating the sustainable development research agenda: the role of the sustainable development goals (SDG). In International Journal of Sustainable Development & World Ecology, 25(2), 131-142.
Moran, D. D., Wackernagel, M., Kitzes, J. A., Goldfinger, S. H., Boutaud, A. (2008). Measuring sustainable development - Nation by nation. In Ecological economics, 64(3), 470-474. Schmidt-Traub, G., Kroll, C., Teksoz, K., Durand-Delacre, D., Sachs, J. D. (2017). National
baselines for the Sustainable Development Goals assessed in the SDG Index and Dashboards. In Nature Geoscience, 10(8), 547.
SolAbility. (2017). The Global Sustainable Competitiveness Report 2017. Retrieved 24.09.2018 from http://solability.com/the-global-sustainable-competitiveness-index/ the-index.
Strezov, V., Evans, A., Evans, T. J. (2017). Assessment of the economic, social and environmental dimensions of the indicators for sustainable development. In Sustainable Development, 25(3), 242-253.
Sustainable Society Foundation. (2017). Sustainability and the SSI – Sustainable Society Index. Retrieved 18.04.2018 from http://www.ssfindex.com/ssi/.
United Nations. (2018a). The Sustainable Development Goals Report 2018. New York. Retrieved 02.10.2018 from https://unstats.un.org/sdgs/files/report/2018/ TheSustainableDevelopmentGoalsReport2018.pdf.
United Nations. (2018b). Progress towards the Sustainable Development Goals. Report of the Secretary-General. Retrieved 02.10.2018 from https://unstats.un.org/sdgs/files/
United Nations. (2018c). Progress towards the Sustainable Development Goals. Report of the Secretary-General. Supplementary Information. Retrieved 02.10.2018 from https:// unstats.un.org/sdgs/files/report/2018/secretary-general-sdg-report-2018--Statistical-Annex.pdf.
United Nations. (2017). SDG Indicators. Global indicator framework for the Sustainable Development Goals and targets of the 2030 Agenda for Sustainable Development. Retrieved 24.09.2018 from https://unstats.un.org/sdgs/indicators/indicators-list/. United Nations. (2016). 17 Goals to Transform Our World. Retrieved 18.04.2018 from
https://www.un.org/sustainabledevelopment/.
World Economic Forum. (2014). The Measurement of Sustainable Competitiveness. In The Global Competitiveness Report 2014-2015. Retrieved 24.09.2018 from http:// reports.weforum.org/global-competitiveness-report-2014-2015/the-measurement-of-sustainable-competitiveness/.