© FECAP
DOI: http://dx.doi.org/10.7819/rbgn.v15i46.1302
Subject Area: Finance and Economics
RBGN
Sustainability, Value, Performance and Risk in the Brazilian Capital
Markets
Sustentabilidade, Valor, Desempenho e Risco no Mercado de Capitais Brasileiro
Sostenibilidad, Valor, Rendimiento y Riesgo en el Mercado de Capitales Brasileño
Valdir de Jesus Lameira1
Walter Lee Ness Jr.2
Osvaldo Luiz Gonçalves Quelhas3
Roberto Guimarães Pereira4
Received on May 16, 2012 / Approved on December 3, 2012 Responsible Editor: João William Grava, Doctor
Evaluation Process: Double Blind Review
1. Doctor in Business Administration by the Pontifícia Universidade Católica do Rio de Janeiro – PUC/RJ. Research at the Instituto de Engenharia de Sistemas e Computadores de Coimbra – INESC, Portugal. [[email protected]]
2. Doctor in Management by the Massachussetts Institute of Technology. [[email protected]] 3. Doctor in Production Engineering by the Universidade Federal do Rio de Janeiro – UFRJ.
Professor at the Universidade Federal Fluminense – UFF and CNPq “Productivity in Research” Fellow. [[email protected]. br]
4. Doctor in Mechanical Engineering by the Pontifícia Universidade Católica do Rio de Janeiro – PUC/RJ. Professor at the Universidade Federal Fluminense – UFF. [[email protected]]
Authors’ address: Rua Passo da Pátria, 156 – São Domingos, Niterói – RJ Cep. 24210-240 – Brazil
ABSTRACT
The study of the relationship between best practices in sustainability and better business management is one of the most relevant and current issues involving researchers and professionals who deal with this subject. For this survey, a representative sample of 205 Brazilian publicly traded companies – between the 2005 and 2009 period – was selected. A possible relationship between ranking in the Bovespa sustainability index, used as a proxy for sustainability best practices, and those companies’ indexes of management quality was investigated. After applying a variety of
econometrics models, it was possible to confirm that best sustainability practices are associated with higher performance, higher value and lower risk. Moreover, sustainability is associated with value, both directly and through mediated variables of performance and risk. Finally, market value, operating leverage, return on assets (ROA) and volatility are possible determinants of sustainability practices’ quality.
Keywords: sustainability, value, performance,
77 Rev. bus. manag., São Paulo, Vol. 15, No. 46, pp. 76-90, Jan./Mar. 2013
Sustainability, Value, Performance and Risk in the Brazilian Capital Markets
RESUMO
O estudo da relação entre melhores práticas de sustentabilidade e melhor qualidade da gestão das empresas é um dos assuntos mais relevantes e atuais que envolvem pesquisadores e profissionais que se relacionam com o tema. Nesta investiga-ção, selecionou-se uma amostra significativa de 205 companhias abertas brasileiras, no período compreendido entre 2005 e 2009, com o pro-pósito de se testar o possível relacionamento entre a participação no índice de sustentabilidade da Bovespa, utilizada como proxy de melhores práticas de sustentabilidade, e a concomitante prática de melhores regras de sustentabilidade com os indicadores da qualidade da gestão dessas companhias. Após a aplicação de variados métodos econométricos, confirmam-se as hipóteses de que melhores práticas de sustentabilidade se encontram associadas a melhores desempenhos, maiores valo-res e menovalo-res riscos. Além disso, a sustentabilidade está associada ao valor por via direta e por meio de variáveis mediadores de desempenho e risco. Por último, verificaram-se que o valor de mercado, o grau de alavancagem operacional, a rentabilidade dos ativos (ROA) e a volatilidade são possíveis determinantes da qualidade das práticas de susten-tabilidade das empresas.
Palavras-chave: sustentabilidade, valor,
desem-penho, risco, métodos econométricos.
RESUMEN
El estudio de la relación entre las mejores prácticas de sostenibilidad y una mejor calidad de la gestión de la empresa es uno de los temas más relevantes y actuales que involucra a investigadores y profesionales relacionados con la materia. Para esta investigación se ha seleccionado una muestra representativa de 205 empresas brasileñas en el período comprendido entre 2005 y 2009, con el fin de comprobar la posible relación entre la participación en el índice de sostenibilidad de Bovespa, que se utiliza como un sustituto de las mejores prácticas de sostenibilidad, y los indicadores de calidad de la gestión de estas empresas. Se han aplicado diversos métodos econométricos para confirmar la hipótesis de
que las mejores prácticas de sostenibilidad inciden sobre un mejor rendimiento, mayor valor y menor riesgo. La sostenibilidad está indirectamente asociada al valor a través de las variables mediadoras de rendimiento y riesgo. Por último, queda constatado que el valor de mercado, el grado de estímulo operativo, la rentabilidad sobre activos (ROA) y la volatilidad, son posibles determinantes de la calidad de las prácticas de sostenibilidad de las empresas.
Palabras clave: sostenibilidad, valor, rendimiento,
riesgo, métodos econométricos.
1
INTRODUCTIONFollowing globalization, large corporations began to expand their projects to meet new global demand. The need to add value to these projects, however, has led companies to concentrate activities in major production centers worldwide. This type of project presents a great demand for capital and increasingly involves nations and global capital market investors.
Meanwhile, social, economic and environmental issues have taken on global scale. Thus, this is an era in which the bonuses of technology and development seem to clash with our quality of life, facing an abrupt change in social values . This is the scenario in which sustainability is being pursued.
So, even though striving for sustainable practices may not be the ultimate solution to the conflict between the abundance of technologies available and a decrease in the quality of life, many believe that companies’ best sustainability practices may result in a convergence amongst forces in the economics sphere, in the future, leading these companies and the economy towards sustained growth.
individuals, companies and society have put best sustainability rules into practice.
In this context, this study aimed at investigating – within the Brazilian capital market, over the 2005-2009 period – whether the companies that had best sustainability practices were also the ones to present best performance, lower risk and higher value.
To answer this question affirmatively, there must be evidence that corporate actions promoting best sustainability practices within companies can be correlated to the major economic and financial challenges of business management. This would support the idea that sustainable practice implementation is in fact one of the paths to sustainable development that modern society is looking for.
To answer this question, we put together a database with economic and financial information referring to 205 companies listed in São Paulo’s stock exchange over the 2005-2009 period. We applied the ordinary least square linear regression (OLS) method in stages one and two, as well as the generalized method of moments (GMM), to study the connection between being in Bovespa’s list of companies with best sustainability practices and presenting best performance, risk and value indexes.
This article is divided as follows: in section II, we review literature referring to research topics; in section III, we present variables, indexes, sample and methodology used in the econometric tests carried out; in section IV, we present results; and, in section V, we offer our final comments and conclusions.
2
THEORETICAL REFERENCESThere is still no consensus as to the relationship between best sustainability practices and best performance or value. This lack of alignment results from dissonance amongst studies that investigated the relationship between best sustainability practices or participation in financial market sustainability indexes and greater value, better performance, smaller risk and higher
market returns, in companies included in those indexes, or that have shown most concern at to sustainability.
Accordingly, Orlitzly, Schmidt and Rynes (2003), Lee and Faff (2006), Fiori Di Donato and Izzo (2007), Ziegler and Schröder (2006), Ziegler (2009), Cheung (2009), Menz (2009) and Huppé (2011) concluded that, in the companies studied, there was no relationship between best sustainability practices and best performances, smaller risks or higher value, placing these associations under suspicion.
Orlitzly, Schmidt and Rynes (2003) concluded that financial performance is positively correlated to improved sustainability practices; however, as well as identifying that this relationship is endogenous, they also concluded that results between these variables may present specification errors and are not conclusive, and that the benefits of sustainability may be reached in various different dimensions.
Faff and Lee (2006) investigated a sample of 2,500 companies in the Dow Jones Sustainability World Index, over the 1998-2002 period, so as to find evidence that portfolios made up of companies that are leaders in best sustainability practices could perform better than portfolios of companies that were not concerned with sustainability. Evidence encountered suggested that companies that were less concerned with sustainability made up a better performance portfolio than companies with best sustainability practices. These authors concluded that the higher idiosyncratic risks associated with companies with best sustainability practices must refer to these companies’ higher market returns.
Fiori, Di Donato and Izzo (2007) also studied the connection between best social responsibility practices and greater appreciation of stock prices, in a sample of 26 Italian companies listed in the stock market over the 2003-2006 period. They used the ordinary least squares regression method and found no statistical evidence of this connection.
79 Rev. bus. manag., São Paulo, Vol. 15, No. 46, pp. 76-90, Jan./Mar. 2013
Sustainability, Value, Performance and Risk in the Brazilian Capital Markets
practices and best management may have resulted from shoddy specifications in study models, or from the fact that research was carried out over short periods, in cross-section, reinforcing an understanding already present in Ziegler and Schröder (2006). The author believes that results may also be due to the index including factors that do not refer only to sustainability.
Ziegler (2009) also studied the connection between performance, measured by Tobin’s Q and return on assets, and the presence of 266 European companies in the Dow Jones Sustainability World Index, over the 1999-2003 period, by means of ordinary least square linear regressions and fixed and random effects. The author concluded that presence in the index was unrelated to best performances and that any such associations lost statistical significance after carrying out techniques to eliminate possible bias from temporal fixed effects, which disappear after including companies’ characteristics of heterogeneity.
Chueng (2009) carried out a study of events with companies in the Dow Jones Sustainability World Index over the 2002-2008 period, and found no evidence that being in the index or leaving it had any impact whatsoever on stock returns or on their risk. He also confirmed that the idiosyncratic risk associated to companies’ stocks increased following inclusion in the index.
From the bond market perspective, Menz (2009) sought to identify whether there were any benefits in issuing or better pricing of bonds issued by companies with Eurozone best sustainability practices, and found no statistically significant connection between these variables.
Huppé (2011) investigated the recent existence of an Alpha (α) positive for companies that are leaders in social responsibility practices – and which, according to the author, motivated investors towards optimism and towards purchasing their shares. These same investors moved in the opposite direction as to shares from companies that were less concerned with sustainability practices. Thus, the author found that this connection did not result from market inefficiency, nor from a spurious connection between time, social sustainability practices and
stock market returns. The author concluded that the connection found resulted from subsequent reassessment by investors, after they realized that companies that were leaders in social responsibility practices also presented the best performances.
On the other hand, Bassen, Meyer and Schlange (2006), Lo and Sheu (2007), Rossi (2009), Poddi and Vergalli (2009), Cheng, Ioannou and Serafeim (2011) and Teixeira, Nossa and Funchal (2011) presented research revealing positive results from the connection between best sustainability practices and lower capital cost, higher value, best performance and greater access to funding sources.
In this regard, Bassen, Meyer and Schlange (2006) investigated the association between best social responsibility practices and the company’s lower cost of capital – and, consequently, a connection between best social responsibility practices and performance. They used a sample of 44 utility companies with cross-section data in 2004. They concluded that relationships between social responsibility, lower capital cost and better business performance do exist – without concluding, however, in a definitive way, whether smaller risks are wholly responsible for the connection between best responsibility practices and performance.
Lo and Sheu (2007) found a positive connection between presence in the sustainability index and the higher values of companies in the US stock market, using the Dow Jones Sustainability World Index. In the Brazilian capital market, Rossi (2009) found a connection between best sustainability practices and companies’ greater value.
Poddi and Vergalli (2009) used a panel data of 416 companies belonging to two of the following three indexes: Domini 400 Social Index, Dow Jones Sustainability World Index and FTSE4 Good Index. They observed statistically significant results connecting the relevance of these indexes, compliance with best social responsibility rules and these companies’ best performances.
concluded that best social responsibility actions do lead companies to greater access to finance – and that the responsibility policy’s social and environmental scope mediate the relationship between sustainability and increased access to financing.
Teixeira, Nossa and Funchal (2011) investigated whether the way companies are financed is affected by their presence in the Corporate Sustainability Index (ISE), and also whether there was any connection between ISE and risks. Statistical results indicated that companies with most Corporate Social Responsibility (CSR) were negatively associated with debt and risk, when compared with the control sample.
Endogeneity becomes increasingly relevant when investigating best sustainability practices and companies’ best performances, as Orlitzly, Schmidt and Rynes (2003) and Ziegler (2009) had already found out. Accordingly, OLS was applied in stage 2, in order to settle eventual fixed time effects that could influence results obtained from applying OLS, as well as GMM, to settle endogeneity problems, achieving better coefficients than those resulting from structural equations.
The Corporate Sustainability Index (ISE) was created along the same lines as the Dow Jones Sustainability Index, the FTSE4Good Series and the Johannesburg Stock Exchange SRI Index, striving to become a profitability benchmark for companies with investments involving sustainable development in Brazil. It became a benchmark capable of stimulating corporate social responsibility, considering corporate governance and corporate sustainability, as demonstrated by BM & FBOVESPA (2011).
It is assumed that the implementation of best sustainability practices by companies involves prior awareness of how important it is to broaden their horizons to a larger number of stakeholders. The consequent idea is that companies must invest a certain amount in implementing these best sustainability practices, without connecting investments to greater economic or financial
returns. In this way, initially, companies that implemented best sustainability practices are expected to have registered slumps in their economic and financial performances, as shown by Lee and Faff (2006).
On the other hand, companies most concerned with social, environmental and economic aspects – and that have broadened the spectrum of importance given to their stakeholders – may have raised more sympathy for their products and brands, as shown by Orlitzly, Schmidt and Rynes (2003), as well as a greater number of long-term investors, as observed by Rossi (2009).
It is in the context of these proven references that we consider this study of the relationship between sustainability, value, performance and risk in the scope of Brazil’s current capital market to be timely.
3
METHODOLOGYTo investigate existing relationships between variables of sustainability and performance, risk and value, quantitative exploratory research was carried out to discover connections between them – and to be able to conclude whether, in fact, these relationships do exist and conclusively answer the question under research.
3.1
Sample, concepts, variables and indexes
To this end, a sample of companies was established within the universe of open Brazilian companies over the 2005-2009 period. The sample contains data from 205 companies in a balanced panel. Variable data was obtained from the Economática database, and refer to annual figures at the end of company fiscal years. Altogether, 20,500 data entries were collected, divided by the twenty variables used in the study, over the five years of research.
81
Rev
. bus. manag., São Paulo, V
ol. 15, No. 46, pp. 76-90, Jan./Mar
. 2013
Sustainability
, V
alue, Performance and Risk in the Brazilian Capital Markets
Concepts Variables Indexes Reason for including in study
Sustainability
Quality of companies’ sustainability practices.
Presence in Bovespa’s Corporate Sustainability Index, over period of research, represented as a dummy variable called ISE. This variable takes on zero value if the company did not belong to the index in the surveyed year, and value equal to 1 when it belonged to the index in the surveyed year.
The dummy variable allows for investigation without having to create a sustainability index to be measured for all companies. The dummy is based on annual assessment released by Bovespa and has already been used by Rossi (2009). Ziegler (2009), Ziegler and Schröder (2006) and Lee and Faff (2006), amongst others, have also used market indexes to evaluate the quality of companies’ sustainability practices.
Performance
Companies’ economic and financial performance in the investigated year.
Return on assets (ROA), return on equity (ROE) and earnings per share of the company (EPS).
Variables referring to return on equity and return on assets are widely used as performance indexes in finance research. Return on assets (ROA) was used by Ziegler and Schröder (2006), return on equity (ROE) was used by Fiori, Di Donato and Izzo (2007). Earnings per share was included as an additional alternative to assess the impact of companies’ improved sustainability performances.
Value Companies’ market value measures.
Ratio between market value and book value of company shares (MTBV); ratio between stock price and Ebitda (PEBITDA); ratio between share price and book value per share (PVPA); and ratio between stock prices and profit (PL).
MTBV is less volatile than other performance indexes over longer periods, which helps when applying research methods. Moreover, this measure has been used by Poddi and Vergalli (2009). Other indexes referring to performance were included as alternatives for evaluating the impact of sustainability on the value of companies.
Risk Risk measures referring to companies’ shares.
Annual volatility of company stocks (VOLATILITY); value of cost of debt in the company (KdNOM); value of the company’s stock betas (BETA).
The volatility, beta and cost of debt indexes are widely used in finance to assess company risk and, therefore, have also been included in this study. The beta index was used by Fiori Di Donato and Izzo (2007), in research involving risk and sustainability.
Control variables
Variables referring to tests’ dependent variable, which help control results so that they reasonably reflect the relationships investigated by tests applied.
For OLS testing in one and two stages, the following variables were used: a) AFIN – company’s financial leverage index; b) AOP – company’s operational leverage index; c) CAPEXDEP – ratio between the value of annual capital investment and company’s annual depreciation; d) DE – ratio of company’s gross debt and net equity; e) DIVYLD – ratio between the value of company dividend and share value; f ) INVPL – ratio between company’s investment value and net asset value; g) LIQ – liquidity value of company shares; h) PAYOUT – percentage ratio between dividend and amount of profit; and i) TAM – value of company assets measured by logarithm of company asset values.
Several variables were included to monitor test results.
CAPEXDEP – variable used to control value, performance and risk results, and already used by Rossi (2009) apud Myers (1977); DE – variable also used to control performance and already used by Ziegler (2009);
INVPL – variable used to control value, performance and risk results, and already used by McWilliams and Siegel (2001);
PAYOUT – variable also used to control value, performance and risk results, and already used by Fazzari et al. (1988) and Cheng, Ioannou and Serafeim (2011);
TAM – variable also used to control value, performance and risk results, and already used by Ziegler (2009) and by Bechetti el al. (2008); AFIN – variable used to control value, performance and risk results; AOP – variable used to control value, performance and risk results; DIVYLD – variable used to control value and performance results; LIQ – variable used to control value, performance and risk results.
Instrumental variables – V.I. ct
in which:
c = cross section indexer t = time indexer
i = indexer varying from 1 to 6 and representing the number of equation control variables
Dependent variable ct = Dependent variables of performance (ROA, ROE and EPS), risk (VOLATILITY, KdNOM and BETA) or value (MTBV, PEBITDA, PVPA and PL)
βi ct = Coefficients associated with equation
independent variables
Vi ct = Control variables (AFIN, AOP, CAPEXDEP, DE, LIQ, TAM)
V. I. ct = Instrumental variables (ROE, EPS, MTBV, INVPL, PEBITDA, VPA, KdNOM and BETA)
βise ct = Variable ISE coefficient ε ct = equations’ error term
To test the robustness of results obtained from applying least square linear regressions with one and two stages, MMG was also. This method allows for a solution that minimizes the moments of variables inserted into the independent variables vector, especially when there might be variables that are not included in the set of independent variables. We also applied this method because of possible existing correlations between any given independent variable and OLS regression residuals. In this context, this method helps find the best non-biased estimators for regression between dependent and independent variables, providing the best equation and coefficients that enable the optimization of the orthogonalization of the regression equation’s solution vectors with the residues from this same equation. As test instrumental variables, we included the variables that provided the best results. To apply GMM, the following type of equation was applied:
Equation type to be tested:
Dependent variable = βi ct . Vi ct + βise ct .
ISE ct + ε ct (equation 3);
3.2
Models employed
In order to investigate the possible connections between variables of sustainability, value, performance and risk, we used statistical methods capable of revealing such relationships. Thus, so that temporal trends could be observed, tests were applied to a data structure in a balanced panel, over 2005-2009 period. The panel is made up of data from the various indexes included in research, for each of the 205 companies, in each of the years investigated.
Thus, we initially applied ordinary least square multiple linear regressions with one stage. When applying OLS in one stage, the following type of equations were used:
Equation type to be tested:
Dependent variable ct = β0 + βi ct . Vi ct + βise ct . ISE ct + ε ct (equation 1)
in which:
c = cross section indexer t = time indexer
i = indexer varying from 1 to 9 and representing the number of equation control variables
Dependent variable ct = Dependent variables of performance (ROA, ROE and EPS), risk (VOLATILITY, KdNOM and BETA) or value (MTBV, PEBITDA, PVPA and PL)
β0 = Equation constant
βi ct = Coefficients associated with equation
independent variables
Vi ct = Control variables (AFIN,u AOP, CAPEXDEP, DE, DIVYLD, INVPL, LIQ, PAYOUT, TAM)
βise ct = Variable ISE coefficient
ε ct = equations’ error term
Given the endogenous nature of this research, we used OLS multiple linear regressions in two stages. As test control variables, we included variables that yielded best results. When applying OLS in two stages, we used the following type of equations:
Equation type to be tested:
83 Rev. bus. manag., São Paulo, Vol. 15, No. 46, pp. 76-90, Jan./Mar. 2013
Sustainability, Value, Performance and Risk in the Brazilian Capital Markets
Instrumental variables – V.I. ct
in which:
c = cross section indexer t = time indexer
i = indexer varying between 1 and 6 and representing the number of control variables in the equation
Dependent variable ct = Dependent variable of performance (ROA, ROE e EPS), risk (VOLATILITY, KdNOM and BETA) or value (MTBV, PEBITDA, PVPA and PL)
βi ct = Coefficients associated with equation’s
independent variables
βise ct = Variable ISE coefficient
Vi ct = Control variables (AFIN, AOP, CAPEXDEP, DE, LIQ, TAM)
V.I. ct = Instrumental variables (ROE, EPS, MTBV, INVPL, PEBITDA, VPA, KdNOM E BETA)
ε ct = equations’ error term
3.3
Hypothesis
To achieve evidence in support of the main question in research, the following hypotheses were established and tested:
Hypothesis 1 (H1) = A positive relationship is believed to exist between presence in Bovespa’s sustainability index and resulting best sustainability rules, and indexes of corporate performance according to Bassen, Schlange and Meyer (2006 ) and Poddi and Vergalli (2009). Positively correlated (+).
Hypothesis 2 (H2) = A negative relationship is believed to exist between presence in Bovespa’s sustainability index and resulting best sustainability rules, and company risk indexes as in Bassen, Schlange and Meyer (2006). Negatively correlated (-).
Hypothesis 3 (H3) = The improvement in sustainability practices, approximated by a
dummy variable for participation in Bovespa’ sustainability index, is believed to be positively and indirectly associated with the value variable by means of the performance mediating variable, as in Lo and Sheu (2007) and Rossi (2009). Positively correlated (+).
Hypothesis 4 (H4) = The improvement in sustainability practices, approximated by a dummy variable for participation in Bovespa’ sustainability index, is believed to be associated with the value variable by means of the risk variable. Companies with best sustainability practices are believed to be associated with lower risks and, consequently, higher values . Negatively correlated (-).
4
RESULTSSo as to meet one of the assumptions required to applying the linear regression method, we tested the normality of dependent and independent variables using the Jarque-Bera test. The results highlighted the need to make adjustments, so that the dependent variables’ distribution would be close to normal. Accordingly, changes were made – and changes with the logarithm function brought the best results.
All variables passed the VIF (Variance Inflation Factor) test with values smaller than 2.0, supporting the absence of multicollinearity between variables. To avoid potential heteroskedasticity problems, regressions were tested with and without corrections for White heteroscedasticity. The results were not inconsistent – especially p-values did not change –, showing that variables did not present heteroscedasticity problems in the tested sample.
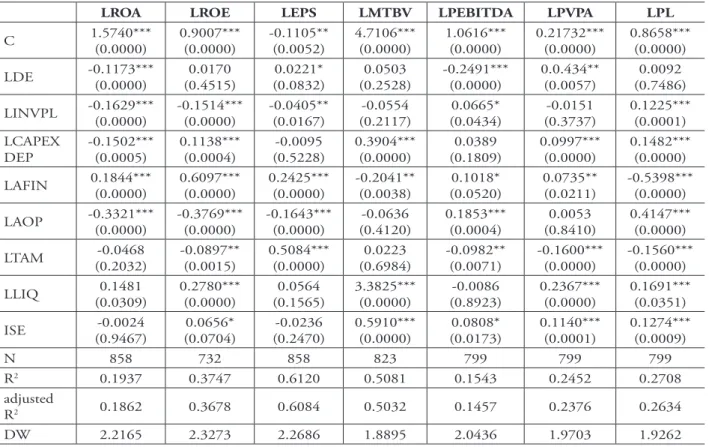
Table 1 – Results of regressions in OLS for performance and value variables.
LROA LROE LEPS LMTBV LPEBITDA LPVPA LPL
C 1.5740***
(0.0000)
0.9007*** (0.0000)
-0.1105** (0.0052)
4.7106*** (0.0000)
1.0616*** (0.0000)
0.21732*** (0.0000)
0.8658*** (0.0000)
LDE -0.1173***(0.0000) (0.4515)0.0170 (0.0832)0.0221* (0.2528)0.0503 -0.2491***(0.0000) 0.0.434**(0.0057) (0.7486)0.0092
LINVPL -0.1629***(0.0000) -0.1514***(0.0000) -0.0405**(0.0167) (0.2117)-0.0554 (0.0434)0.0665* (0.3737)-0.0151 0.1225***(0.0001)
LCAPEX DEP
-0.1502*** (0.0005)
0.1138*** (0.0004)
-0.0095 (0.5228)
0.3904*** (0.0000)
0.0389 (0.1809)
0.0997*** (0.0000)
0.1482*** (0.0000)
LAFIN 0.1844***(0.0000) 0.6097***(0.0000) 0.2425***(0.0000) -0.2041**(0.0038) (0.0520)0.1018* 0.0735**(0.0211) -0.5398***(0.0000)
LAOP -0.3321***
(0.0000)
-0.3769*** (0.0000)
-0.1643*** (0.0000)
-0.0636 (0.4120)
0.1853*** (0.0004)
0.0053 (0.8410)
0.4147*** (0.0000)
LTAM (0.2032)-0.0468 -0.0897**(0.0015) 0.5084***(0.0000) (0.6984)0.0223 -0.0982**(0.0071) -0.1600***(0.0000) -0.1560***(0.0000)
LLIQ (0.0309)0.1481 0.2780***(0.0000) (0.1565)0.0564 3.3825***(0.0000) (0.8923)-0.0086 0.2367***(0.0000) 0.1691***(0.0351)
ISE (0.9467)-0.0024 (0.0704)0.0656* (0.2470)-0.0236 0.5910***(0.0000) (0.0173)0.0808* 0.1140***(0.0001) 0.1274***(0.0009)
N 858 732 858 823 799 799 799
R2 0.1937 0.3747 0.6120 0.5081 0.1543 0.2452 0.2708
adjusted
R2 0.1862 0.3678 0.6084 0.5032 0.1457 0.2376 0.2634
DW 2.2165 2.3273 2.2686 1.8895 2.0436 1.9703 1.9262
Source: the authors.
Symbols ***, ** and * represent, respectively, statistically significant values at 0.1%, 1% and 15%.
Table 2 – Results of regressions in OLS for risk variables.
LVOLATILITY LKdNOM LBETA
C 1.8552***
(0.0000)
1.62202*** (0.0000)
0.1836*** (0.0000)
LDE (0.0164)0.0302* (0.2628)-0.0653 (0.5964)0.0027
LINVPL -0.0039
(0.7751)
-0.1127** (0.0079)
0.0038 (0.5165) LCAPEX
DEP
-0.0761*** (0.0000)
-0.0667* (0.0622)
-0.0018 (0.7463)
LAFIN 0.0191
(0.3560)
0.0338 (0.5754)
0.0069 (0.4869)
LAOP -0.0431*(0.0821) 0.3958***(0.0002) 0.0247**(0.0382)
LTAM -0.0885***
(0.0000)
-0.1429** (0.0025)
-0.0148** (0.0432)
LLIQ -0.0537*(0.1375) (0.8421)0.0202 0.2142***(0.0000)
ISE -0.0516***
(0.0007)
-0.0650 (0.2961)
0.0010 (0.9261)
N 498 858 692
R2 0.2043 0.0830 0.1526
adjusted R2 0.1912 0.0744 0.1427
DW 1.3489 1.9761 1.7645
Source: the authors.
85 Rev. bus. manag., São Paulo, Vol. 15, No. 46, pp. 76-90, Jan./Mar. 2013
Sustainability, Value, Performance and Risk in the Brazilian Capital Markets
In order to ensure that these
coefficients were the best unbiased ones
for the ISE variable, we tested residues
from equations in OLS regressions in one
stage. Analysis of Jarque-Bera normality test
results was carried out for the normality of
residues and also analysis of the test of serial
correlation with the Q statistic and of the
test of LM serial correlation. Test results
did not allow us to completely dismiss the
presence of some information content in
the residue of equations.
Regarding endogeneity, we tested
the causality between the ISE variable
and performance, risk and value variables,
finding causality from ISE to MTBV in
1%, to PEBITDA in 5% and to LEPS in
1%. Causality was also found from LROA
to ISE in 5%, from PEBITDA to ISE in
10%, and from FEPS to ISE in 1%, from
LVOLATILITY to ISE in 10% and from
LBETA to ISE in 15%. Thus, there is strong
evidence that the relationship between ISE
and independent variables is endogenous.
In order to mitigate the influence
of possible temporal fixed effects and
effects of endogeneity on the relationship
between dependent and independent
variables, we applied two-stage OLS
and GMM. For regressions with OLS in
two stages and GMM, we reduced the
number of independent variables and
selected the most appropriate instrumental
variables. In GMM, we applied the
Kernel-Barlett spectral estimation method, with
a fixed bandwidth equal to the number
of instrumental variables included in
the equations tested; this number varied
between 5 and 6 in tests carried out.
Also as to the equations tested by GMM,
statistic J values presented were always
small and close to zero, revealing the quality
of instrumental variables applied and
indicating no overidentification, proving
the quality of models’ estimation.
Table 3 – Results of the relationship between LROA, LROE, LEPS and ISE through OLS in two stages and GMM.
LROA – OLS 2 stages
LROA – GMM
LROE – OLS 2 stages
LROE – GMM
LEPS – OLS 2 stages
LEPS – GMM
LDE (0.3906)0.1706 (0.4526)0.2039 (0.3420)0.2756 (0.3454)0.2756 (0.9357)-0.0075 (0.9422)-0.0075
LCAPEX DEP
-0.8369* (0.0451)
-0.9280* (0.0938)
0.0132 (0.9655)
0.0132 (0.9639)
-0.1392 (0.3208)
-0.1392 (0.2536)
LAFIN 2.0255***(0.0000) 2.2243***(0.0000) (0.2612)-0.6096 (0.2974)-0.6096 (0.6391)0.1361 (0.7098)0.1361
LAOP (0.0636)1.4213* (0.1441)1.4705* (0.0278)0.6316* 0.6316**(0.0300) (0.1766)01570 (0.2338)0.1570
LTAM 0.1641
(0.2134)
0.1682 (0.3291)
0.6447*** (0.0000)
0.6447*** (0.0000)
0.5497* (0.0628)
0.5497* (0.0337)
LLIQUIDITY - - -
-ISE 1.9528**(0.0046) (0.0233)2.0036* (0.0925)0.5530* (0.1071)0.5530* (0.1482)0.2717* (0.1688)0.2717
Instrumental Variables
LROE, LEPS, LMTBV, LINVPL, LPEBITDA, LPVPA
LEPS, LMTBV, LKdNOM, LBETA, LINVPL
LEPS, LMTBV, LKdNOM, LBETA, LINVPL
N 1024 1024 1025 1025 1025 1025
DW 1.8237 1.8106 2.0382 2.0382 1.9423 1.9423
J N.A. 0.0075 N.A. 8.20 E-32 N.A. 8.20 E-31
Source: the authors.
Symbols ***, ** and * represent, respectively, statistically significant values at 0.1%, 1% and 15%.
Table 4 – Results of the relationship between LPEBITDA, LMTBV and ISE through OLS in two stages
and GMM.
LPEBITDA – OLS 2 stages
LPEBTIDA – GMM
LMTBV – OLS 2 stages
LMTBV – GMM
LDE (0.6482)0.0411 (0.2461)0.2995 (0.3154)0.3065 (0.2461)0.2995
LCAPEX DEP
0.4355*** (0.0000)
2.3407*** (0.0000)
2.3233*** (0.0000)
2.3407*** (0.0000)
LTAM -0.1141*(0.0941) (0.0873)0.4908* (0.1358)0.4810* (0.0873)0.4908*
LLIQUIDITY -1.3190*(0.0773) (0.2036)-8.0245 (0.1901)-7.7070 (0.2036)-8.0245
ISE (0.2056)0.8895 (0.1212)5.8737* (0.1251)5.7852* (0.1212)5.8737*
Instrumental Variables LEPS, LPAYOUT, LPL,LMTBV, LPVPA LPAYOUT, LDIVYLDLEPS, LPL, LPVPA,
N 1024 1024 1024 1024
DW 1.9807 1.8549 1.8647 1.8549
J N.A. 0.0451 N.A. 0.0007
Source: the authors.
87 Rev. bus. manag., São Paulo, Vol. 15, No. 46, pp. 76-90, Jan./Mar. 2013
Sustainability, Value, Performance and Risk in the Brazilian Capital Markets
So as to make result analysis easier, Table 5 presents a summary of signs and statistical
significance of relationships found following OLS testing in stages one and two and GMM.
Table 6 – Results of relationships between ISE and MTBV by means of mediating variables LRO, LVOL
and LKdNOM.
LMTBV – OLS 2 stages
LMTBV – GMM
LMTBV – OLS 2 stages
LMTBV – GMM
LMTBV – OLS 2
stages
LMTBV – GMM
C (0.1844)- 3.7479 (0.5241)1.3215 22.1120***(0.0000) 22.1120***(0.0000) 16.1918***(0.0004) 16.1918***(0.0001)
LROE 8.2697***
(0.0006)
0.2102**
(0.0245) - - -
-LVOLATILITY - - - 9.3380***(0.0000) - 9.3380***(0.0000) -
-LKdNOM - - - 8.1715*(0.0212) - 8.1715*(0.0111)
N 794 794 580 580 978 978
DW 1.9607 1.9406 1.5737 1.5737 1.8073 1.8073
J - 6.34 E-26 - 2.22 E-22 - 1.15 E-26
Source: the authors.
Symbols ***, ** and * represent, respectively, statistically significant values at 0.1%, 1% and 15%.
Table 5 – Summary of results for performance, value and risk indexes.
ISE OLS – 1 stage
ISE OLS – 2 stages
ISE GMM
LROA – + ** + *
LROE + * + * + *
LEPS – + * +
LMTBV + *** + * + *
LPEBITDA + * + + *
LPVPA + *** + +
LPL + *** + +
Summary – Performance and Value Indexes
2 (–) no significance 5 (+) with statistical
significance
7 (+) of which 4 with statistical significance
7 (+) of which 4 with statistical significance
LVOLATILITY – *** – –
LKDNOM – – –
LBETA – – –
Summary – Risk Indexes 3 (–) of which 1 with significance
3 (–) no significance 3 (–) no significance
Source: the authors.
Symbols ***, ** and * represent, respectively, statistically significant values at 0.1%, 1% and 15%.
In general, results showed a positive connection between presence in the sustainability index and, presumably, the assumption of best sustainability practices with best performance and company stock value indexes. We obtained 13 positive results relying on statistical significance, whereas only two were negative and statistically insignificant.
The results of the connection between ISE and risk indexes revealed a constant negative connection, but only a result with
statistical significance between ISE and LVOLATILITY.
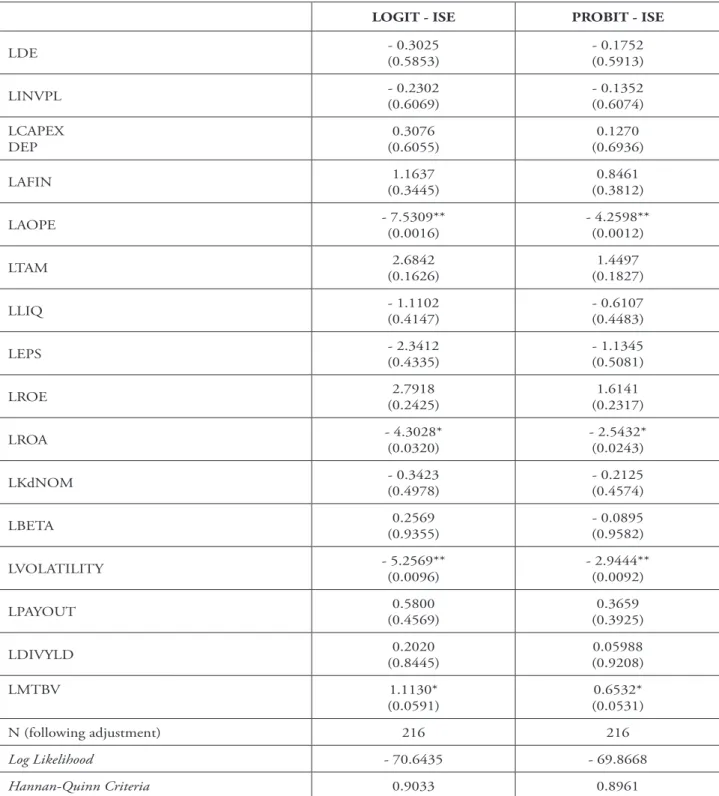
Finally, we applied the logit and probit methods to investigate determinants in the implementation of best sustainability practices by companies, using a binary dummy variable, type 0 (zero) or 1 (one). Value 0 (zero) corresponds
to non-inclusion of the company in the Bovespa sustainability index in the year surveyed. Value 1 (one) means company inclusion in the sustainability index in the year surveyed. Results are presented in Table 7 below.
Table 7 – Factors that determine the quality of companies’ sustainability practices.
LOGIT - ISE PROBIT - ISE
LDE - 0.3025(0.5853) (0.5913)- 0.1752
LINVPL - 0.2302(0.6069) (0.6074)- 0.1352
LCAPEX DEP
0.3076 (0.6055)
0.1270 (0.6936)
LAFIN (0.3445)1.1637 (0.3812)0.8461
LAOPE - 7.5309**(0.0016) - 4.2598**(0.0012)
LTAM (0.1626)2.6842 (0.1827)1.4497
LLIQ - 1.1102(0.4147) (0.4483)- 0.6107
LEPS - 2.3412(0.4335) (0.5081)- 1.1345
LROE (0.2425)2.7918 (0.2317)1.6141
LROA - 4.3028*(0.0320) - 2.5432*(0.0243)
LKdNOM - 0.3423(0.4978) (0.4574)- 0.2125
LBETA (0.9355)0.2569 (0.9582)- 0.0895
LVOLATILITY - 5.2569**(0.0096) - 2.9444**(0.0092)
LPAYOUT (0.4569)0.5800 (0.3925)0.3659
LDIVYLD (0.8445)0.2020 (0.9208)0.05988
LMTBV 1.1130*
(0.0591)
0.6532* (0.0531)
N (following adjustment) 216 216
Log Likelihood - 70.6435 - 69.8668
Hannan-Quinn Criteria 0.9033 0.8961
Source: the authors.
89 Rev. bus. manag., São Paulo, Vol. 15, No. 46, pp. 76-90, Jan./Mar. 2013
Sustainability, Value, Performance and Risk in the Brazilian Capital Markets
5
CONCLUSIONSResults were favorable to establishing the existence of the connection and the theory that argue that sustainability and improved performances can and should be integrated into the process of striving for sustainable growth.
To find evidences to support an answer to this research question, it was necessary to answer hypotheses H1 to H4. Thus, we found, by means of tests carried out, that improving sustainability practices, approximated by inserting the Bovespa sustainability index, is connected to better performances, lower risks and higher values , the latter aligned with Lo and Sheu (2007) and Rossi (2009), and especially refuting the works of Lee and Faff (2006), Fiori, Di Donato and Izzo (2007) and Ziegler (2009), in the scope of the Brazilian capital market, over the 2004-2009 period.
One can still observe that there are direct and indirect effects resulting from the ISE variable on the value variable; indirect effects occur through the association of that variable with value, through mediating variables of performance and risk.
It was found that the study of the relationship between best sustainability practices and best performances, lower risks and higher values in companies is endogeneous. This effect was not suppressed in research; we chose the generalized method of moments to mitigate these effects, confirming signs of a relationship between variables. The preference for GMM instead of the structured equations method was due to the better accuracy of estimated coefficients through GMM.
Finally, there was evidence suggesting that higher value companies are more likely to participate in the sustainability index or, thus, are more likely to present better sustainability practices. On the other hand, the higher the returns on assets, the lower the probability of these companies presenting best sustainability practices.
This connection seems to make perfect sense, because companies with higher values present lower asset returns. Moreover, companies with higher values have the financial capacity to implement best sustainability practices and can afford their costs. Furthermore, these investments
may slow the rate of return on assets, reinforcing the line of thought presented.
There was also evidence that companies that present higher share leverage and volatility, and that can therefore be considered most risk-prone, are less likely to take up the sustainability index - and, thus, less likely to be included in the group of companies with best sustainability practices.
In short, whilst answering the hypotheses, it was possible to establish a direct connection between best sustainability actions and companies with best performances, lower risks and higher values . Thus, its is possible to conclude that it is true that greater sustainability and better management do in fact go together, and that sustainability is one of the factors associated to companies with better management, within the Brazilian capital market. We therefore conclude that sustainability does possess value.
As a suggestion for further research, it is still possible to investigate the relationship between applying the principles of sustainable development and the resulting improvement in performance indexes for each sector of economy.
REFERENCES
BASSEN, A.; MEYER, K.; SCHLANGE, J. The influence of corporate responsibility on the cost
of capital. Nov. 2006. Available at: < http://ssrn.
com/abstract=984406>. Accessed: February 10, 2012. BECCHET TI, L.; DI GIACOMO, S.; PINNACCHIO D. Corporate social responsibility and corporate performance: evidence from a panel of US listed Companies, Applied Economics, London, v. 40, n. 5, 541-567, Mar. 2008. BM&FBOVESPA. Índice de Sustentabilidade
Empresarial - ISE. Mar. 2011. Available at: <//
www.bmfbovespa.com.br/indices/ResumoIndice. aspx?Indice=ISE&idioma=pt-br >. Accessed: February 28, 2012.
CHENG, B.; IOANNOU, I.; SERAFEIM, G.
finance. May 2011. Available at: <http://ssrn.com/ abstract=1847085>. Accessed: February 20, 2012. CHEUNG, A. Do stock investors value corporate sustainability? Evidence from an event
study. Apr. 2009. Available at: <http://ssrn.com/
abstract=1337899>. Accessed: February 20, 2012. FAZZARI, S.; HUBBARD, R.; PETERSEN, B.
Finance constraints and corporate investment.
Brookings Papers on Economic Activity, Econo-mic Studies Program, The Brookings Institution, Washington, v. 19, n. 1, p. 141-206, 1998. FIORI, G.; DI DONATO, F.; IZZO, M. F.
Corporate social responsibility and firms
performance: na analysis on Italian listed companies.
Sept. 2007. Available at: <http://ssrn.com/ abstract=1032851>. Accessed: February 20, 2012. HUPPÉ, G. A. Alpha‘s tale: the economic value of CSR. Principles for Responsible Investment Academic Conference. July 2011. Available at: <http://ssrn.com/abstract=1969583>. Accessed: February 12, 2012.
LEE, D. D.; FAFF, R. W. The corporate
sustain-ability discount puzzle. July 2006. Available at:
<http://ssrn.com/abstract=921501>. Accessed: February 10, 2012.
LO, S. F.; SHEU, H. J. Is corporate sustainability a value-increasing strategy for business? Corporate
Governance: An International Review, London,
v. 15, n. 2, p. 345-357, Mar. 2007.
MCWILLIAMS A., SIEGEL D. Corporate social responsibility: a theory of the firm perspective.
Academy of Management Review, Briarcliff
Manor, v. 26, n. 1, p. 117-127, Jan. 2001. MENZ, Klaus-Michael. Corporate social
responsibility: is it rewarded by the corporate
bond market? A critical note. Dec. 2009. Available at: <http://ssrn.com/abstract=1332349>. Accessed: February 12, 2012.
MYERS, S. Determinants of corporate borrowing.
Journal of Financial Economics, Massachusetts,
v. 5, n. 2, p. 147-175, July 1977.
ORLITZKY, M.; SCHMIDT, F.; RYNES, S. Corporate social and financial performance: a meta-analysis. Organization Studies, London, v. 24, n. 3, p.403-441, Mar. 2003.
PODDI, L.; VERGALLI, S. Does corporates social responsibility affect the performance of
firms? Ago. 2009. Available at: <http://ssrn.com/
abstract=1444333>. Accessed: February 20, 2012. ROSSI Jr, J. L. What is the value of corporate
social responsibility? An answer from the Brazilian
sustainability index. Feb. 2009. Available at: <http://ssrn.com/abstract=1338114>. Accessed: February 28, 2012.
TEIXEIRA, E. A.; NOSSA, V.; FUNCHAL, B. O índice de sustentabilidade empresarial (ISE) e os impactos no endividamento e na percepção de risco. Revista de Contabilidade & Finanças, São Paulo, v. 22, n. 55, p. 29-44, jan./abr. 2011. ZIEGLER, A. Is it beneficial to be included in
a sustainability stock index? A panel data study
for European Firms. Oct. 2009. Available at: <http://ssrn.com/abstract=1498568>. Accessed: February 12, 2012.
_____; Schröder, M. What determines the
inclusion in a sustainability stock index? A panel
data analysis for European Companies. 2006. Available at: <http://ssrn.com/abstract=913944>.