1. Introduction
Increasingly, businesses are being pressured to address environmental and social responsibility performance in addition to the traditional financial performance. The driving force of this trend is the increasing environmental and social risk costs that adversely impact the financial bottom line. This phenomenon has been mainly driven by the legislation as resulting of the need to conserve natural resources and minimize negative impacts, to achieve a balance among economic efficiency and labor productivity, the use of renewable natural resources and non-renewable, to foster social development arising from the organizations’ performance.
Corporate sustainability (CS) concept has been introduced in the last decade: “[...] demonstrate the inclusion of social and environmental concerns in business operations and in interactions with stakeholders” (Van Marrewijk, 2003, p. 102). CS is a multidimensional concept which includes: business strategies, financial returns, costumer’s satisfaction, stakeholder’s interests, internal process and human factor. Translate this idea in the daily operations of organizations is not an easy task.
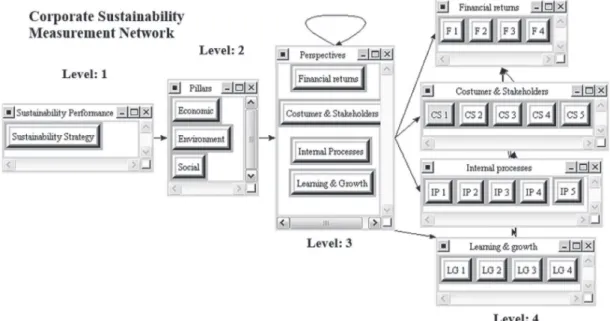
The paper expose the combination of different concepts and tools (see Figure 1) that helps to make operatives corporate sustainability and sustainability
Received: Jan. 15, 2015; Accepted: Mar. 15, 2016
Sustainability performance measurement with
Analytic Network Process and balanced scorecard:
Cuban practical case
Frank Medel-Gonzáleza*, Lourdes Francisca García-Ávilaa, Valério Antonio Pamplona Salomonb,
Jorge Marx-Gómezc, Cecilia Toledo Hernándezd
aUniversidad Central “Marta Abreu” de las Villas, Santa Clara, Cuba
bUniversidade Estadual Paulista, Guaratinguetá, SP, Brasil
cCarl von Ossietzky Oldenburg University, Oldenburg, Germany dUniversidade Federal Fluminense, Volta Redonda, RJ, Brasil
Abstract
The recent years has arisen a global discussion in relation with how to incorporate sustainability at a business level. Corporate sustainability is a multidimensional concept, is the translation of Sustainable Development concept at a business level. Sustainability in organizations must be managed and assessed by decision makers, for that reason a multi-criteria sustainability performance measurement is necessary. The aim of this paper is combine different important tools that helps to make operative corporate sustainability and sustainability performance measurement in Cuban organizations. The combination of Sustainability Balanced Scorecard, multi-criteria decisions models like: Analytic Network Process, and Matrix of Sustainable Strategic Alignment, can help managers in sustainability performance measurement and assessment. The result of this paper focus in a Corporate Sustainability Measurement Network design as a first approach for further sustainability performance measurement systems development emphasizing in multi-criteria analysis.
Keywords
performance measurement since the multidimensional characteristic of these concept.
This work aims to present our application of a multidimensional network approach related sustainability performance measurement in organizations, combining existing and probed tools like Balanced Scorecard (Kaplan & Norton, 1996b), Analytic Network Process/ Analytic Hierarchy Process (Saaty, 1996; Saaty
& Vargas, 2006) and Matrix of Sustainable Strategic Alignment (MSSA) (Oliveira et al., 2012). A generic network is presented as initial Corporate Sustainability Measurement Network (CSMN) model, combining economic, environmental, social, stakeholders, internal and external issues.
The article is structured in logical parts, after the introduction it presents: i) Literature review: different concepts and tools where explored for their relevance in relation with the topic; ii) The Corporate Sustainability Measurement Network Design: this section shows the network designed based in tools and concepts of the previous section and the equations to calculate the Corporate Index of Sustainability Performance (CISP); iii) Practical application: this section is the practical application of the network designed and the CISP. The indicators selection, the
data collection and weight process with ANP/AHP were performed in this section; iv) Limitations and v) Conclusions of the study.
2. Literature review
2.1. Corporate sustainability and
sustainability management
measuring organizational performance including social, and environmental dimensions in addition to the traditional financial dimension. TBL is based on the idea that a firm should measure its performance in relation to stakeholders including local communities and governments, not just those stakeholders with whom it has direct, transactional relationships (such as employees, suppliers and customers) (Hubbard, 2009). TBL concept proposed by Elkington (1997) is the basic concept used to measure sustainability in three orientations namely environment, economy and society (Vimal & Vinodh, 2013).
The TBL mark an inflection point in relation with Sustainable Development concept at corporate level. A second generation of CS definitions arose like: “Is a broad approach that includes various characteristics, in particular relating to the contextual integration of economic, environmental and social aspects” (Möller
& Schaltegger, 2005). Others like SAP Company, defines sustainability in a business environment. Sustainability requires us to consider environmental, social, and economic aspects at the same time. If you are able to manage the risks and the opportunities holistically, it will lead to increased business success in turn (Seidel, 2013).
Corporate sustainability is not a new concept, but, sustainability management can be considered as a relatively new one. The sustainability management is the formulation, implementation, and evaluation of both, environmental and socioeconomic sustainability related decisions and actions (Starik & Kanashiro, 2013). The main objective of corporate sustainability management is balancing the organizational performance in the economic, social and environmental improvement opportunities identified simultaneously (Figge et al., 2002; Lee & Farzipoor Saen, 2012; Schaltegger & Burritt, 2005).
In the last years has arisen different frameworks and tools to integrate sustainability assessment but “there is still no comprehensive framework exist for integrated sustainability assessment at company level (Singh et al., 2007). Other research like (Zamcopé et al., 2012), recommends the development of information technology tools that integrate the use of various software’s to build the model.
In Cuba specifically, business performance is not looked as a sustainable performance and the lack of tools to balance the business performance is real problem right now. Despite of recent efforts like: the “National program of consumption, sustainable production and efficient use of resources from 2010 to 2015” and “Guidelines of the Economic and Social Policy of the Revolution”, there are still enormous gaps in relation to sustainable performance evaluation as an internal management process for
organizations, to enable the decision-making process based on key information associated with sustainable business behavior.
2.2. Analytic hierarchy process and Analytic
Network Process
Multi-criteria decision-making (MCDM) can be useful in environmental systems analysis to evaluate a problem by giving an order of preference for multiple alternatives on the basis of several criteria that may have different units (Hermann et al., 2007). The purpose of an MCDM is to compare and rank alternative options and to evaluate their consequences according to the criteria established (Zopounidis & Doumpos, 2002). In recent years several tools and multi-criteria methods have been widely used to support research in the area of environmental and sustainability engineering, all demonstrating their feasibility for this type of study.
Analytic Hierarchy Process (AHP) was created by professor Thomas L. Saaty (Saaty, 1996), this method combines qualitative and quantitative factors in the selection process and is used to prioritize issues in a complex situation, where several factors are involved. This method allows the quantification of the relative priority of each alternative on a scale, which emphasizes the importance of intuitive decision makers and the consistency of their judgments. AHP provide a flexible analysis and easy to understand complex problems using a hierarchical structure.
The AHP has been widely used in sustainability assessment, based in the multidimensional nature of the concept, see (Hermann et al., 2007; Krajnc & Glavič, 2005; Singh et al., 2007). The sustainability indicators weights are generally obtained using the decision method AHP (Saaty & Vargas, 2012). Despite the wide acceptance of the AHP, this gives an unrealistic view of natural phenomena that sometimes tend to be more complex, with a greater number of relationships converting the model into a complex structure.
without the need to specify levels. As in the AHP, the domination or influence the relative importance of a central concept, the widely publicized theory multi-criteria AHP is a special case of the ANP.
The ANP is composed of two parts:
• Control of hierarchy or network objectives and criteria that control the interactions of the system under study.
• Many subnets of influences between all elements and groups of the problem, one for each control criteria.
The difference between a hierarchy and a network is visible. Hierarchy shows a linear structure from top to bottom without dependency ratios lower to higher levels. The ANP has a network structure that allows the analysis of dependence among elements of the model, which make it more powerful in uncertain situations and let the problem analyzed closer to reality.
Corporate Sustainability issues have a multidimensional nature and Multi-criteria Decisions Making and Analysis (MCDM/MCDA) had been used for sustainability evaluation. The literature provide examples primarily in three directions:
1) The use of MCDM/MCDA to select the best alternative for the organization considering economic, social and environmental criteria’s.
Dinh et al. (2009) suggest a systematic method based on AHP technique to compare biodiesel feedstock alternatives on technical, economical, and sustainable aspects throughout life cycles of biodiesel production. Other research (Barata et al., 2014) proposed a multiple-criteria approach (ELECTRE TRI) to classifying representative set of companies which are suppliers of the Brazilian petroleum industry, according the degree of organizational sustainability.
2) Use the combination of MCDM/MCDA with variables and indicators of the business to evaluate business sustainability.
Krajnc & Glavič (2005) designed a model for obtaining a composite sustainable development index in order to track integrated information on economic, environmental, and social performance of the company using AHP for indicators weigths. Others like Zamcopé et al. (2012) proposed the development of an assessment model for corporate sustainability; the Multi-Criteria for Decision Aid - Constructivist (MCDA-C) methodology was used, enabling to identify a set of performance indicators that features the company’s sustainability. Other example is the research of Singh et al. (2007) it presents a conceptual decision model, using AHP to assist in evaluating the impact of an organization’s sustainability performance.
3) Use of MCDM/MCDA to help in the sustainability indicators selection process. Some examples are can be appreciated in (Dale et al., 2015; Ocampo et al., 2015).
MCDA has been regarded as a suitable set of methods to perform sustainability evaluations as a result of its flexibility and the possibility of facilitating the dialogue between stakeholders, analysts and scientists (Cinelli et al., 2014). All this previous papers evidence the feasibility to combine sustainability evaluation and MCDM/MCDA in different directions with different methodologies.
2.3. Sustainability performance
measurement systems
The Performance Measurement Systems (PMS) is defined as the set of metrics used to quantify both the efficiency and effectiveness of actions (Neely et al., 1995). A successful PMS is a set of performance measures (i.e. a metric used to quantify the efficiency and effectiveness of action) that provides a company with useful information that helps to manage, control, plan and perform the activities undertaken in the company (Tangen, 2005). Tangen (2005) define three classes of PMS: third class, where mostly traditional performance measures are used and the requirements of the systems are rather low; second class, has a much more balanced view on performance than the previous class non-financial measures are used and different time horizons are considered; first class, they are the most advanced covering great quantity of requirements, able to explain causal relationships in the organization, considering the necessities of the stakeholders and integrating databases and systems of information.
Sustainability performance measurement systems (SPMS) is
[...] a system of indicators that provides a corporation with information needed to help in the short and long-term management, controlling, planning, and performance of the economic, environmental, and social activities undertaken by the corporation [...] (Searcy, 2012, p. 240).
An especial difference exists between SPMS and the traditional PMS. In SPMS it is necessary to quantify the long term sustainability value creation and must be focused in sustainability relevant issues for business and address economic, environmental and social aspects, bringing into the business stakeholder interest. The literature review shows some examples of systems to manage and measure sustainability applied in different sectors like (Hubbard, 2009; Krajnc
& Glavič, 2005; Singh et al., 2007; Zamcopé et al., 2012; Zhou et al., 2012).
Recent studies define a new type of system that includes supply chain and sustainability context, see (Searcy, 2016). Because the term sustainability must go beyond the organization, it interacts with society, stakeholders and other organizations, the new denomination is called Enterprise Sustainability Performance Systems Measurement (ESPMS).
2.4. Sustainability Balanced Scorecard
The Sustainability Balanced Scorecard (SBSC) is one of the most popular tools used to address sustainability in organizations (Epstein & Wisner, 2001; Figge et al., 2002; Hubbard, 2009; Möller
& Schaltegger, 2005). SBSC is a type of Balanced Scorecard, specifically designed to reflect the issues and objectives of corporate sustainability. In order to clarify appropriate sustainability strategies and translate them into action, it is generally recommended that managers first design a separate SBSC. This must then be integrated into the traditional Balanced Scorecard (BSC) in order to ensure a holistic view of sustainability. This process will help to overcome the distinction between a traditional financially oriented management approach and emphasizing sustainability or environmental management concerns (Figge et al., 2002).
The term “balanced” refers to a “balance between external measures for shareholders and customers, and internal measures of critical business processes, innovation, and learning and growth (Möller & Schaltegger, 2005). All stakeholder interests, when they are vital for the success of the business unit’s strategy, can be incorporated in a Balanced Scorecard (Kaplan & Norton, 1996a).
Hansen identifies four basic approaches in the literature in (Hansen, 2010) of how to include environmental and social issues in a SBSC:
• integrating environmental and social aspects into the four standard perspectives see (Epstein & Wisner, 2001; Figge et al., 2002);
• adding further perspectives to the standard BSC layout to take up sustainability issues (Hubbard, 2009);
• changing the original hierarchy and replacing the financial perspective with a sustainability perspective;
• adding further perspectives to guide the financial perspective at the top (Woerd & Brink, 2004).
The SBSC supports the management processes which is necessary to deal with corporate sustainability challenges (Medel et al., 2011). SBSC facilitates the development in an active way, of a new dynamic control in organizations impelling the coordination and the complementarities among the different areas of the company and allowing the sustainability strategy of the business.
3. Corporate sustainability measurement
network
The combination of tools analyzed in previous sections, can be wisely used to design a sustainability performance measurement system to assess the strategy and achieve business long term value generation.
The model proposed to CSMN (see Figure 2) have four levels well defined, independent of being a network. The first level are the sustainability strategies define by the organizations; the second level is formulated with the three pillars of sustainability, when the strategically objectives are clarify and derivate from the overall corporate sustainability strategy; the third level is design using the idea of SBSC, for this case the equal numbers of perspective of traditional BSC are used; the fourth level will be located in the bottom of the network and respond to operational issues related with sustainability objectives.
For example in the second level the sustainability pillars have not the same preference for all the organizations in relation with their sustainability strategy, based in organization sector, the legislation associated, the stakeholder’s interest, government etc.
Relations between second and third level are important and is supported by the idea of inclusion of sustainability issues over the four perspectives. The use of Matrix of Sustainable Strategic Alignment suggested by Oliveira et al. (2012) is essential to clarify the relations between perspectives and pillars.
The matrix consists in the macro-objectives association, integrating the strategic aspects of SBSC into the three pillars of Sustainability (Oliveira et al., 2012). To apply this matrix to CSMN the concept must be reorder “the macro-objectives association
that integrate the sustainability strategic aspects into SBSC perspectives”. The Table 1 present the matrix with generic strategic objectives, each cell could have more than one objective, every objective need an indicator to be measure.
Sustainability pillars have not de same preference for all the organizations, based in organization sector, legislation associated, stakeholder’s interest, etc. Equally, pillars does not have the same influence over de SBSC perspectives.
The fourth level of the CSMN is composed by operative indicators associated with the main strategies distributed over the four perspectives of SBSC. The indicators can have relationships with others and this can be represented in the network with arrows amongst the groups of fourth level.
CSMN intent to be a valuable tool for Cuban organizations, in order to measure and identify progress and setbacks in corporate sustainability performance; combining qualitative data (expert’s judgments) and quantitative data (operational indicators). To accomplish this goal based in the CSMN was developed a composite sustainability index to help in the decision making process.
For composite sustainability index construction “the recommended construction frame is: the ‘distance to a reference’ normalization method in combination with the ‘benefit of the doubt’ and LIN (linear aggregation)” (Zhou et al., 2012). This recommendation was made over the base of a study to determine the best scheme for constructing composite indexes.
The CISP is based on the CSMN and follow the suggested construction frame recommended by Zhou et al. (2012). The first step was the indicators selection, judgments of indicator´s impact and the data collection. The second big step was the indicators normalization process with the distance to a reference (or goal), the normalization can be done through the Equation 1.
ij
if x satisfies the condition " "
1 if x max " "
min
if x satisfies the condition " "
ij ij ij ij ij ij ij x max x x x x ≥ =
the larger is better
the larger is better
thesmaller is better
ij
R
ij
1 if x min xij " "
≤
thesmaller is better
(1)
Rij: Rate or normalized indicator i of the perspective j.
xij: value of the indicator to normalize.
max[xij]: reference or goal to achieve.
min[xij}: reference or goal to achieve.
i = number of the perspective: of 1 at 4.
j= number of the indicator: of 1 to n.
The weighting step of all nodes will be done using ANP/AHP and the aggregation can be expressed by Equation 2 as a linear aggregation.
4 1 * j j j j
CISP Wp SIp
=
=
=
∑
(2)CISP: Corporate Index of Sustainability Performance. Wpj: The relative weight of the perspective j (level 3). Sipj: Sub index of perspective j.
The CISP have four sub-indexes who coincide with the nodes of the level three (Equation 3):
1 * i n
j ij ij
i
SIp Wi R
=
=
=
∑
(3)Wiij: The relative weight of the indicator i in the perspective j (level 4).
Rij: Rate or normalized value of the indicator i of the perspective j (quantitative data).
Other complementary concept is introduced to complement the CISP and is the Improvement Potentials (Equation 3), it has the objective to identify the most negatives and influents indicators in relation with the CISP value.
(
)
*ij i ij* 1 ij
Improvment Potentials =wp wi −r (4)
The software Superdecisions is used to calculate the relative weights of indicators and perspectives using the judgments of an experts group.
4. Practical application
The study to apply CSMN and CISP was developed in four distributed generation power plants (PP) of the energy sector, one of the four key sectors inside Cuban economy.
The indicators were selected using the standard ISO 14031 and GRI aligning those with the organization strategy. The strategy was split using the MSSA (see Table 2)
Derivate of this MSSA were selected different indicators to track the objectives. The selections of Table 1. Matrix of Sustainable Strategic Alignment.
Pillars Social Economic Environmental
Financial returns
Distribution profit to stakeholders (suppliers, distributors, communities, and other stakeholders)
Create structures that supports other activities in the region
Maximization of profits Revenue maximization
Technology investments aligned to the concepts of clean productions and innovation
Participation in sustainability indexes Participation in the program of carbon credits
Costumer´s satisfaction &
stakeholders interest´s
Increased external perception about its social commitment through the development of social programs with public agencies or private
Increased participation in the market
Customer retention Identifying new markets
Increased external perception about its environmental commitment with environmental programs
Internal processes
Transparent, ethical and fair treatment in intra-organizational relationships (selection, assessment and contact with all stakeholders)
Optimization of production processes internal and external Standardization establishment, reducing errors and waste
Demands of environmentally sound practices in intra-organizational processes
Implementation of environmental standards
Learning &
Growth
Cultural and educational development of the stakeholder process
Investment in the development of necessary and adherent competences to the organization’s results
Understanding, development and multiplication of environmentally responsible culture
indicators were chosen using GRI guidelines and ISO 14031 (Table 3).
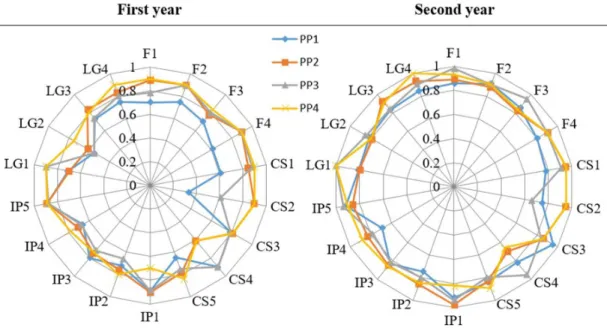
The data of selected indicators were collected in the period of two years. The Figure 3 shows the normalized values of the indicators. To obtain the values was used the equation
Experts in the energy sector, identified relationships among the indicators selected, a kind of causal relationship map of indicators can be observed in Figure 4. This map provided by experts, helps the process of design the level 4 of the network and
permits to capture the importance of the relation of strategic indicators and it is included in the final weights.
For the CISP calculation were emitted the experts judgments in the different levels. The first judgments were related to triple bottom line dimensions importance (level 2) for business and stakeholders (Table 4).
The level 3 include AHP and ANP, AHP to rank the preference of the perspectives in relation with the dimensions (Table 5) to answer the following question: how important are perspectives in the dimensions?
Table 2. Business Strategy split with the Matrix of Sustainable Strategic Alignment.
Pillars Social Economic Environmental
Financial returns •Share part of the business profit for
Government budget.
•Maximization of profits and cost reduction.
•Encourage the development of innovative projects and prioritize investments that foment a better sustainability performance
Costumer´s satisfaction &
stakeholders interest´s
•To prevent the occurrence of environmental and occupational health and safety incidents
•To reduce Power Plant costs for complaints and / or claims of stakeholders and fines impositions for fissures in regulatory compliance
•To comply with all applicable legislation and regulations at national and international levels
Internal processes •Win-win relationships with
communities and stakeholders.
•Efficient use of raw materials and emissions reductions
•To prevent or minimize contamination of the environment.
•Minimization of the negative environmental impacts associated with electricity generation
Learning & Growth •To have a highly qualified and
motivated staff
•Continually improvement of training and environmental information disclosure
•The aware of workers obligations and responsibilities with environmental aspects and impacts associated with their work
•To achieve employee’s commitment with environmental protection issues.
Font: modify of Oliveira et al. (2012).
Table 3. Selected indicators by perspectives.
Perspectives Indicators
Financial returns
F1 MW generation cost ($/MW) F2 Investment in triple bottom line ($/year) F3 Significant fines and non-monetary sanctions (#) F4 Cost related triple bottom line ($/year)
Costumer´s satisfaction & stakeholders interest´s
CS1 Occupational health and safety incidents (#) CS2 Internal or external auditing or verification (#) CS3 Regulatory compliance (%)
CS4 Stakeholders complaints (#)
CS5 Results of surveys measuring customer satisfaction (%)
Internal processes
IP 1 Specific consumption of Fuel or Diesel (gr/kWh) IP 2 Muds and residual waters generated (m3)
IP 3 Water consumption per MW (m3/MW)
IP 4 Noise levels (dB)
IP 5 Greenhouse gas emissions (Kg CO2 e/MW)
Learning & Growth
LG1 Number of employees with environmental requirements in the description of their jobs (#) LG2 Business sustainability improvement solutions generated by workers (#)
LG3 Surveys results of employees about their knowledge related sustainability issues in the organization (%)
LG4 Average hours of training per employee (hours/year)
model defined in SuperDecisions (Figure 2) and the final priorities were calculated (Figure 5).
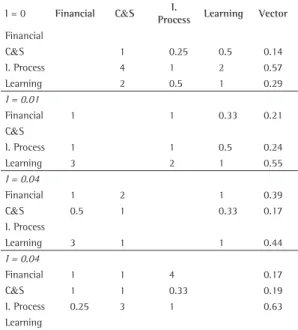
The CISP was calculated for the PP using Equation 2, with the weights of all required nodes and indicators The ANP is used to capture the perspectives interaction
amongst them (Table 6).
Finally in the 4 level AHP was applied to obtain the relative importance of indicators on each perspective (Table 7). Based in the indicators relationships defined in Figure 5, the importance of dependency among different indicators were emitted by the experts judgments (Table 8)
All those judgments were introduced in the Multi-criteria Sustainability Measurement Network
Figure 3. Normalized indicators values of four PP in the first and second year. Font: the authors.
Figure 4. Indicators relationships. Font: the authors.
Table 4. Expert’s judgments of dimensions.
I=0.015 Economic Environmental Social Vector
Economic 1 3 2 0.54
Environmental 0.33 1 1 0.21
Social 0.5 1 1 0.25
normalized values (Figure 6). The sub-indexes by perspectives were calculated to visualize which perspectives have better and worst evaluation (Figure 7).
For one more deep analysis were introduced indicators of improvement potentials to identify which indicators affect more the CISP value (Figure 8).
Those three equations allow the managers do a top-down analysis, since overall analysis with CISP, more detailed analysis is possible displaying the perspectives performance and finally an indicators analysis to identify which indicators affect more the CISP to reorient business efforts. The more distant Table 5. Judgments about the preference of each perspective for dimensions.
I = 0.042 Financial C&S ProcessI. Learning Vector
Economic
Financial 1 2 1 2 0.32
C&S 0.5 1 0.33 2 0.18
I. Process 1 3 1 2 0.36
Learning 0.5 0.5 0.5 1 0.14 I = 0.089
Environment
Financial 1 0.25 0.33 0.33 0.09
C&S 4 1 0.5 3 0.31
I. Process 3 2 1 4 0.45
Learning 3 0.33 0.25 1 0.15 I = 0.017
Social
Financial 1 1 4 3 0.39
C&S 1 1 4 2 0.36
I. Process 0.25 0.25 1 1 0.11 Learning 0.33 0.5 1 1 0.14
Font: the authors.
Table 6. Judgments about perspectives interactions.
I = 0 Financial C&S ProcessI. Learning Vector
Financial
C&S 1 0.25 0.5 0.14
I. Process 4 1 2 0.57
Learning 2 0.5 1 0.29
I = 0.01
Financial 1 1 0.33 0.21
C&S
I. Process 1 1 0.5 0.24
Learning 3 2 1 0.55
I = 0.04
Financial 1 2 1 0.39
C&S 0.5 1 0.33 0.17
I. Process
Learning 3 1 1 0.44
I = 0.04
Financial 1 1 4 0.17
C&S 1 1 0.33 0.19
I. Process 0.25 3 1 0.63
Learning
Font: the authors.
Figure 5. Final priorities of indicators and perspectives. Font: the authors.
Figure 6. CISP behavior in the PPs during two years. Font: the authors.
very difficult to achieve the consensus amongst the experts, because there were seven experts and the brain storming takes five longs work sessions. Other limitation of the application was the ANP model, it is design in a way that the sensitive analysis can’t be done. Maybe in the near future this limitation could be solved splitting the model and apply sensitive analysis to the indicators and perspectives weights separately. of the center of the graphic are the indicators with
major numerical influence on CISP.
5. Limitations
In the course of the application process, limitations were identify in the Multi-criteria Sustainability Measurement Network. The judgments process was Figure 8. Indicators improvements potentials. Font: the authors.
Table 7. Indicators preference on each perspective.
0,09 F1 F2 F3 F4 Vector 0,07 CS1 CS2 CS3 CS4 CS5 Vector
F1 1 0.25 0.33 0.5 0.1 CS1 1 2 0.5 0.33 1 0.14
F2 4 1 4 2 0.47 CS2 0.5 1 0.25 0.5 0.25 0.08
F3 3 0.25 1 0.33 0.15 CS3 2 4 1 2 2 0.35
F4 2 0.5 3 1 0.28 CS4 3 2 0.5 1 2 0.26
CS5 1 4 0.5 0.5 1 0.17
0,074 LG1 LG2 LG3 LG4 Vector 0,08 IP1 IP2 IP3 IP4 IP5 Vector
LG1 1 0.25 3 0.5 0.09 IP1 1 0.5 1 2 1 0.19
LG2 4 1 2 2 0.42 IP2 2 1 0.5 3 2 0.26
LG3 0.33 0.5 1 4 0.34 IP3 1 2 1 2 3 0.30
LG4 2 0.5 0.25 1 0.15 IP4 0.5 0.33 0.5 1 2 0.13
IP5 1 0.5 0.33 0.5 1 0.12
Font: the authors.
Table 8. External indicators dependency.
I = 0 IP3 IP5 Vector I = 0 CS1 CS3 Vector
LG4
IP3 1 4 0.8
IP4
CS1 1 5 0.83
IP5 0.25 1 0.2 CS3 0.2 1 0.17
I = 0 IP2 IP5 Vector I = 0 F3 F4 Vector
LG3
IP2 1 6 0.86
IP4 F3 1 5 0.83
IP5 0.17 1 0.14 F4 0.2 1 0.17
I = 0 CS2 CS3 Vector I = 0 CS2 CS3 Vector
LG2
CS2 1 0.33 0.25
IP2
CS2 1 0.33 0.25
CS3 3 1 0.75 CS3 3 1 0.75
I = 0 F2 F3 Vector I = 0 F3 F4 Vector
CS5
F2 1 1 0.5
CS3
F3 1 3 0.75
F3 1 1 0.5 F4 0.33 1 0.25
decision-making. Environmental Progress & Sustainable Energy, 28(1), 38-46. http://dx.doi.org/10.1002/ep.10335. Elkington, J. (1997). Cannibals with forks: the triple bottom
line of 21st century business. Capstone: Oxford. Epstein, M. J., & Wisner, P. S. (2001). Using a balanced
scorecard to implement sustainability. Environmental Quality Management, 11(2), 1-10. http://dx.doi.org/10.1002/ tqem.1300.
Figge, F., Hahn, T., Schaltegger, S., & Wagner, M. (2002). The sustainability balanced scorecard -linking sustainability management to business strategy. Business Strategy and the Environment, 11(5), 269-284. http://dx.doi. org/10.1002/bse.339.
Hansen, E. G. (2010). Responsible leadership systems: an empirical analysis of integrating corporate responsibility into leadership systems. Wiesbaden: Springer Glaber. Hermann, B. G., Kroeze, C., & Jawjit, W. (2007). Assessing
environmental performance by combining life cycle assessment, multi-criteria analysis and environmental performance indicators. Journal of Cleaner Production, 15(18), 1787-1796. http://dx.doi.org/10.1016/j.jclepro.2006.04.004. Hsu, C.-W., Hu, A. H., Chiou, C.-Y., & Chen, T.-C. (2011). Using
the FDM and ANP to construct a sustainability balanced scorecard for the semiconductor industry. Expert Systems with Applications, 38(10), 12891-12899. http://dx.doi. org/10.1016/j.eswa.2011.04.082.
Hubbard, G. (2009). Measuring organizational performance: beyond the triple bottom line. Business Strategy and the Environment, 18(3), 177-191. http://dx.doi.org/10.1002/ bse.564.
Kaplan, R., & Norton, D. (1996a). The strategy-focused organization: how balanced scorecard companies thrive in the new business environment. Boston: Harvard Business School Press.
Kaplan, R. S., & Norton, D. P. (1996b). Using the balanced scorecard as a strategic management system. Boston: Harvard Business Review.
Krajnc, D., & Glavič, P. (2005). A model for integrated assessment of sustainable development. Resources, Conservation and Recycling, 43(2), 189-208. http://dx.doi.org/10.1016/ S0921-3449(04)00120-X.
Lee, K.-H., & Farzipoor Saen, R. (2012). Measuring corporate sustainability management: a data envelopment analysis approach. International Journal of Production Economics, 140(1), 219-226. http://dx.doi.org/10.1016/j.ijpe.2011.08.024.
Medel, F., García, L., Enriquez, S., & Anido, M. (2011).
Reporting models for corporate sustainability in SMEs. In P. Golinska, M. Fertsch & J. Marx-Gómez (Eds.), Information technologies in environmental engineering (pp. 407-418). Heidelberg: Springer.
Möller, A., & Schaltegger, S. (2005). The sustainability balanced scorecard as a framework for eco-efficiency analysis. Journal of Industrial Ecology, 9(4), 73-83. http://dx.doi. org/10.1162/108819805775247927.
Neely, A., Gregory, M., & Platts, K. (1995). Performance measurement system design: a literature review and research agenda. International Journal of Operations & Production Management, 15(4), 80-116. http://dx.doi. org/10.1108/01443579510083622.
Ocampo, L., Vergara, V. G., Impas, C., Tordillo, J. A., &Pastoril,
J. (2015). Identifying critical indicators in sustainable manufacturing using analytic hierarchy process (AHP).
6. Conclusions
CS is a multidimensional concept and it requires proper tools to manage the diverse issues related. The paper explored different tools like: SPMS, Sustainability Balanced Scorecard, Matrix of Sustainable Strategic and Alignment, and ANP; those were merged in a Corporate Sustainability Measurement Network to cover partially an enormous gap in relation to sustainable performance evaluation as an internal management process for Cuban organizations. The combination of this tools differs from previous research and establish a practical and structured approach to deliver helpful information about the business behavior.
The CSMN designed was oriented principally to track the translation of business strategies using an indicators systems. The indicators and perspectives were weighted taking in consideration their relevance and was included in the CISP value according with the multidimensional characteristic of Corporate sustainability.
The three indexes defined allows the managers do a top-down analysis, an strategic analysis with CISP, more detailed analysis is possible displaying the Sub index of perspectives for tactical analysis and at operative level, the indicators analysis to identify which ones affect more the CISP to reorient business efforts.
The application of the model in four Cuban small power plants permitted prove its feasibility of implementation as a methodological tool to evaluate sustainability performance and identify critical issues and opportunities for improvement allowing the business to focus efforts on the main issues.
Acknowledgements
This work is funded by the Eureka SD project (agreement number 2013-2591), that is supported by the Erasmus Mundus program of the European Union.
References
Barata, J. F. F., Quelhas, O. L. G., Costa, H. G., Gutierrez, R. H., de Jesus Lameira, V., &Meiriño, M. J. (2014). Multi-criteria indicator for sustainability rating in suppliers of the oil and gas Industries in Brazil. Sustainability, 6(3), 1107-1128. http://dx.doi.org/10.3390/su6031107. Cinelli, M., Coles, S. R., & Kirwan, K. (2014). Analysis of the
potentials of multi criteria decision analysis methods to conduct sustainability assessment. Ecological Indicators, 46, 138-148. http://dx.doi.org/10.1016/j.ecolind.2014.06.011. Dale, V. H., Efroymson, R. A., Kline, K. L., & Davitt, M. S.
(2015). A framework for selecting indicators of bioenergy sustainability. Biofuels, Bioproducts & Biorefining, 9(4), 435-446. http://dx.doi.org/10.1002/bbb.1562.
for steel industry. Ecological Indicators, 7(3), 565-588. http://dx.doi.org/10.1016/j.ecolind.2006.06.004. Starik, M., & Kanashiro, P. (2013). Toward a theory of
sustainability management: uncovering and integrating the nearly obvious. Organization & Environment, 26(1), 7-30. http://dx.doi.org/10.1177/1086026612474958. Steurer, R., Langer, M. E., Konrad, A., & Martinuzzi, A. (2005).
Corporations, stakeholders and sustainable development I: a theoretical exploration of business–society relations. Journal of Business Ethics, 61(3), 263-281. http://dx.doi. org/10.1007/s10551-005-7054-0.
Tangen, S. (2005). Analysing the requirements of performance measurement systems. Measuring Business Excellence, 9(4), 46-54. http://dx.doi.org/10.1108/13683040510634835. Van Marrewijk, M. (2003). Concepts and definitions of CSR and
corporate sustainability. Journal of Business Ethics, 44(2), 95-105. http://dx.doi.org/10.1023/A:1023331212247. Vimal, K. E. K., &Vinodh, S. (2013). Development of checklist
for evaluating sustainability characteristics of manufacturing processes. International Journal of Process Management and Benchmarking, 3(2), 213-232. http://dx.doi.org/10.1504/ IJPMB.2013.057726.
Woerd, F. D., & Brink, T. (2004). Feasibility of a Responsive Business Scorecard: a pilot study. Journal of Business Ethics, 55(2), 173-186. http://dx.doi.org/10.1007/s10551-004-1900-3.
World Commission on Environment and Development – WCED. (1987). Our common future. Oxford: Oxford University Press. Zamcopé, F. C., Ensslin, L., & Ensslin, S. R. (2012). Development
of a model for corporate sustainability assesment. Production, 22(3). http://dx.doi.org/10.1590/S0103-65132012005000048. Zhou, L., Tokos, H., Krajnc, D., & Yang, Y. (2012). Sustainability
performance evaluation in industry by composite sustainability index. Clean Technologies and Environmental Policy, 14(5), 789-803. http://dx.doi.org/10.1007/s10098-012-0454-9. Zopounidis, C., & Doumpos, M. (2002). Multicriteria classification
and sorting methods: a literature review. European Journal of Operational Research, 138(2), 229-246. http://dx.doi. org/10.1016/S0377-2217(01)00243-0.
Manufacturing and Industrial Engineering, 14(3-4). http:// dx.doi.org/10.12776/mie.v14i3-4.444.
Oliveira, L. R., Medeiros, R. M., Bragança-Terra, P., & Gonçalves-Quelhas, O. L. (2012). Sustainability: the evolution of concepts to implementation as strategy in organizations. Production, 22(1), 70-82. http://dx.doi.org/10.1590/ S0103-65132011005000062.
Saaty, T. L. (1996). Decision making with dependence and feedback: the analytic network process (Vol. 4922). Pittsburgh: RWS Publications.
Saaty, T. L., & Vargas, L. G. (2006). Decision making with the analytic network process. London: Springer.
Saaty, T., & Vargas, L. (2012). The seven pillars of the analytic hierarchy process models, methods. Concepts & Applications of the Analytic Hierarchy Process, 175, 23-40. http://dx.doi. org/10.1007/978-1-4614-3597-6_2.
Schaltegger, S., & Burritt, R. (2005). Corporate sustainability. In H. Folmer (Ed.), The international yearbook of environmental and resource economics 2005/2006: a survey of current issues (New Horizons in Environmental Economics Series, 185). Cheltenham: Edward Elgar Publishing.
Schaltegger, S., & Wagner, M.(2006). Managing sustainability performance measurement and reporting in an integrated manner. sustainability accounting as the link between the sustainability balanced scorecard and sustainability reporting. In S. Schaltegger, M. Bennett & R. Burritt (Eds.), Sustainability accounting and reporting (Vol. 21, pp. 681-697). Dordrecht: Springer.
Searcy, C. (2012). Corporate sustainability performance measurement systems: a review and research agenda. Journal of Business Ethics, 107(3), 239-253. http://dx.doi. org/10.1007/s10551-011-1038-z.
Searcy, C. (2016). Measuring enterprise sustainability. Business Strategy and the Environment, 25(2), 120-133. http:// dx.doi.org/10.1002/bse.1861.
Seidel, A.-P. D. S. (2013). Interview with Daniel Schmid on “Sustainability and the Role of IT”. Business & Information Systems Engineering, 5(5), 327-329. http://dx.doi. org/10.1007/s12599-013-0287-z.