This paper may be copied, distributed, displayed, transmitted or adapted if provided, in a clear and explicit way, the name of the journal, the edition, the year and the pages on which the paper was originally published, but not suggesting that RAM endorses paper reuse. This licensing term should be made explicit in cases of reuse or distribution to third parties. It is not allowed the use for commercial purposes.
This is an open-access article distributed under the terms of the Creative Commons Attribution License.
MANAGERIAL COMPETENCIES AND
RESULTS IN RESEARCH GROUPS
PABLO F. P. DE FREITAS1 https://orcid.org/0000-0003-0369-0783
CATARINA C. ODELIUS1
https://orcid.org/0000-0002-2152-5194
To cite this paper: Freitas, P. F. P., & Odelius, C. C. (2018). Managerial competencies and results in
research groups. Revista de Administração Mackenzie, 19(5). doi:10.1590/1678-6971/eRAMG180034
Submission: Mar. 26, 2018. Acceptance: July 1, 2018.
1
2
ABSTRACT
Purpose: The aim of this paper is to identify relationships between “managerial competencies” (MCs) and the resulting extension in Brazilian “research groups” (RGs), as well as differences resulting from sociodemographic/functional characteristics.
Originality/value: Just like general organizations, RGs need to invest in aspects that enhance their results, taking more strategic approaches to efficiently gather and manage resources and establish networks and partnerships, features that are influenced by the leader’s competencies, which are not always satisfactorily displayed. In addition, the study is innovative in applying a scale of results in RGs (for the first time), identifying their relationships with MCs.
Design/methodology/approach: We employed the Correlation Analysis (Kendall-Tau) and Difference tests between medians (Mann-Whitney and Kruskall-Wallis) from the questionnaires electronically completed by 387 RG leaders who accepted the invitation that was sent to 6,723 researchers.
Findings: The study was based on scales with validity evidence, and its findings indicate that to achieve better results, it is not enough for the RGs leaders to control the management of people and research results; they also need to dedicate themselves to gathering resources and people because these MCs are more related to results in RGs. We also identified differences resulting from educational level, gender, scholarship grants, knowledge area, and/or research experience and group relation time.
KEYWORDS
3
1. INTRODUCTION
It is expected that organizations will engage in the achievement of more and more meaningful results, and researchers are encouraged to identify features that improve organizational results. Among such features, we find “managerial competencies” (MCs), which prove to be fundamental when creating or maintaining opportunities to generate competitive advantages aligned with the strategic vision of an organization. The same occurs with “research groups” (RGs) related to research universities and institutes that, in order to train their members and leverage research, have invested in a more strategic approach on the part of their leaders, allowing for efficient resource management, fundraising and establishment of networks and partnerships (Berche, Holovatch, Kenna, & Mryglod, 2016; Bueno, 2014; Harvey, Pettigrew, & Ferlie, 2002).
However, the relationship between mastery of competencies and results is not always properly articulated in the literature (Brandão, Borges-Andrade, & Guimarães, 2012; Santos, Caetano, & Jesuíno, 2008). General studies that simultaneously deal with MCs and organizational results are rare, and their results are not uniform: while some indicate only small positive relationships between the phenomena, others did not even present statistically significant relationships (Brandão et al., 2012).
Therefore, it is recommended that research is done to verify how managerial practices actually modify organizational results (Brito-de-Jesus et al., 2016), including in the RG context, since the theoretical association between these variables is usually present in the literature (Bueno, 2014; Harvey et al., 2002). The purpose of this paper is therefore to identify existing relationships between the MCs and the resulting scope of Brazilian RGs, as well as eventual differences resulting from sociodemographic or functional characteristics.
4
mentioning that, in a systemic perspective, the RG may be analyzed both as a group, due to its relationship with greater institutions, and as an organization—thus highlighting its autonomous character and its internal subdivision (Sierra-Flores & Russell-Barnard, 2009). Therefore, the RG results may be compared to organizational results.
Some of the things that are considered as RG results are the integration of teaching, research, and academic extension (Backes et al., 2012; Riquelme & Langer, 2010); the connection between the research system and the wishes of funding institutions (Pereira & Andrade, 2008; Santana, Silva, Sobral, & Ferreira, 2014; Sutton, 2010); and the industrial, governmental, environmental, and social applications resulting from their actions (Araujo, Mascarini, Santos, & Costa, 2015; Backes et al., 2012; Caliari, Santos, & Mendes, 2016; Garcia, Araújo, Mascarini, Santos, & Costa, 2014; Ramos--Vielba, Sánchez-Barrioluengo, & Woolley, 2016; Riquelme & Langer, 2010). The problem that this study has to deal with is directly related to the scope of these results in RGs, which depend on the actions of the RG leaders who, generally, are research teachers working in public universities and who had competence for teaching and research but not for acting as managers. Therefore, knowing that the MCs are relevant to obtaining RG results may contribute to defining policies and actions that can promote managerial development for current and future leaders.
Some authors even recommend research of MCs’ influence in the RG context, including Higuita-López, Molano-Velandia, and Rodríguez-Merchán (2011), who suggest a deeper study of the general competencies of RG members, including leadership; and Haythornthwaite (2006), who proposes studies on managerial competencies that are necessary for the leaders to conduct research projects.
5
In addition, it is even expected that the results found will generate some debate on the need for training researchers regarding the mastery of MCs (which transcend technical competencies related to the research itself). It is important to draw more attention from educational and funding institutions to this reality (Bueno, 2014; Odelius et al., 2011).
Institutionally, this research is aligned and justified by its contribution to the Brazilian policies of scientific, technological and innovation research, under the responsibility of the Ministry of Science, Technology, Innovation and Communication (Ministério da Ciência, Tecnologia, Inovações e Comunicações [MCTIC]) and the CNPq, regarding the education of researchers and group leaders, from the identification of the behaviours that indicate MCs dominance in RGs, contributing, therefore, to the fulfilment of the function of promoting economic and social development in Brazil, generating benefits to the society.
After defining the context, problem, objectives, justification, and gaps indicated by other researchers, this article includes a brief theoretical framework (MCs and Results in RGs); method; presentation and discussion of the results of correlational analysis and non-parametric tests; and final considerations.
2. MANAGERIAL COMPETENCIES IN RESEARCH GROUPS
Starting from the behavioral assumption in 1982, Richard Boyatizis was the first person to coin the expression “managerial competencies” as referring to observable behaviors of managers who lead organizations to higher levels of performance (Wickramasinghe & Zoyza, 2008). Since it aggregates constitutive elements included in several studies, this article will be guided by Freitas’ (2016) definition of MCs:
Managerial competencies are observable or potential behaviours whereby managers, as individuals, could demonstrate not only their knowledge, skills, attitudes or the synergy among them, but also their personal attributes, adding value and better results to themselves, other individuals and teams, departments, organizations or networks, in harmony with the context, available resources and adopted strategy (Freitas, 2016, p. 26).
6
Quinn (1995), based on the Quinn model (1988) and used by several researchers, such as Vilkinas (2000), Paiva and Ferreira (2013) and Paiva, Santos and Lacerda (2014). However, in contrast to the adopted definition of MCs, the instrument referred to is composed of items that are very generic, transversal and oblivious to the context. Thus, we decided to use the ‘Scale of Managerial Competencies in RG’ by Freitas and Odelius (2017a), which operationally defines competencies as observable behaviours, based on the RG concept adopted herein, and by the development of MCs, based on the revision of literature centred on empirical articles on RG classifications, published between 2005 and 2015, and on qualitative data previously collected in RGs (audio recordings, interview transcriptions, field reports, and preliminary instruments). The scale was submitted for evaluation by judges and subjected to pre-test, making it, therefore, more adherent to the context of RGs.
The scale referred to is composed of 50 items, grouped into two factors (Figure 2.1).
Figure 2.1
DEFINITIONS OF FACTORS RELATED TO MANAGERIAL COMPETENCIES
Factor-related to Managerial
Competencies in Research Groups Constitutive definition
MC1 – people and research results management
Set of managerial competencies essential to managing teams that interact in order to achieve results from research activities and projects of the group.
MC2 – fundraising and people acquisition
Set of managerial competencies that aim at the supply of resources, acquisition of researchers and cooperation of specialists who may contribute to research activities and projects in the group.
Source: Freitas and Odelius (2017a).
7
The second factor focuses on “fundraising and people acquisition” (MC2). The items are clearly residual, covering competencies related to the search for provision of financial, infrastructural and technological resources, as well as attraction and selection of members for the RG and establishment of partnerships with other researchers and experts on topics of interest (Ferigotti & Fernandes, 2014; Harvey et al., 2002; Higuita-López et al., 2011; Morris & Goldstein, 2007). For example: “establish partnerships with productive sector companies”; “establish partnerships with other researchers or RG”; “obtain funding from external funding agencies for researches”; “attract new members for the group (undergraduate, masters, doctoral students, or researchers) by several recruitment instruments”; and “search for the help of researchers and other professionals to upgrade and deepen topics of interest of the group” (Freitas & Odelius, 2017a).
It is worth mentioning that the selected scale holds validity evidence, although being tested only with an exploratory approach. In any case, the instrument revealed good statistical parameters, embracing 51.1% of the construct variance and an excellent reliability rating (Cronbach’s alpha over 0.903) (Field, 2009; Rozzett & Demo, 2010).
3. RESULTS IN RESEARCH GROUPS
In order to achieve the expected results, RG members are usually organized into fields and lines of research and interact with the intention of bringing together education, research, extension and practical application (Araujo et al., 2015; Backes et al., 2012; Caliari et al., 2016; Garcia et al., 2014; Ramos-Vielba et al., 2016), as well as meeting the needs of funding agencies (Pereira & Andrade, 2008; Santana et al., 2014; Sutton, 2010).
When searching for scales or metrics that could identify the achievement of results in RGs, attention was paid to criticisms from authors such as Berche, Holovatch, Kenna, and Mryglod (2016), who refute the use of rankings or qualifying tables of institutions, groups and researchers and from simplistic criteria idealized by journals, magazines or inexperienced individuals.
8
beyond indexes concerning the RG’s productivity because it is necessary to demonstrate qualitative results and the “critical mass” derived from the group. Thus, this study resorted to the “Scale of Results in RG” validated by Freitas and Odelius (2017b), which is composed of 28 items grouped into three factors (Figure 3.1).
Figure 3.1
DEFINITIONS OF FACTORS RELATED TO RESULTS IN RG
Factor Constitutive definition
R1 – distal results of external repercussion
It is the grouping of indirect results from research activities and projects. They have a remote and peripheral character; they complement, impact or derive from proximal and tangible results initially reached by the group.
R2 – proximal research results
It is the grouping of direct results from research activities and projects. They have immediate connections with knowledge production and contribute to the achievement of further distal results.
R3 – tangible research results
It is the grouping of concrete results from research activities and projects. They have a tangible and material character and are usually related to scientific findings and innovations, new technologies or new methods and contribute to the
achievement of further distal results.
Source: Freitas and Odelius (2017b).
The first factor, “distal results of external repercussion” (R1), deals with recognition and visibility of RGs (Odelius et al., 2011), for example, upon provision of technical services and consultancy (Restrepo & Villegas, 2007) and creation of research networks and interinstitutional partnerships (Harvey et al., 2002; Odelius et al., 2011; Ramos-Vielba et al., 2016; Robson & Shove, 1999). For instance: “participation in interviews, roundtables, radio or TV programs or similar”; “mobilization of relationship networking to perform research activities”; and “provision of counseling or technical consultancy for public or private organizations” (Freitas & Odelius, 2017b).
9
(Araujo et al., 2015; Restrepo & Villegas, 2007). It also covers the inclusion of RG members in the market (Freitas & Odelius, 2017b).
The third factor, “research tangible results” (R3), embraces more concrete items derived from the research and considered in CNPq’s production list, such as protocols, processes and techniques; products (prototypes, artefacts, patents, software, etc.); and books or their subparts (Mugnaini, Jannuzzi, & Quoniam, 2004).
Lastly, it is worth stressing that the selected scale also possesses validity evidence within exploratory research and showed good statistical parameters, covering 51.9% of the construct variance. With respect to the reliability rating (Cronbach’s alpha), the first and second factors are excellent (0.927 and 0.872, respectively); however, the third one has a rating of 0.624. Nevertheless, Hair, Anderson, Babin, and Black (2010) indicate 0.7 as a lower limit but make an exception for 0.6 in the case of exploratory factor analysis.
4. METHODOLOGY
The research has an explicative-exploratory nature since it aims to identify the factors that contribute to or determine the occurrence or way of occurring of RG results from the association with mastery of MCs. However, at the same time, it was not possible to identify any research that correlates the phenomena concomitantly in the context of RGs.
With respect to population and sample, the CNPq’s census (2014) showed that there are 35,424 RGs and 180,262 researchers in Brazil, of which 30,155 were considered as the population for this study since they assume the role of leader. In order to calculate the minimum sample size, Cochran’s formula (2007) was used, which recommended at least 380 respondents as necessary for a statistical generalization.
10
regarding the observed phenomena, analysing them in new contexts (Stake, 2000; Yin, 2013).
The scales with additional demographic and functional questions were forwarded on three fronts: 1. the “snowball method” (Polit, Beck, & Hungler, 2004), initiated by coordinators of 93 postgraduate programs in several fields of knowledge at a federal university; 2. requests for response to RGs with open profiles on Facebook, located through the website’s search tool; and 3. forwarding the link to 6,630 email addresses of RG members from all over Brazil.
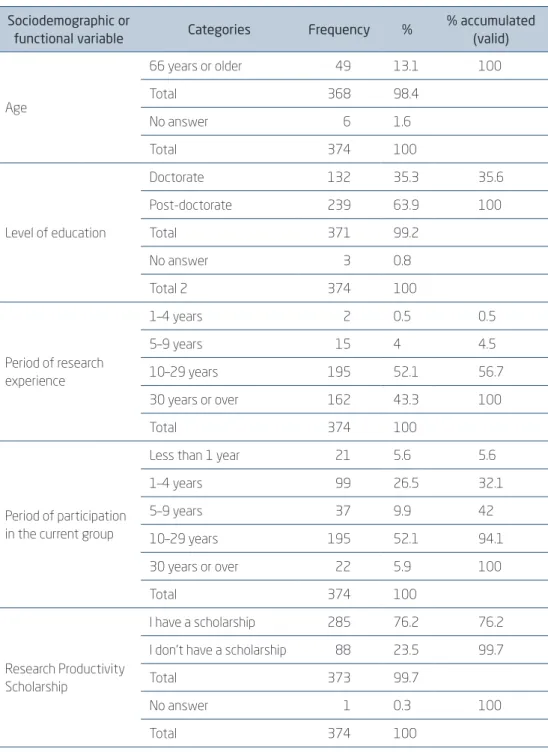
The research carried out with the use of SurveyMonkey, received responses from November 2, 2015, until January 4, 2016. The first two fronts had 111 responses, whilst the latter had the contribution of 420 leaders (generating a rate of return of 6.3%). However, out of 531 responses received, 144 were considered incomplete, and only 387 responses were accepted. Due to preliminary analyses were done by using the Statistical Package for the Social Sciences (SPSS), 13 univariate or multivariate outliers were detected and excluded (Neiva, Abbad, & Tróccoli, 2011), thus reducing the number of responses to only 374. This does not preclude the minimum sample since its verification occurs before the exclusion of extreme cases (Field, 2009). The characteristics of the sample are presented in Figure 4.1.
Figure 4.1
CHARACTERISTICS OF THE SAMPLE
Sociodemographic or
functional variable Categories Frequency %
% accumulated (valid)
Gender
Male 230 61.5 62.3
Female 139 37.2 100
Total 369 98.7
No answer 5 1.3
Total 2 374 100
Age
26–35 years old 8 2.1 2.2
36–45 years old 53 14.2 16.6
46–55 years old 122 32.6 49.7
56–65 years old 136 36.4 86.7
11
Sociodemographic or
functional variable Categories Frequency %
% accumulated (valid)
Age
66 years or older 49 13.1 100
Total 368 98.4
No answer 6 1.6
Total 374 100
Level of education
Doctorate 132 35.3 35.6
Post-doctorate 239 63.9 100
Total 371 99.2
No answer 3 0.8
Total 2 374 100
Period of research experience
1–4 years 2 0.5 0.5
5–9 years 15 4 4.5
10–29 years 195 52.1 56.7
30 years or over 162 43.3 100
Total 374 100
Period of participation in the current group
Less than 1 year 21 5.6 5.6
1–4 years 99 26.5 32.1
5–9 years 37 9.9 42
10–29 years 195 52.1 94.1
30 years or over 22 5.9 100
Total 374 100
Research Productivity Scholarship
I have a scholarship 285 76.2 76.2
I don’t have a scholarship 88 23.5 99.7
Total 373 99.7
No answer 1 0.3 100
Total 374 100
Figure 4.1 (continuation)
CHARACTERISTICS OF THE SAMPLE
12
Sociodemographic or
functional variable Categories Frequency %
% accumulated (valid)
Geographic region where group meetings occur
North 11 2.9 2.9
Northeast 68 18.2 21.1
Central-West 36 9.6 30.7
Southeast 183 48.9 79.7
South 76 20.3 100
Total 374 100
Type of education/ research institution to which the group is linked
Public 343 91.7 91.7
Private 31 8.3 100
Total 374 100
Great field of knowledge of the group
Exact and Earth Sciences 80 21.4 21.4
Biological Sciences 58 15.5 36.9
Engineering 25 6.7 43.6
Health Sciences 51 13.6 57.2
Agricultural Sciences 56 15 72.2
Applied Social Sciences 52 13.9 86.1
Human Sciences 42 11.2 97.3
Linguistics and Arts 10 2.7 100
Total 374 100
Source: Elaborated by the authors.
When comparing the characteristics of the sample and population, based on CNPq’s census (2014), it is notable that there are some differences in the percentages of participation by group members representing several great fields of knowledge. Regarding other variables, such as education, gender, age and geographical distribution, percentages of the sample follow the population distribution. Therefore, it is believed that the sample distribution may serve as a parameter of the studied population, although there are some differences in isolated data.
Figure 4.1 (conclusion)
13
Concerning the verification of parametric assumptions, the data distribution was found to be devoid of normalcy by histograms with a normal curve, skewness and kurtosis indices, and the Kolmogorov-Smirnov Test with Lilliefors correction. Even though there was an attempt to parameterize the variables with the Box-Cox technique (Osborne, 2010; Tabachnick & Fidell, 2008), the data were not converted to the normal distribution, which is why we decided to use raw data. Thus, as a result of the lack of normalcy, we resorted to the most suitable analyses: Kendall’s Tau Correlation, which allows a clear demonstration of the level of association between two variables, (Tabachnick & Fidel, 2007) is equivalent to the Pearson Regression or Correlation, which is, however, more appropriate for data that do not present normality; and the non-parametric Mann-Whitney U Test and Kruskall-Wallis H Test, through which it is possible to clarify eventual differences between groups of factors and to detail cases with differences considered as statistically significant but not demanding the normality presupposition (Field, 2009).
5. PRESENTATION AND DISCUSSION OF RESULTS
OF THE KENDALL’S TAU CORRELATION ANALYSIS
The correlation coefficients found for the five main variables presented in Figure 5.1 indicate the degree of association between variables and when squared, point to the coefficient of determination (R²), which represents the percentage of the extent that the variance of one variable is explained by the other.
Figure 5.1
CORRELATIONS (τ) BETWEEN MANAGERIAL COMPETENCIES AND RESULTS
Variable MC1 MC2 R1 R2 R3
MC1 – Managerial Competencies for People
and Research Results Management 1.000
MC2 – Managerial Competencies for
Fundraising and People eAcquisition .661 1.000
R1 – Distal Results of External Repercussion .287 .369 1.000
R2 – Proximal Research Results .305 .332 .547 1.000
R3 –Tangible Research Results .241 .321 .501 .491 1.000
14
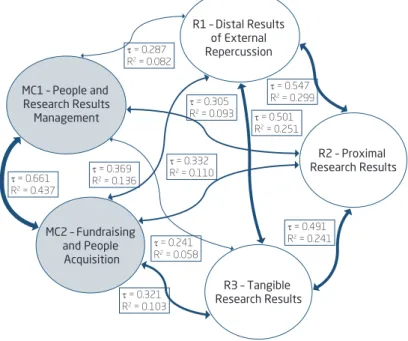
Figure 5.2 illustrates those correlations by the thickness of double arrows linking variables and by the respective coefficients of correlation (τ) and determination (R²).
Figure 5.2
CORRELATIONS (τ) AND R2 BETWEEN THE FIVE VARIABLES
OF MANAGERIAL COMPETENCIES AND RESULTS
R1 – Distal Results of External Repercussion
MC1 – People and Research Results Management
MC2 – Fundraising and People
Acquisition
R2 – Proximal Research Results
R3 – Tangible Research Results
= 0.321 R2 = 0.103
= 0.287 R2 = 0.082
= 0.305 R2 = 0.093
= 0.547 R2 = 0.299
= 0.491 R2 = 0.241
= 0.241 R2 = 0.058
= 0.501 R2 = 0.251
= 0.332 R2 = 0.110
= 0.661 R2 = 0.437
= 0.369 R2 = 0.136
Source: Elaborated by the authors.
MCs for fundraising and people acquisition is associated more with RG results since this factor has a greater percentage of explanation when compared to the percentage of MCs for people and research results management.
When analyzing Figure 5.1, it is possible to see that the correlations obtained with MC2 are higher than with MC1 for all three result factors. It is also demonstrated in Figure 5.2 since the association between MC2 and RG results varied from 10.3% to 13.6%, and the association between MC1 and results ranged from 5.8% to 9.3%. For factors of the same scale, it is possible to conclude that 43.7% of the MC1 variance is explained by MC2 and vice versa. Having correlation grades slightly lower, levels of association between result factors varied from 24.1% to 29.9%.
15
relationship between the results, which initially leads to a necessity to produce proximal results of research, from which distal and tangible results might be reached. The literature indicates that the formation and mobilization of relationship networks (Harvey et al., 2002) depend on the resulting impact of the proximal results, such as the establishment of partnerships with groups and researchers, or progress in knowledge related to the research field.
It should also be underscored that tangible results are more associated with external repercussion results than proximal research results. This finding could mean that the publishing of a book, a patent, a protocol or software may be more associated with the RG’s external performance, such as consultancy, interviews and collaboration networks, than with proximal results. It is also noticeable that there is a greater association between proximal and distal results than between them and tangible ones. This finding could mean that, in order for tangible results to occur, the existence of proximal research results and of interaction and relationships with the environment outside the group may be necessary.
Studied sociodemographic and functional variables have very low or non-existentcorrelations with mastery of MCs and results of RGs.
Statistically significant associations found between sociodemographic and functional variables, both for results and for MCs, were very low, from 0.4% (tangible results and length of experience of the academic research leader) to 1.1% (tangible results and great knowledge area) and between 0.6% (MC1 and length of experience of the leader with academic research) and 2.1% (MC2 and post-doctorate study). Even when not dealing with RGs, it is possible to have in mind that prior studies found that organizational features, such as managerial and environmental policies and practices, exert more influence on the results (Molina, 2016; Propheter, 2016) than sociodemographic features.
16
Figure 5.3
CORRELATIONS (τ) AND R2 BETWEEN MCS AND
SOCIODEMOGRAPHIC/FUNCTIONAL VARIABLES
MC1 – people and research results management
MC2 – fundraising and people acquisition
Sociodemographic or functional variable τ R2 τ
R2
Length of academic research experience
of the leader 0.078 0.006 0.119 0.014 Period of participation of the leader in
the current group 0.101 0.010 0.138 0.019 Leader’s age 0.109 0.012 0.100 0.010 Leader’s gender 0.115 0.013
Presence or absence of a post-doctorate 0.101 0.010 0.144 0.021
Source: Elaborated by the authors.
Finally, for result factors, significant correlations were not found for the Region and Unit of the Federation variables and for the period of participation of the leader in the current RG (Figure 5.4).
Figure 5.4
CORRELATIONS (τ) AND R2 BETWEEN RESULTS AND
SOCIODEMOGRAPHIC/FUNCTIONAL VARIABLES
R1 – distal results of external repercussion
R2 – proximal research
results
R3 – tangible research
results
Sociodemographic or functional variable τ R2 τ R2 τ R2
Length of academic research experience of
the leader 0.130 0.017 0.084 0.007 0.065 0.004 Leader’s age 0.088 0.008
Leader’s gender 0.076 0.006
Presence or absence of a post-doctorate 0.077 0.006 0.083 0.007 0.086 0.007 Type of institution to which the group is linked -0.081 0.007 -0.097 0.009 -0.096 0.009 Great field of knowledge 0.106 0.011
17
Finally, it is worth mentioning that even though there are negative coefficients, this sign should be ignored, and only the magnitude of the associations should be interpreted since they refer to categorical variables (Field, 2009).
6. PRESENTATION AND DISCUSSION OF THE
NON-PARAMETRIC TESTS’ RESULTS
The following charts present medians for all five factors, although, as a general rule, only statistically significant differences and the ones reported in the literature were commented upon, in terms of confronting or confirming them.
Women leaders reported a higher or equal level of mastery of people and research results management MCs when compared to men leaders,
U = 13233.5, p = 0.008, r = – 0.14) – Figure 6.1.
Figure 6.1
MEDIANS OF VARIABLES ACCORDING TO THE RESEARCH GROUP LEADER’S GENDER
4,51 4,44 4,00 4,60
3,67
4,68 4,38 4,07 4,73
3,67
MC1 – People and Research Results Management
MC2 – Fundraising and People Acquisition
R1 – Distal Results of External Repercussion
R2 – Proximal Research Results
R3 – Tangible Research Results
Men Women
Source: Elaborated by the authors.
18
investigate possible reasons for the discrepancy between the MCs domain and the results obtained.
Leaders with post-doctorates consider themselves to be better at mastering both people and research results management MCs and fundraising and people acquisition MCs (U = 13087, p = 0.003, r = – 0.15). The results are statistically equivalent—Figure 6.2.
Figure 6.2
MEDIANS OF VARIABLES ACCORDING TO POST-DOCTORATE
4,63 4,54 4,56 4,11 4,13 3,83 4,70 4,60 4,00
3,67
MC1 – People and Research Results Management
MC2 – Fundraising and People Acquisition
R1 – Distal Results of External Repercussion
R2 – Proximal Research Results
R3 – Tangible Research Results
With post-doctorate Without post-doctorate
Source: Elaborated by the authors.
The research results ratify the expectation that researchers who participated in post-doctorate internships have a greater command of MCs in comparison with those who did not have this experience. However, it must be underscored that the length of the leader’s experience and the realization of a post-doctorate have correlations both with MCs and with RG results. These results confirm the discoveries of Propheter (2016) in the scope of general organizational studies and of Riquelme and Langer (2010) and Sutton (2010) in the RG context. Sutton (2010), for example, identified that the trajectory of the RG is influenced by its leader, who, with his/her experience over the years, changes his/her acting mode according to the RG’s objectives.
Leaders who have CNPq’s productivity scholarship reported that they are better at mastering fundraising and people acquisition MCs than those who do not have the scholarship (U = 9713, p = 0.001, r = – 0.17). Concerning results achieved by the group, a leader who has a CNPq productivity scholarship reports better results in all three factors (U = 9873.5, p = 0.002, r = – 0.16;
19
Figure 6.3
MEDIANS OF VARIABLES ACCORDING TO THE POSSESSION OF A SCHOLARSHIP
MC1 – People and Research Results Management
MC2 – Fundraising and People Acquisition
R1 – Distal Results of External Repercussion
R2 – Proximal Research Results
R3 – Tangible Research Results
With productivity scholarship Without productivity scholarship
4,62 4,50 4,13 4,70
4,00
4,57
4,06 3,58 4,56 3,58
Source: Elaborated by the authors.
Riquelme and Langer (2010) underscore that an RG’s consolidation depends on getting resources and discuss the impacts of the necessity of obtaining financing, which is somehow related to getting scholarships: determination of investigation lines, search for results/productivity; and choice of research lines that may be competitive, both regarding other RGs and to be attractive to the market. Anyway, it is recommended that further studies be done about relationships among MCs, group results and types of productivity scholarships received from CNPq, since the type of scholarship may appear to be a predictor variable, criterion, mediator or moderator when interacting with the other mentioned variables.
Geographic locations of RGs in Brazil, by region, do not have an impact on statistically significant differences in medians of variables—Figure 6.4.
Figure 6.4
MEDIANS OF VARIABLES BY REGION
North Northeast Central-West Southeast South MC1 – People and
Research Results Management
MC2 – Fundraising and People Acquisition
R1 – Distal Results of External Repercussion
R2 – Proximal Research Results
R3 – Tangible Research Results
4,58 4,61 4,58 4,59 4,68
4,25 4,29 4,28 4,44 4,47
3,86 3,90
3,70
4,13
3,87
4,60 4,60 4,70 4,60 4,63
3,67 3,67 3,83 3,67
4,00
20
This result differs from studies by Backes et al., (2012), Bueno (2014), Canever, Prado, Backes, and Lino, 2014, Ferraz and Dornelas (2015) and Vieira, Welter and Mello-Carpes (2014), which found signs that geographic location could influence the results of groups due to infrastructural deficits experienced by groups from certain locations with a small number of professors with doctorates and lower Gross Domestic Products (GDP).
Probably because 91.7% of the sample is composed of leaders from public institutions, which are subject to similar promotion policies, rules, and guidelines, it is possible that there is a balance between groups’ results and leaders’ MCs researched, causing no significant differences among respondents from several regions and units of the Federation. It is also possible that promotion policies for the neediest places may have already minimized the infrastructural gap. In any case, further research is essential in order to confirm or refute those hypotheses.
The type of institution to which the group is linked, public or private, interferes with the factors Distal Results of External Repercussion and Proximal Research Results, which are more prevalent in groups from public institutions—Figure 6.5.
Figure 6.5
MEDIANS OF VARIABLES ACCORDING TO INSTITUTION TYPE
4,61
4,44
4,03
4,70
3,67
4,59
4,22
3,71
4,40
3,67
MC1 – People and Research Results Management
MC2 – Fundraising and People Acquisition
R1 – Distal Results of External Repercussion
R2 – Proximal Research Results
R3 – Tangible Research Results
Public Private
Source: Elaborated by the authors.
21
There are significant differences due to the Great Fields of Knowledge among all variables, except for Proximal Research Results—Figure 6.6.
There is a greater incidence of R3 among groups of Exact and Earth Sciences, as well as Agricultural Sciences. As for MC2 and R3, the least meaningful medians are Applied Social Sciences and the great field of Linguistics and Arts.
Regarding MC2, it is worth highlighting that the leaders of the Health Sciences and Agricultural Sciences have the highest degrees of mastery, while Applied Social Sciences and Linguistics and Arts have lower degrees of mastery. Concerning the emphasis on Agricultural Sciences, this finding is compatible with the study by Garcia et al. (2014) which pointed out this great field of knowledge as the one that establishes partnerships with the productive sector the most.
Figure 6.6
MEDIANS OF VARIABLES ACCORDING TO THE GREAT FIELDS OF KNOWLEDGE
Lin
Exacts and Earth Biological Engineerings Health
Agricultural Applied Social Human Linguistics and Arts MC1 – People and
Research Results Management
MC2 – Fundraising and People Acquisition
R1 – Distal Results of External Repercussion
R2 – Proximal Research Results
R3 – Tangible Research Results
4,41 4,63 4,56
4,71
4,57
4,33
4,83 4,78
4,35 4,56 4,33 4,61 4,67
4,00
4,33
4,17 4,07 4,10
3,44
4,13 4,07
3,37
4,50
4,18
4,70 4,60 4,56 4,70 4,70
4,40 4,80 4,62 4,33 3,67 4,00 3,67 4,17 3,33 3,67 3,17
Source: Elaborated by the authors.
22
There are no significant differences in terms of age in any of the five factors.
It should be noted that the respondents’ ages were collected as discrete variables in years. Subsequently, they were categorized into groups: 25 years old or younger; 26–35 years old; 36–25 years old; 46–55 years old; 56–65 years old; and 66 years or older. Even without the presence of statistically significant differences, it is noticeable in Figure 6.7 that the older the leader, the greater the mastery of MCs.
The results of RGs, especially the ones of external repercussion, are reported more frequently by more mature leaders because they usually require greater experience and a longer period dedicated to academic research, aspects that cannot be dissociated from the leader’s age. In this regard, Lee and Bozeman (2005) found that researchers who are older and had long careers have more time to develop competencies, create networks, and increase productivity through collaboration.
Figure 6.7
MEDIANS OF VARIABLES ACCORDING TO AGE GROUP
MC1 – People and Research Results Management
MC2 – Fundraising and People Acquisition
R1 – Distal Results of External Repercussion
R2 – Proximal Research Results
R3 – Tangible Research Results
45 years old or younger 46-50 years old 51-60 years old 61-65 years old More than 65 years old
4,34 4,57 4,60 4,61
4,83
4,22 4,22 4,44 4,44
4,71
3,73 3,93 4,00
4,25 4,20
4,56 4,58 4,60 4,80 4,70
3,67 3,67
4,00 4,00
3,67
Source: Elaborated by the authors.
The period of academic research experience results in significant differences in People and Research Results Management MCs (H[4] = 9.04,
23
Figure 6.8
MEDIANS OF VARIABLES ACCORDING TO THE PERIOD OF ACADEMIC RESEARCH EXPERIENCE
MC1 – People and Research Results Management
MC2 – Fundraising and People Acquisition
R1 – Distal Results of External Repercussion
R2 – Proximal Research Results
R3 – Tangible Research Results
0 to 4 years 5 to 9 years 10 to 29 years More than 30 years
3,85
4,66 4,54 4,68
2,44
4,06 4,33 4,59
2,47
3,87 3,86 4,33 3,78 4,35
4,60 4,70
2,00
3,33 3,67 4,00
Source: Elaborated by the authors.
Regarding MC1, leaders with 5–9 and 10–29 years of experience present similar medians for the degree of mastery, and leaders with 1–4 years of experience have less mastery than leaders with more than 30 years of research experience. On that subject, Santos and Honório (2014) found that the competence to manage conflicts, an aspect that integrates MC1, is greater among managers with more acting time.
On the other hand, concerning MC2 and R2, the greater the leader’s experience, the higher the mastery of competencies and achievement of results. This finding is compatible with propositions by Odelius et al. (2010), who state that RG performance is dependent on the leader’s technical and scientific experience because effects and rules hierarchical relations established in the group. It is possible to infer that the fourth year of academic research experience represents a milestone from which both MCs and group results reach a maturity level where they remain stable or go through minor progress over the years.
Leaders presented different degrees of mastery of Fundraising and People Acquisition MCs (H[4] = 12.47, p = 0.014), depending on the bonding period with the current RG.
24
Figure 6.9
MEDIANS OF VARIABLES ACCORDING TO THE BONDING PERIOD WITH THE CURRENT GROUP
MC1 – People and Research Results Management
MC2 – Fundraising and People Acquisition
R1 – Distal Results of External Repercussion
R2 – Proximal Research Results
R3 – Tangible Research Results
0 to 4 years 5 to 9 years 10 to 29 years More than 30 years
4,50 4,58 4,63 4,69
4,22 4,28 4,56 4,61
3,88 3,83 4,12 3,77
4,60 4,60 4,70 4,63
3,67 3,67 3,67
3,33
Source: Elaborated by the authors.
Although it is not about the same variable, Mejía, Sánchez, and Leza (2008) indicated that the period of existence of the group positively influences its results. Considering that RGs are formalized after registration with the CNPq and the respective leader’s investiture, and that cases of exchange or succession of leaders are exceptional, it is possible to infer that the bonding time of the leader with the current group is similar to the period of existence of the group, as it is possible to affirm that those authors’ findings are similar to the ones exposed in this study.
Finally, it is recommended that further studies use Figure 5.2 as a theoretical model to test the relations of prediction among the studied variables. In addition, the future study schedule should include the levels of prediction of the sociodemographic or functional variables that present statistically significant differences in at least one of the main variables.
7.
FINAL CONSIDERATIONS
Besides considerably fulfilling the academic, social and institutional justifications listed in the introduction, this research provided for the exploration of research agendas chosen as investigative loci by researchers who study the MCs and results in phenomena in the context of RGs.
25
Non-parametric tests showed statistically significant differences in MCs or RG results regarding the variables gender, age, experience with research, bonding period of the leader with the group, CNPq’s productivity scholarship, whether or not the leader completed a post-doctorate course and great field of knowledge.
The main discoveries were: 1. in order for the RG to achieve more results, it is not enough that the leader master people and research results management because the dedication to fundraising and people acquisition is also necessary, since the latter MC is more related to results than the former one; 2. women want to be better than men in people and research results management; 3. post-doctorate leaders want to dominate more in MCs; 4. leaders who have CNPq productivity scholarships want to dominate more in resource and people gathering and state that their groups have more results; 5. greater mastery of people management and research results was indicated by leaders of Human Sciences, and the lowest was from leaders of the Applied Social Sciences; 6. the greatest mastery of resource and people gathering was indicated by leaders of the Health Sciences and the Agricultural Sciences, and the lowest was indicated by leaders of the Applied Social Sciences; 7. the greatest incidences of distal results of external repercussion were achieved by leaders of Human Sciences and the lowest by leaders of the Applied Social Sciences; 8. the greatest incidences of tangible research results were achieved by Agricultural Sciences and Exact and Earth Sciences leaders and the lowest by Linguistic, Letters, and Arts leaders; 9; generally, older leaders consider that their groups have more results of external repercussion; and 10. generally, the greater the experience, the leader’s age, and the time spent with the group, the greater the self-perception regarding superiority in MCs and the scope of results.
Concerning the limitations, it should be highlighted that: 1. it was not possible to select a random sample; however, when comparing the population with the sample, there is a similarity between them in terms of sociodemographic and functional data; and 2. although it was attempted, the research did not incorporate hard indicators usually collected by secondary data.
26
sociodemographic and functional variables. It is also suggested that qualitative research characterize the infrastructure of RGs from several fields of knowledge and units of the Federation because the predominance of certain fields of knowledge in a certain region may require less infrastructure and resources, and this justifies the equivalence of results indicated in this study.
Therefore, aside from the above agendas and recommendations, it is necessary to move towards the analysis of relationships between MCs and RG results, especially because this study focused on identifying the magnitude of the associations between variables. Further studies may seek to ascertain the degree of prediction and relationships of causality among them.
COMPETÊNCIAS GERENCIAIS E RESULTADOS EM
GRUPOS DE PESQUISA
RESUMO
Objetivo: Este estudo tem o objetivo de identificar relações entre “com-petências gerenciais” (CG) e o alcance de resultados em “grupos de pes-quisa” (GP) brasileiros, bem como eventuais diferenças decorrentes de características sociodemográficas ou funcionais.
Originalidade/valor: Assim como as organizações em geral, GP precisam investir em aspectos que potencializem seus resultados, assumindo uma abordagem mais estratégica, voltada a eficiência na captação e gestão de recursos e estabelecimento de redes e parcerias, aspectos que são influen-ciados pelas competências do líder, que nem sempre as detém satisfato-riamente. Ademais, o estudo é inovador em aplicar a escala de resultados em GP (pela primeira vez), identificando suas relações com CG.
Design/metodologia/abordagem: Foram empregadas a Análise de
Correlação (Kendall-tau) e Testes de diferenças entre medianas (Mann--Whitney e Kruskall-Wallis) a partir de questionários eletrônicos res-pondidos por 387 líderes de GP, que aceitaram o convite enviado a 6.723 pesquisadores.
27
de pesquisa, sendo necessária a dedicação à captação de recursos e de pessoas, pois essas CG estão mais associadas a resultados em GP. Foram identificadas diferenças decorrentes de nível instrucional, gênero, rece-bimento de bolsa de produtividade, área do conhecimento e/ou tempo de experiência de pesquisa e de vínculo com o grupo.
PALAVRAS-CHAVE
Competências gerenciais. Resultados de grupos de pesquisa. Correlação de Kendall-tau. Teste U de Mann-Whitney. Teste H de Kruskall-Wallis.
REFERENCES
Alonso, M., Fernández, L., & Arroyo, J. (2008). Grupos de investigación en contextos organizacionales académicos: Una reflexión sobre los procesos de cambio y los retos futuros. Investigación Bibliotecológica, 22(44), 103–141. Retrieved from http://www.scielo.org.mx/scielo.php?pid=S0187-358X2008000100007&script=sci_arttext&tlng=en
Araujo, V., Mascarini, S., Santos, E., & Costa, A. (2015). A influência das percepções de benefícios, resultados e dificuldades dos grupos de pesquisa sobre as interações com empresas. Revista Brasileira de Inovação, 14(1), 77–104. doi:10.20396/rbi.v14i1.8649090
Backes, V., Prado, M., Lino, M., Ferraz, F., Reibnitz, K., & Canever, B. (2012). Grupos de pesquisa de educação em enfermagem do Brasil. Revista da Escola de Enfermagem da USP, 46(2), 436–442. doi:10.1590/S0080-62342012000200023
Berche, B., Holovatch, Y., Kenna, R., & Mryglod, O. (2016). Academic research groups: Evaluation of their quality and quality of their evaluation. Journal of Physics: Conference Series, 681(1). doi:10.1088/1742-6596/681/1/ 012004 Brandão, H., & Borges-Andrade, J. (2008). Causas e efeitos da expressão de
28
Brandão, H., Borges-Andrade, J., & de Guimarães, T. (2012). Desempenho organizacional e suas relações com competências gerenciais, suporte organizacional e treinamento. Revista de Administração, 47(4), 523–539. Retrieved from https://www.sciencedirect.com/science/article/pii/ S0080210716302461
Brito, L. M. P., & Leone, N. M. de C. G. P. (2012). Competências gerenciais requeridas em empresas familiares: Um olhar feminino. Revista de Ciências da Administração, 14(32), 50–64. Retrieved from https://periodicos.ufsc. br/index.php/adm/article/view/19517
Brito-de-Jesus, K. C., dos-Santos, M. G., de Souza-Silva, J. C., & Rivera--Castro, M. A. (2016). Desenvolvimento de competências gerenciais de gestores públicos em instituições federais de educação. Revista Interdiscipli-nar de Gestão Social, 5(1), 37–60. Retrieved from https://portalseer.ufba.br/ index.php/rigs/article/view/12292/11642
Bueno, W. (2014). A investigação em comunicação organizacional no Brasil: Uma leitura abrangente dos grupos de pesquisa cadastrados no CNPq.
Comunicação & Inovação, 15(28), 32–40. doi:10.13037/ci.vol15n28.2388 Caliari, T., Santos, U., & Mendes, P. (2016). Geração de tecnologia em
uni-versidades/institutos de pesquisa e a importância da interação com empre-sas: Constatações através da base de dados dos grupos de pesquisa do CNPQ. Análise Econômica, 34(66), 285–312. doi:10.22456/2176-5456.54149
Canever, B. P., Prado, M. L., Backes, V. M. S., & Lino, M. M. (2014). Caracte-rização dos grupos de pesquisa em educação em enfermagem do estado de São Paulo. Texto Contexto – Enfermagem, 23(1), 21–28. doi:10.1590/S0104-07072014000100003
Cardoso, A. (2014). Questão de gênero: A percepção de alunos e ex-alunos de pós-graduação stricto sensu em Administração sobre competências gerenciais. Revista de Carreiras e Pessoas, 4(1), 18–34. Retrieved from https:// revistas.pucsp.br/index.php/ReCaPe/article/view/19407/14371CNPq Cochran, W. (2007). Sampling techniques. Hoboken, NJ: John Wiley & Sons. Creswell, J. (2013). Research design: Qualitative, quantitative, and mixed methods
approaches. Thousand Oaks, CA: Sage Publications.
Denison, D., Hooijberg, R., & Quinn, R. (1995). Paradox and performance: Toward a theory of behavioral complexity in managerial leadership.
29
Ferigotti, C., & Fernandes, B. (2014). Competências gerenciais e capacidade para inovação: O caso da Electrolux do Brasil S/A. Revista de Administração e Inovação, 11(1), 73–96. doi:10.5773/rai.v11i1.1060
Fernandez, F., & Odelius, C. (2013). Validação de uma escala de domínio de competências em grupos de pesquisa. Revista de Administração FACES Journal, 12(2). doi:10.21714/1984-6975FACES2013V12N2ART1277 Ferraz, I., & Dornelas, S. (2015). Repertório compartilhado de recursos em
comunidades virtuais de prática: Um estudo dos mecanismos de interação, organização e controle em grupos de pesquisa científica. Organizações & Sociedade, 22(72) 90–122.
Field, A. (2009). Discovering statistics using SPSS. Thousand Oaks, CA: Sage Publications.
Freitas, P. F. P. (2016) Relações entre competências gerenciais de líderes de grupos de pesquisa e resultados alcançados (Master’s thesis). Universidade de Brasília, Brasília, DF, Brazil. Retrieved from http://repositorio.unb.br/bitstream/ 10482/19827/1/2016_PabloFernandoPessoadeFreitas.pdf
Freitas, P., & Odelius, C. (2017a). Escala de competências gerenciais em grupos de pesquisa. Revista de Administração FACES Journal, 16(4), 45–65. doi:10.21714/1984-6975FACES2017V16N4ART4134
Freitas, P., & Odelius, C. (2017b). Scale of results in research groups. Revista de Administração Mackenzie, 18(4), 87–108. doi:10.1590/1678-69712017/ administracao.v18n4p87-108
Garcia, R., Araújo, V., Mascarini, S., Santos, E., & Costa, A. (2014). Intera-ções universidade-empresa e a influência das características dos grupos de pesquisa acadêmicos. Revista de Economia Contemporânea, 18(1), 125–146. doi:10.1590/141598481816
Hair, F. Jr., Anderson, R., Babin, B., & Black, W. (2010). Multivariate data analysis: A global perspective (Vol. 7). Upper Saddle River, NJ: Pearson. Harvey, J., Pettigrew, A., & Ferlie, E. (2002). The determinants of research
group performance: Towards mode 2? Journal of Management Studies, 39(6), 747–774. doi:10.1111/1467-6486.00310
Haythornthwaite, C. (2006). Learning and knowledge networks in interdisciplinary collaborations. Journal of the American Society for Information Science and Technology, 57(8), 1079-1092. doi:10.1002/asi.20371
Higuita-López, D., Molano-Velandia, J., & Rodríguez-Merchán, M. (2011). Necessary skills among research groups at the Universidad Nacional de Colombia that work to generate technologically based developments.
30
Lee, S., Bozeman, B. (2005). The impact of research collaboration on scientific productivity. Social studies of science, 35(5), 673–702. doi:10.11 77/0306312705052359
Lopes, M., Fialho, F., Leonardi, J., Lopes, L., Ribeiro, S., & Wihelm, P. (2010). Análise da relação entre aptidões cerebrais e competências gerenciais: O caso de uma empresa têxtil. Gestão & Produção, 17(1), 123–136. doi:10. 1590/S0104-530X2010000100010
Mejía, A., Sánchez, A., & Leza, F. (2008). Determinantes de éxito en la participación de los grupos de investigación latinoamericanos en programas de cooperación científica internacional. Interciencia: Revista de Ciencia y Tecnología de América, 33(11), 821–828. Retrieved from http://www.redalyc. org/pdf/339/33913607.pdf
Molina, A. (2016). A manager is a manager is a manager? Race and managerial impact on organizational performance. Public Organization Review, 16(1), 39–53. doi:10.1007/s11115-014-0292-9
Morris, S. A., & Goldstein, M. L. (2007). Manifestation of research teams in journal literature: A growth model of papers, authors, collaboration, coauthorship, weak ties, and Lotka’s law. Journal of the American Society for Information Science and Technology, 58(12), 1764–1782. doi:10.1002/ asi.20661
Mugnaini, R., Jannuzzi, P., & Quoniam, L. (2004). Indicadores bibliométricos da produção científica brasileira: Uma análise a partir da base Pascal. Ciência da Informação, 33(2), 123–131. doi:10.1590/S0100-19652004000200013 Neiva, E., Abbad, G., & Tróccoli, B. (2011). Roteiro para análise fatorial de
dados. Brasília, DF: Universidade de Brasília.
Odelius, C., & Sena, A. (2009). Atuação em grupos de pesquisa: competências e processos de aprendizagem. Revista de Administração FACES Journal, 8(4), 13–31. Retrieved from http://www.fumec.br/revistas/facesp/article/ view/162/159
31
Odelius, C., Abbad, G., Resende Junior, P., Sena, A., & Ono, R. (2010). Gru-pos de pesquisa: Atividades, competências e processos de aprendizagem.
Anais do Encontro Nacional da Associação Nacional de Pós-Graduação e Pesquisa em Administração, Rio de Janeiro, RJ, Brazil, 34.
Osborne, J. (2010). Improving your data transformations: Applying the Box--Cox transformation. Practical Assessment, Research & Evaluation, 15(12), 1–9. Retrieved from https://pareonline.net/pdf/v15n12.pdf
Paiva, K., & Ferreira, L. (2013). Competências Gerenciais na área de Tecno-logia de Informação: Um estudo com gestores de empresas localizadas no Triângulo Mineiro. Revista Gestão & Tecnologia, 13(1), 205–229. Retrieved from http://revistagt.fpl.edu.br/get/article/view/484
Paiva, K., Santos, A., & Lacerda, M. (2014). Competências gerenciais e sua ges-tão na hotelaria: Um estudo com gestores brasileiros. Tourism & Management Studies, 10(2), 84–93. Retrieved from http://www.scielo.mec.pt/pdf/tms/ v10n2/v10n2a11.pdf
Pereira, G., & Andrade, M. (2008). Aprendizagem científica: Experiência com grupos de pesquisa. In L. Bianchetti & P. Meksenas (Org.). A trama do conhecimento: Teoria, método e escrita em ciência e pesquisa (pp. 163–168).
Campinas, SP: Papirus.
Polit, D., Beck, C., & Hungler, B. (2004). Pesquisa em enfermagem: Métodos, avaliação e utilização. Porto Alegre, RS: Artmed.
Prahalad, C., & Hamel, G. (1990). The core competence concept. Harvard Business Review, 64, 79–91.
Propheter, G. (2016). Managerial experience and organizational performance: A 15-year panel study of local assessors. Public Administration Review, 76(3), 438–446. doi:10.1111/puar.12440
Quinn, R. (1988). Beyond rational management: Mastering the paradoxes and competing demands of high performance. San Francisco, CA: Jossey-Bass. Ramos-Vielba, I., Sánchez-Barrioluengo, M., & Woolley, R. (2016). Scientific
research groups’ cooperation with firms and government agencies: Motivations and barriers. The Journal of Technology Transfer, 41(3), 558–585. doi:10.1007/s10961-015-9429-4
32
Riquelme, G., & Langer, A. (2010). Capacidades de los grupos de docencia e investigación en la circulación y producción del conocimiento: el caso de tres universidades argentinas. Revista de la Educación Superior, 39(154), 19–49. Retrieved from http://www.scielo.org.mx/pdf/resu/v39n154/ v39n154a2.pdf
Robson, B., & Shove, E. (1999). Interaction and influence: Individuals and institutions. In A Summary Report of six pilot studies commissioned by the ESRC. Swindon: ESRC.
Rozzett, K., & Demo, G. (2010). Development and factor validation of the Customer Relationship Scale (CRS). Revista de Administração de Empre-sas, 50(4), 383–395. doi:10.1590/S0034-75902010000400004
Santana, G., Silva, F., Sobral, N., & Ferreira, M. (2014). Indicadores dos grupos de pesquisa da área de Gestão da Informação na região Nordeste: Um enfoque para a colaboração em artigos de periódicos. Em Questão, 20(3), 229–252. Retrieved from http://seer.ufrgs.br/index.php/EmQuestao/ article/download/49322/32437
Santos, E., & Honório, L. (2014). Competências gerenciais em uma rede mineira de farmácias. Revista Alcance, 21(4), 650–673. doi:10.14210/ alcance.v21n4.p650-673
Santos, J., Caetano, A., & Jesuíno, J. (2008). As competências funcionais dos líderes e a eficácia das equipas. Revista Portuguesa e Brasileira de Gestão, 11(2–3), 95–106. Retrieved from http://www.scielo.mec.pt/pdf/ rpbg/v7n3/v7n3a04.pdf
Sierra-Flores, M., & Russell-Barnard, J. (2009). Los grupos de investigación más productivos de la Universidad Nacional Autónoma de México (UNAM) en el área de física: 1990 a 1999. Investigación Bibliotecológica, 23(48), 127–155. Retrieved from http://www.scielo.org.mx/pdf/ib/v23n48/ v23n48a6.pdf
Silva, E., Gil, A., & Okabayashi, S. (2015). Competências na gestão pública: uma avaliação dos servidores públicos do Grande ABC paulista. Gestão Pública: Práticas e Desafios, 5(1).
33
Tabachnick, B., & Fidell, L. (2008). Using multivariate statistics (5 ed.). Boston, MA: Pearson.
Vásquez-Rizo, F. (2010). Modelo de gestión del conocimiento para medir la capacidad productiva en grupos de investigación. Ciencia, Docencia y Tecnología, (41), 101–125. Retrieved from http://www.scielo.org.ar/pdf/ cdyt/n41/n41a05.pdf
Vieira, A., Welter, M., & Mello-Carpes, P. (2014). Perfil dos grupos de pesquisa em neurofisiologia do Brasil. Revista Neurociências, 22(1), 37–44. doi:10.4181/RNC.2014.22.913.8p
Vilkinas, T. (2000). The gender factor in management: How significant others perceive effectiveness. Women in Management Review, 15(5/6), 261–272. doi:10.1108/09649420010372922
Viotti, E., & Macedo, M. D. M. (2003). Indicadores de ciência, tecnologia e inovação no Brasil. Campinas, SP: Unicamp.
Wickramasinghe, V., & Zoyza, N. (2008). Gender, age and marital status as predictors of managerial competency needs: Empirical evidence from a Sri Lankan telecommunication service provider. Gender in Management: An International Journal,23(5), 337–354. doi:10.1108/17542410810887365 Yin, R. (2013) Case study research: Design and methods. Thousand Oaks, CA:
Sage Publications.
AUTHOR NOTE
Pablo Fernando P. De Freitas, Faculty of Economics, Administration, Accounting and Public Policy Management, Universidade de Brasília (UnB); and Catarina Cecília Odelius, Institute of psychology, Universidade de Brasília (UnB).
Pablo F. P. Freitas is now PhD student of Administration at Faculty of Economics, Administration, Accounting and Public Policy Management at Universidade de Brasília (UnB); Catarina C. Odelius is now Collaborator Researcher at the Post-Graduate Program of Administration at Universidade de Brasília (UnB).
Correspondence concerning this article should be addressed to Pablo F. P. Freitas, SQS 413 Bloco C, 206, Asa Sul, Brasília, Distrito Federal, Brazil, CEP 70.296-030.
34
EDITORIAL BOARD
Editor-in-chief
Silvio Popadiuk
Associated Editor
Fabiano Larentis
Technical Support
Vitória Batista Santos Silva
EDITORIAL PRODUCTION
Publishing Coordination
Irina Migliari
Editorial Trainee
Maria Luiza Vanz
Copy Editor
Irina Migliari
Language Editor
Daniel Leão
Layout Designer
Emap
Graphic Designer