Printed version ISSN 0001-3765 / Online version ISSN 1678-2690 http://dx.doi.org/10.1590/0001-3765201620160114
www.scielo.br/aabc
Genotypic carriers of the obesity-associated
FTO
polymorphism
exhibit different cardiometabolic profiles after an intervention
Greice G. Moraes1, cézane P. reuter2, Jane D.P. renner1, elisa i. KlinGer1, Michele B. Ferreira3
, elza D. De Mello4
, anDréia De M. ValiM1
and Miria s. BurGos1
1
Postgraduate Program in Health Promotion, University of Santa Cruz do Sul, Av. Independência, 2293, Bloco 42, Sala 4206, Bairro Universitário, 96815-900 Santa Cruz do Sul, RS, Brazil 2
Physical Education and Health Department, University of Santa Cruz do Sul, Av. Independência, 2293, Bloco 42, Sala 4201, Bairro Universitário, 96815-900 Santa Cruz do Sul, RS, Brazil 3
Department of Biology and Pharmacy. University of Santa Cruz do Sul, Av. Independência, 2293, Bloco 35, Bairro Universitário, 96815-900 Santa Cruz do Sul, RS, Brazil 4
Postgraduate Program in Child and Adolescent Health, Federal University of Rio Grande do Sul, Av. Ramiro Barcellos, 2400, Bairro Santana, 90035-903 Porto Alegre, RS, Brazil
Manuscript received on March 10, 2016; accepted for publication on July 12, 2016
aBstract
Background: Children and adolescents with at-risk genotypes (AA/AT) of the rs9939609 polymorphism in FTO, a fat mass and obesity-associated gene, may exhibit different cardiometabolic profile responses than subjects with the TT genotype after an interdisciplinary intervention. Methods: The sample consisted of 36 school children from southern Brazil. We used DNA quantitation and real-time polymerase chain reaction (PCR) for polymorphism genotyping. We measured anthropometric parameters (body mass index (BMI), waist circumference, hip circumference, waist-hip ratio, body fat percentage and skinfold
sum), biochemical parameters (glucose, lipid profile, ultra-sensitive C-reactive protein, uric acid, alanine
aminotransferase, aspartate aminotransferase, insulin and adiponectin) and blood pressure. The 4-month intervention consisted of physical education classes, nutritional counseling, and postural and oral health counseling. results: We observed no significant differences among the groups (AA, AT and TT) after the intervention. However, we observed improvements in three parameters (waist circumference, hip circumference and C-reactive protein) in the AT/AA genotype group and in two parameters (hip circumference and uric acid) in the TT genotype group. conclusions: After an intervention program,
carriers of at-risk genotypes for obesity (AA/AT) do not exhibit differences in biochemical parameters,
blood pressure and anthropometric parameters compared with carriers of the TT genotype.
Key words: genotype, intervention, obesity, children, physical activity.
Correspondence to: Miria Suzana Burgos E-mail: [email protected]
introDuction
The incidence of obesity has increased dramatically
worldwide, and obesity is currently responsible for major disorders related to a sedentary lifestyle and
its consequences in adulthood, including type 2 diabetes, cardiovascular diseases (Andreasen et al. 2008, Luczynski et al. 2012), fatty liver, respiratory diseases, biliary tract disorders, and certain cancers (Haslam 2007, Liu et al. 2010).
interactions (Luczynski et al. 2012). Important
genetic changes include changes to the FTO gene,
which was first identified in 2007 (Jonsson et al.
2009). The FTO gene is one of the most recently
studied genes (Zlatohlavek et al. 2013, Song et al. 2014), and its association with obesity has been confirmed in several studies performed using children and adolescents (Liu et al. 2010, Foraita
et al. 2015, Yang et al. 2014). FTO rs9939609,
which is a single nucleotide polymorphism (SNP), affects body mass index (BMI) in large Caucasian populations (Jonsson et al. 2009, González-Sánchez et al. 2009).
Certain individuals do not respond to diet and exercise interventions, suggesting that genetic determinants play a role (Zlatohlavek et
al. 2013). Recent studies addressing the FTO gene
and lifestyle and weight loss interventions have offered contradictory results (Moleres et al. 2012, Delahanty et al. 2012). Certain studies found no relationship between these factors (Delahanty et al. 2012, Schum et al. 2012), whereas other studies report significant results (Zlatohlavek et al. 2013, Reinehr et al. 2014). The cause of the different results remains unclear.
Thus, the aim of this study was to determine whether patients who harbor at-risk obesity
geno-types (AA and AT) of the FTO gene polymorphism
rs9939609 exhibit different biochemical variables and anthropometric values after an intervention program based predominantly on physical activity compared with a TT genotype group.
Materials anD MethoDs
POPULATION AND SAMPLE
This intervention study included 36 students of both sexes (17 in the control group and 19 in the intervention group) between 8 and 16 years of age (mean ages: 11.3±1.6 and 10.2±2.2 years for the control and intervention groups, respectively) who were overweight or obese and enrolled in rural schools in the city of Santa Cruz do Sul in
Rio Grande do Sul (RS), Brazil. These students were selected by convenience. In the control and intervention groups, 11 and 10 subjects were female, respectively. The intervention was performed over 4 months, and study variables were evaluated for the subjects before and after the intervention.
When selecting the sample, we sought subjects with similar age, cultural and anthropometric characteristics in a rural school in the city of Santa Cruz do Sul, RS, Brazil; these characteristics did not significantly differ throughout the study. To determine the sample size, we used the G*Power program (Faul et al. 2007) with a test power of 0.8, an effect of 0.30 and a 95% significance level. Based on these parameters, we suggest that at least 12 subjects must be included in the experimental group and 12 subjects in the control group.
of the University of Santa Cruz do Sul (UNISC) approved the study (advice number 357 403/2013).
GENOTYPING
For DNA extraction, we used a protocol based on the salting-out method (Miller et al. 1988) using 500 µL of peripheral blood leukocytes. After extraction,
DNA was quantified using a Qubit®
2.0 Fluorometer (Invitrogen, Carlsbad, CA, USA) and resuspended in water for injection. A total volume of 10 µL containing 10 ng of genomic DNA as a template was used for reactions. Real time polymerase chain reaction (PCR) was performed in a 96-well plate in the Laboratory of Genetics and Biotechnology at UNISC. A/T variants were determined using TaqMan probes (Applied Biosystems, Foster City, CA, USA) and StepOnePlus equipment (Applied Biosystems, Foster City, CA, USA). The number of cycles (50 cycles) and temperatures (pre-PCR read: 60°C; holding stage: 95°C; cycling stage: 92°C and post-PCR read: 60°C) that we utilized were in accordance with the manufacturer’s instructions, and VIC/FAM dye-labeled TaqMan probes were used (Applied Biosystems, Foster City, CA, USA; ID: C_30090620_10; part number: 4351379).
BIOCHEMICAL ASSAYS
Levels of glucose, total cholesterol, high-density lipoprotein (HDL), low-high-density lipoprotein (LDL), triglyceride, alanine aminotransferase (ALT), aspartate aminotransferase (AST) and ultra-sensitive C-reactive protein (CRP-US) were determined using serum samples, Miura One (ISE, Rome, Italy) automated equipment and DiaSys commercial kits (DiaSys Diagnostic Systems, Germany). Insulin and adiponectin were measured using Invitrogen enzyme-linked immunosorbent assay (ELISA) commercial kits (Invitrogen Corporation, USA).
ANTHROPOMETRIC MEASUREMENTS
Weight and height were measured, and BMI was calculated using the formula BMI = weight
(kg)/height2 (m2). After subjects were classified
according to gender and age, we considered the factors of overweight (≥P85 and <P95) and obesity (≥P95) based on percentile curves from the Centers for Disease Control and Prevention/the National Center for Health Statistics (CDC/NCHS 2000). These parameters were used as inclusion criteria. Waist circumference (WC) was measured at the midpoint between the last rib and the iliac crest and hip at the greater trochanter level. To determine body fat percentage (%BF), we used the equation from Slaughter et al. (1988) and gauged triceps and subscapular folds in accordance with World Health Organization (WHO) recommendations. Blood pressure (systolic and diastolic) was measured according to the Brazilian Guidelines on Hypertension (SBC 2010).
INTERVENTION
The intervention consisted of 1 hour and 30 minute sessions 3 times per week. The 19 students in the intervention group were guided through a warm-up (10 minutes); aerobic exercises (50 minutes); exercises with entertaining features (20 minutes); and exercises for postural re-education and/or nutrition counseling (15 minutes). Nutritional counseling included nutritional education activities provided via educational lectures, theater productions, folders, healthy cooking classes, movie sessions, educational games and the deployment of a fruitful garden. A multidisciplinary team (a physical education professional, a physiotherapist, a pharmacist, a nutritionist, a psychologist, a doctor and a dentist) had pre-planned these interventions. The intervention also incorporated postural and oral health counseling.
STATISTICAL ANALYSIS
assessed using the Shapiro-Wilk test. We used t-tests for independent samples and paired t-tests for normally distributed data. For data that was not normally distributed, non-parametric tests (Mann-Whitney and Wilcoxon tests) were used. The threshold used for significance was p <0.05.
results
HWE was tested for all subjects and for subjects stratified by group (control and intervention) (Table I). Genotypes were in equilibrium (p>0.05), and there was no significant difference between the two groups.
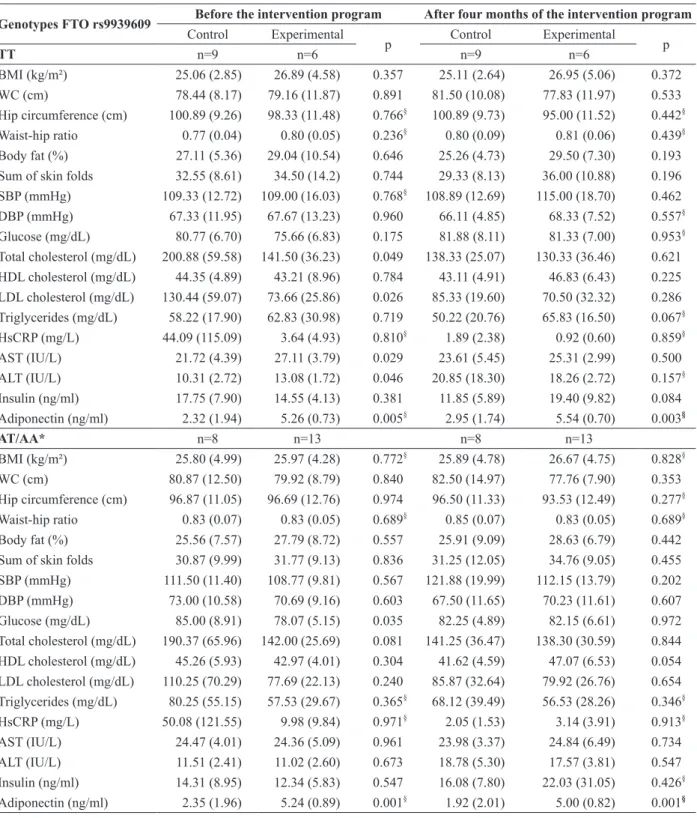
The anthropometric parameters and biochemi-cal blood pressure were measured before and after the intervention; the control group was compared with the intervention group, and the genotype cat-egories are separated as presented in Table II. The table demonstrates that the experimental group with the obesity-risk allele (A) exhibited increased but not significant values for the following parameters compared with students without the obesity-risk allele: WC, waist hip ratio, hsCRP, DBP, glucose, total cholesterol and LDL cholesterol.
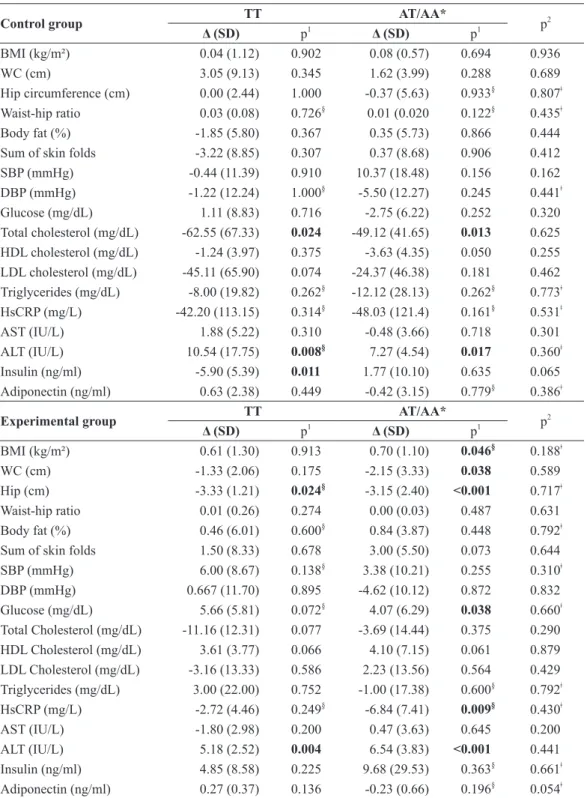
After the intervention period, the biochemical and anthropometric variables for the experimental group (TT genotype) were as expected. A positive and significant decrease in hip circumference was noted (p=0.024), but the ALT concentration increased (p=0.004). For subjects with an obesity-risk allele (A), after the intervention period,
we observed a decrease in WC (p=0.038), hip circumference (p<0.001) and hsCRP (p=0.009). We also observed positive but not significant changes in total cholesterol and triglycerides, which were accompanied by an increase in HDL cholesterol levels. Adiponectin was also slightly decreased after the intervention. Comparing the genotypes, no significant differences were observed in the experimental group after the intervention; thus, the A allele does not affect student progression relative to anthropometric, blood pressure and biochemical parameters before physical activity (Table III).
Discussion
In the present study, carriers of the obesity-risk
allele (A) in the polymorphism rs9939609 (FTO)
exhibited similar anthropometric, biochemical and blood pressure parameter responses to an intervention program compared with the TT genotype group.
In our study, certain biochemical parameter values were greater in the AT/AA genotype group before the intervention compared with the TT genotype group, such as glucose, total cholesterol, LDL cholesterol and hsCRP. The study intervention in Lappalainen et al. (2009), which was conducted in Finland, exhibited similar results; fasting blood glucose levels were increased in AT/AA genotype carriers. WC and BMI were also increased in individuals with the A allele.
taBle i
Genotype distribution and allele frequency of the rs9939609 FTO polymorphism in control and intervention group.
Total Control group Intervention group
n (%) Expected1 n (%)
Expected2 n (%)
Expected3 FTO (rs9939609)
AA 7 (19.4) 5 2 (11.8) 1 5 (26.3) 4
AT 14 (38.9) 17 6 (35.3) 7 8 (42.1) 9
TT 15 (41.7) 13 9 (52.9) 8 6 (31.6) 5
Allele A 28 (38.9) 10 (29.4) 18 (47.4)
Allele T 44 (61.1) 24 (70.6) 20 (52.6)
p: level of significance according to the Chi-square analysis to evaluate the Hardy-Weinberg equilibrium; 1
p=0.458; 2
p=0.567; 3
taBle ii
Control versus experimental group comparison of biochemical and anthropometric variables before and after 4 months of the intervention program.
Genotypes Fto rs9939609 Before the intervention program After four months of the intervention program
Control Experimental
p Control Experimental p
tt n=9 n=6 n=9 n=6
BMI (kg/m²) 25.06 (2.85) 26.89 (4.58) 0.357 25.11 (2.64) 26.95 (5.06) 0.372
WC (cm) 78.44 (8.17) 79.16 (11.87) 0.891 81.50 (10.08) 77.83 (11.97) 0.533
Hip circumference (cm) 100.89 (9.26) 98.33 (11.48) 0.766§
100.89 (9.73) 95.00 (11.52) 0.442§ Waist-hip ratio 0.77 (0.04) 0.80 (0.05) 0.236§
0.80 (0.09) 0.81 (0.06) 0.439§ Body fat (%) 27.11 (5.36) 29.04 (10.54) 0.646 25.26 (4.73) 29.50 (7.30) 0.193 Sum of skin folds 32.55 (8.61) 34.50 (14.2) 0.744 29.33 (8.13) 36.00 (10.88) 0.196 SBP (mmHg) 109.33 (12.72) 109.00 (16.03) 0.768§
108.89 (12.69) 115.00 (18.70) 0.462 DBP (mmHg) 67.33 (11.95) 67.67 (13.23) 0.960 66.11 (4.85) 68.33 (7.52) 0.557§ Glucose (mg/dL) 80.77 (6.70) 75.66 (6.83) 0.175 81.88 (8.11) 81.33 (7.00) 0.953§ Total cholesterol (mg/dL) 200.88 (59.58) 141.50 (36.23) 0.049 138.33 (25.07) 130.33 (36.46) 0.621 HDL cholesterol (mg/dL) 44.35 (4.89) 43.21 (8.96) 0.784 43.11 (4.91) 46.83 (6.43) 0.225 LDL cholesterol (mg/dL) 130.44 (59.07) 73.66 (25.86) 0.026 85.33 (19.60) 70.50 (32.32) 0.286 Triglycerides (mg/dL) 58.22 (17.90) 62.83 (30.98) 0.719 50.22 (20.76) 65.83 (16.50) 0.067§ HsCRP (mg/L) 44.09 (115.09) 3.64 (4.93) 0.810§
1.89 (2.38) 0.92 (0.60) 0.859§
AST (IU/L) 21.72 (4.39) 27.11 (3.79) 0.029 23.61 (5.45) 25.31 (2.99) 0.500
ALT (IU/L) 10.31 (2.72) 13.08 (1.72) 0.046 20.85 (18.30) 18.26 (2.72) 0.157§ Insulin (ng/ml) 17.75 (7.90) 14.55 (4.13) 0.381 11.85 (5.89) 19.40 (9.82) 0.084 Adiponectin (ng/ml) 2.32 (1.94) 5.26 (0.73) 0.005§
2.95 (1.74) 5.54 (0.70) 0.003§
at/aa* n=8 n=13 n=8 n=13
BMI (kg/m²) 25.80 (4.99) 25.97 (4.28) 0.772§
25.89 (4.78) 26.67 (4.75) 0.828§
WC (cm) 80.87 (12.50) 79.92 (8.79) 0.840 82.50 (14.97) 77.76 (7.90) 0.353
Hip circumference (cm) 96.87 (11.05) 96.69 (12.76) 0.974 96.50 (11.33) 93.53 (12.49) 0.277§ Waist-hip ratio 0.83 (0.07) 0.83 (0.05) 0.689§
0.85 (0.07) 0.83 (0.05) 0.689§ Body fat (%) 25.56 (7.57) 27.79 (8.72) 0.557 25.91 (9.09) 28.63 (6.79) 0.442 Sum of skin folds 30.87 (9.99) 31.77 (9.13) 0.836 31.25 (12.05) 34.76 (9.05) 0.455 SBP (mmHg) 111.50 (11.40) 108.77 (9.81) 0.567 121.88 (19.99) 112.15 (13.79) 0.202 DBP (mmHg) 73.00 (10.58) 70.69 (9.16) 0.603 67.50 (11.65) 70.23 (11.61) 0.607 Glucose (mg/dL) 85.00 (8.91) 78.07 (5.15) 0.035 82.25 (4.89) 82.15 (6.61) 0.972 Total cholesterol (mg/dL) 190.37 (65.96) 142.00 (25.69) 0.081 141.25 (36.47) 138.30 (30.59) 0.844 HDL cholesterol (mg/dL) 45.26 (5.93) 42.97 (4.01) 0.304 41.62 (4.59) 47.07 (6.53) 0.054 LDL cholesterol (mg/dL) 110.25 (70.29) 77.69 (22.13) 0.240 85.87 (32.64) 79.92 (26.76) 0.654 Triglycerides (mg/dL) 80.25 (55.15) 57.53 (29.67) 0.365§
68.12 (39.49) 56.53 (28.26) 0.346§ HsCRP (mg/L) 50.08 (121.55) 9.98 (9.84) 0.971§ 2.05 (1.53) 3.14 (3.91) 0.913§
AST (IU/L) 24.47 (4.01) 24.36 (5.09) 0.961 23.98 (3.37) 24.84 (6.49) 0.734
ALT (IU/L) 11.51 (2.41) 11.02 (2.60) 0.673 18.78 (5.30) 17.57 (3.81) 0.547
Insulin (ng/ml) 14.31 (8.95) 12.34 (5.83) 0.547 16.08 (7.80) 22.03 (31.05) 0.426§ Adiponectin (ng/ml) 2.35 (1.96) 5.24 (0.89) 0.001§ 1.92 (2.01) 5.00 (0.82) 0.001§
taBle iii
Genotype comparison of biochemical and anthropometric variables before and after 4 months of intervention in each group (control and experimental) separately.
control group tt at/aa* p2
Δ (SD) p1 Δ (SD)
p1
BMI (kg/m²) 0.04 (1.12) 0.902 0.08 (0.57) 0.694 0.936
WC (cm) 3.05 (9.13) 0.345 1.62 (3.99) 0.288 0.689
Hip circumference (cm) 0.00 (2.44) 1.000 -0.37 (5.63) 0.933§
0.807ǂ Waist-hip ratio 0.03 (0.08) 0.726§ 0.01 (0.020 0.122§ 0.435ǂ Body fat (%) -1.85 (5.80) 0.367 0.35 (5.73) 0.866 0.444
Sum of skin folds -3.22 (8.85) 0.307 0.37 (8.68) 0.906 0.412
SBP (mmHg) -0.44 (11.39) 0.910 10.37 (18.48) 0.156 0.162
DBP (mmHg) -1.22 (12.24) 1.000§
-5.50 (12.27) 0.245 0.441ǂ
Glucose (mg/dL) 1.11 (8.83) 0.716 -2.75 (6.22) 0.252 0.320
Total cholesterol (mg/dL) -62.55 (67.33) 0.024 -49.12 (41.65) 0.013 0.625 HDL cholesterol (mg/dL) -1.24 (3.97) 0.375 -3.63 (4.35) 0.050 0.255 LDL cholesterol (mg/dL) -45.11 (65.90) 0.074 -24.37 (46.38) 0.181 0.462 Triglycerides (mg/dL) -8.00 (19.82) 0.262§
-12.12 (28.13) 0.262§
0.773ǂ HsCRP (mg/L) -42.20 (113.15) 0.314§
-48.03 (121.4) 0.161§
0.531ǂ
AST (IU/L) 1.88 (5.22) 0.310 -0.48 (3.66) 0.718 0.301
ALT (IU/L) 10.54 (17.75) 0.008§
7.27 (4.54) 0.017 0.360ǂ
Insulin (ng/ml) -5.90 (5.39) 0.011 1.77 (10.10) 0.635 0.065
Adiponectin (ng/ml) 0.63 (2.38) 0.449 -0.42 (3.15) 0.779§
0.386ǂ
experimental group tt at/aa* p2
Δ (SD) p1 Δ (SD)
p1
BMI (kg/m²) 0.61 (1.30) 0.913 0.70 (1.10) 0.046§
0.188ǂ
WC (cm) -1.33 (2.06) 0.175 -2.15 (3.33) 0.038 0.589
Hip (cm) -3.33 (1.21) 0.024§ -3.15 (2.40) <0.001 0.717ǂ
Waist-hip ratio 0.01 (0.26) 0.274 0.00 (0.03) 0.487 0.631
Body fat (%) 0.46 (6.01) 0.600§
0.84 (3.87) 0.448 0.792ǂ
Sum of skin folds 1.50 (8.33) 0.678 3.00 (5.50) 0.073 0.644
SBP (mmHg) 6.00 (8.67) 0.138§
3.38 (10.21) 0.255 0.310ǂ
DBP (mmHg) 0.667 (11.70) 0.895 -4.62 (10.12) 0.872 0.832
Glucose (mg/dL) 5.66 (5.81) 0.072§
4.07 (6.29) 0.038 0.660ǂ Total Cholesterol (mg/dL) -11.16 (12.31) 0.077 -3.69 (14.44) 0.375 0.290 HDL Cholesterol (mg/dL) 3.61 (3.77) 0.066 4.10 (7.15) 0.061 0.879 LDL Cholesterol (mg/dL) -3.16 (13.33) 0.586 2.23 (13.56) 0.564 0.429 Triglycerides (mg/dL) 3.00 (22.00) 0.752 -1.00 (17.38) 0.600§
0.792ǂ HsCRP (mg/L) -2.72 (4.46) 0.249§ -6.84 (7.41) 0.009§ 0.430ǂ
AST (IU/L) -1.80 (2.98) 0.200 0.47 (3.63) 0.645 0.200
ALT (IU/L) 5.18 (2.52) 0.004 6.54 (3.83) <0.001 0.441
Insulin (ng/ml) 4.85 (8.58) 0.225 9.68 (29.53) 0.363§
0.661ǂ Adiponectin (ng/ml) 0.27 (0.37) 0.136 -0.23 (0.66) 0.196§
0.054ǂ *risk allele (A); data are expressed as the mean (standard deviation); BMI: body mass index; WC: waist circumference; SBP: systolic blood pressure; DBP: diastolic blood pressure; HsCRP: ultrasensitive C-reactive protein; AST: aspartate transaminase; ALT: alanine transaminase; SD: standard deviation; p1
In Rankinen et al. (2010), adults underwent a five-month intervention that included sessions three times a week. The sessions included 30 minutes of exercise on a stationary bike during the first two weeks, which was subsequently increased to 50-minute sessions in subsequent weeks. The study was performed in a laboratory located in Los Angeles. This study demonstrated that subjects carrying an obesity-risk allele (A) exhibited increased BMI and %BF before the intervention. At the end of the study, the groups did not exhibit statistically significant differences in these parameters.
One of the intervention strategies to reduce %BF involved discussing nutritional guidelines with subjects and their parents to support healthy eating. An intervention study by Hakanen et al. (2009) was conducted using 1.062 children recruited in Finland. This strategy involved reducing the children’s exposure to environmental risk factors; fat intake among the intervention participants was reduced compared with children in the control group. In addition, the total cholesterol and its fractions were reduced in the intervention participants compared with the control group after the intervention. In our study, we also observed reduced total cholesterol and LDL as well as increased HDL values; however, the results were not significant.
For AA/AT genotype subjects in the experimental group in our study, we observed statistically significant, positive changes in hip circumference, waist circumference and hsCRP. For the TT genotype, we observed statistically significant changes in hip circumference. Relevantly, a similar intervention study (Schum et al. 2012) conducted in Germany that examined different anthropometric and biochemical parameters demonstrated that subjects exhibited statistically significant improvements in BMI, Homeostasis Model Assessment (HOMA) and %BF after an exercise period.
Similarly, a study (Haupt et al. 2008) featuring
1.466 German individuals with the FTO rs8050136
polymorphism suggested that other polymorphisms should be investigated, Nine months after an intervention program, the A allele of the polymorphism was associated with BMI, upper body fat and lean body mass (p<0.001). However, despite these results, the researchers concluded that this polymorphism is not involved in the effects of the intervention.
Recent research has indicated that the risk genotype in the rs1205 SNP of the CRP gene is as-sociated with the development of hypercholesterol-emia and that the rs2069845 SNP of the IL-6 gene is associated with the risk of developing obesity (Todendi et al. 2015). The current study suggests that these genes with relevant associations can be studied in a future intervention program.
Other researchers (Moleres et al. 2012) studied 168 teenagers from five Spanish cities (Granada, Madrid, Pamplona, Santander and Zaragoza) between 12 and 16 years old who underwent a 3-month intervention and who were genotyped for nine polymorphisms related to obesity, including the
FTO, MC4R (melanocortin 4 receptor), TMEM18
(transmembrane protein 18), IL-6 (interleukin 6), PPARG (proliferator-activated receptor gamma peroxisome) and ADIPQ genes (adiponectin). The obese adolescents carried more obesity-risk alleles compared with the overweight group. The researchers suggest that the obesity-related variants may exert a combined effect on the obesity risk and therefore can be used as an obesity-risk marker.
An intervention study developed by Müller et
al. (2008) investigated whether the FTO rs9939609
gene was associated with weight loss. The study included 519 children and German adolescents as well as overweight and obese adults and 178 normal weight subjects. Researchers confirmed that rs9939609 is associated with being overweight and obese during an early intervention period
associated with weight loss, fasting glucose levels, triglycerides and cholesterol.
Zlatohlavek et al. (2013) investigated two
obesity-risk genes (FTO and MC4R rs17817449
rs17782313) in a 4-week intervention study using 357 Czech children (13.7±4.9 years old with an
initial BMI of 30.8±4.6 kg/m2). Although these
researchers’ evaluated polymorphisms different from that evaluated in our study, they observed positive and significant changes in BMI and WC after intervention that suggested a decrease in subjects’ fat percentages. They also found significant decreases in LDL cholesterol and total triglycerides and a significant increase in HDL cholesterol.
No intervention studies in the literature featured a few subjects and a comparison of blood pressure as well as biochemical and anthropometric parameters for comparison with our study. Despite the relevance of this study, we should consider applicable limitations. Because this investigation was a quasi-experimental study, there was no randomization of subjects, increasing the risk of bias. Furthermore, the design used allowed for many losses during the intervention, resulting in a limited number of subjects by the end of the study. Moreover, the intervention time may have been insufficient for modification of the evaluated parameters. In particular, it has been suggested that experimental studies should be conducted with a longer intervention period (greater than 4 months). We conclude that children presenting AA, AT
and TT FTO rs9939609 polymorphisms exhibited
similar biochemical, anthropometric and blood pressure results with no statistically significant differences among the groups after a four-month interdisciplinary intervention program. However, we observed improvements after the intervention in the waist circumference, hip circumference, diastolic blood pressure, total cholesterol, HDL fraction, triglycerides, hsCRP and adiponectin in students carrying the obesity-risk allele.
Few articles have linked a biochemical response to obesity-related genetic polymorphisms after a multidisciplinary exercise program; therefore, it is important that future studies with a larger sample size confirm this conclusion because childhood obesity is a prevalent condition and threatens the future health of the population.
reFerences
ANDREASEN CH ET AL. 2008. Low physical activity accentuates the effect of the FTO rs9939609 polymorphism on body fat accumulation. Diabetes 57(1): 95-101. BURKE W AND DIEKEMA DS. 2006. Ethical issues arising
from the participation of children in genetic research. J Pediatr 149(1 Suppl): S34-S38.
CDC - CENTERS FOR DISEASE CONTROL and PREVENTION/NATIONAL CENTER FOR HEALTH STATISTICS. 2000. Growth Charts: United States. http:// www.cdc.gov/growthcharts.
DELAHANTY LM ET AL. 2012. Genetic predictors of weight loss and weight regain after intensive lifestyle modification, metformin treatment, or standard care in the Diabetes Prevention Program. Diabetes Care 35(2): 363-366.
FAUL F, ERDFELDER E, LANG AG AND BUCHNER A. 2007. G*Power 3: a flexible statistical power analysis program for the social, behavioral, and biomedical sciences. Behav Res Methods 39: 175-191.
FLUGELMAN A. 2015. Ethics, morals and society in personalized medicine. Harefuah 154: 599-603, 606. FORAITA R ET AL. 2015. Does the FTO gene interact with the
socioeconomic status on the obesity development among young European children? Results from the IDEFICS study. Int J Obes (Lond) 39(1): 1-6.
GATTÁS GJF, SEGRE M AND WÜNSCH FILHO V. 2002. Genetics, molecular biology and ethics: work and health connections. Ciênc Saúde Coletiva 7(1): 159-167. GONZÁLEZ-SÁNCHEZ JL, ZABENA C,
MARTÍNEZ-LARRAD MT, MARTÍNEZ-CALATRAVA MJ, PÉREZ-BARBA M AND SERRANO-RÍOS M. 2009. Variant rs9939609 in the FTO gene is associated with obesity in an adult population from Spain. Clin Endocrinol 70(3): 390-393.
HASLAM D. 2007. Obesity: a medical history. Obes Rev 8: 31-36.
HAUPT A, THAMER C, MACHANN J, KIRCHHOFF K, STEFAN N, TSCHRITTER O, MACHICAO F, SCHICK F, HÄRING HU AND FRITSCHE A. 2008. Impact of variation in the FTO gene on whole body fat distribution, ectopic fat, and weight loss. Obesity (Silver Spring) 16(8): 1969-1972.
JONSSON A, RENSTRÖM F, LYSSENKO V, BRITO EC, ISOMAA B, BERGLUND G, NILSSON PM, GROOP L AND FRANKS PW. 2009. Assessing the effect of interaction between an FTO variant (rs9939609) and physical activity on obesity in 15,925 Swedish and 2,511 Finnish adults. Diabetologia 52: 1334-1338.
LAPPALAINEN TJ ET AL. 2009. The common variant in the
FTO gene did not modify the effect of lifestyle changes on body weight: the Finnish diabetes prevention study. Obesity (Silver Spring) 17(4): 832-836.
LIU G, ZHU H, LAGOU V, GUTIN B, STALLMANN-JORGENSEN IS, TREIBER FA DY AND SNIEDER H. 2010. FTO variant rs9939609 is associated with body mass index and waist circumference, but not with energy intake or physical activity in European- and African-American youth. BMC Med Genet 11: 57.
LUCZYNSKI W, ZALEWSKI G AND BOSSOWSKI A. 2012. The association of the FTO rs9939609 polymorphism with obesity and metabolic risk factors for cardiovascular diseases in Polish children. J Physiol Pharmacol 63(3): 241-248.
MILLER SA, DYKES DD AND POLESKY HF. 1988. A simple salting out procedure for extracting DNA from human nucleated cells. Nucleic Acids Res 16: 1215. MOLERES A, RENDO-URTEAGA T, ZULET MA
MA, MARCOS A, CAMPOY C, GARAGORRI JM, MARTÍNEZ JA, AZCONA-SANJULIÁN MC AND MARTI A. 2012. Obesity susceptibility loci on body mass index and weight loss in Spanish adolescents after a lifestyle intervention. J Pediatr 161(3): 466-470.
MÜLLER TD, HINNEY A, SCHERAG A, NGUYEN TT, SCHREINER F, SCHÄFER H, HEBEBRAND J, ROTH CL AND REINEHR T. 2008. ‘Fat mass and obesity associated’ gene (FTO): no significant association
of variant rs9939609 with weight loss in a lifestyle intervention and lipid metabolism in German obese children and adolescents. BMC Med Genet 9: 85.
RANKINEN T, RICE T, TERAN-GARCIA M, RAO DC AND BOUCHARD C. 2010. FTO genotype is associated with exercise training-induced changes in body composition. Obesity (Silver Spring) 18(2): 322-326.
REINEHR T, WOLTERS B, ROTH CL AND HINNEY A. 2014. FTO Gene: association to weight regain after lifestyle intervention in overweight children. Horm Res Paediatr 81(6): 391-396.
SBC - SOCIEDADE BRASILEIRA DE CARDIOLOGIA. 2010. VI Diretrizes Brasileiras de Hipertensão. Arq Bras Cardiol 95: 1-51.
SCHUM J, BLUMENSTOCK G, WEBER K, SCHWEIZER R, PFAFF C, SCHURR N, RANKE MB, BINDER G AND EHEHALT S. 2012. Variants of the FTO gene in obese children and their impact on body composition and metabolism before and after lifestyle intervention. Exp Clin Endocrinol Diabetes 120(3): 128-131.
SLAUGHTER MH, LOHMAN TG, BOILEAU RA, HORSWILL CA, STILLMAN RJ, VAN LOAN MD AND BEMBEN DA. 1988. Skinfold equations for estimation of body fatness in children youth. Hum Biol 60(5): 709-723.
SONG X ET AL. 2014. Fat-mass and obesity-associated gene polymorphisms and weight gain after risperidone treatment in first episode schizophrenia. Behav Brain Funct 10: 35. TODENDI PF, KLINGER EI, FERREIRA MB, REUTER
CP, BURGOS MS, POSSUELO LG AND VALIM AR. 2015. Association of IL-6 and CRP gene polymorphisms with obesity and metabolic disorders in children and adolescents. An Acad Bras Cienc 87: 915-924.
YANG M ET AL. 2014. The effects of genetic variation in
FTO rs9939609 on obesity and dietary preferences in Chinese Han children and adolescents. PLOS ONE 9(8): e104574.