Original article
Assessment of proteolysis and lipolysis
in Serra cheese: effects of axial cheese location,
ripening time and lactation season
AC Macedo, ML Costa, FX
Malcata'
Escola Superior de Biotecnologia, Universidade Cat6lica Portuguesa,Rua Dr Ant6nio Bernardino de Almeida, 4200 Porto, Portugal
(Received 28 September 1994; accepted 15 December 1995)
Summary - The degrees of proteolysis and Iipolysis in Serra cheese were measured in cheese samples obtained from experiments laid out as a three-way facto rial design replicated twice. The independent variables studied were the location within the cheese (from the center to the surface), the position in the lactation season (from October to June) and the ripening time (from 0 to 35 days). Ali three variables had statistically significant effects on the concentration of water soluble peptides (WSP), but only the ripening time and the period within the lactation season affected the fat acidity (FA). The extents (alter the given ripening period) and the rates (averaged over the ripening period) of generation of WSP and FA were highest for spring and lowest for autumn. The lowest values for both the proteolysis extent and the proteolysis rate were obtained for the rind. The rates of proteolysis and lipolysis tended to decrease with ripening time; most of the lipolysis occurred during the first week, but proteolysis was still in progress by 35 days of ripening.
Serra cheese / proteolysis / Iipolysis / ripening / lactation season / axial cheese location
Résumé - Évaluation de la protéolyse et de la lipolyse dans le fromage Serra : effets de la position axiale dans le fromage, du temps d'affinage, et de la saison de lactation. Les taux de protéolyse et lipolyse dans le fromage Serra ont été mesurés dans des échantillons obtenus àpartir d'un modèle expérimental àtrois facteurs et deux répétitions. Les facteurs indépendants étudiés ont été la position dans le fromage (du centre àla surface), le stade dans la saison de lactation (d'octobre
àjuin) et le temps d'affinage (de 0à 35jours). Les trois facteurs ont eu statistiquement des effets significatifs sur la concentration en peptides solubles dans l'eau (PSE), mais seuls le temps d'affinage et le stade dans la saison de lactation ont affecté l'acidité de la matière grasse (AMG). Les niveaux (après la période d'affinage choisie) et les taux (moyennés au cours de la période d'affinage choisie) de production de PSE et AMG étaient au plus haut pendant le printemps et au plus bas pendant l'automne. Les valeurs minimales obtenues pour le niveau et le taux de protéolyse ont été mesurés sur la croûte du fromage. Les taux de protéolyse et de lipolyse tendaient àdécroître avec le temps d'affinage. La quasi-totalité de la lipolyse est apparue au cours de la première semaine, mais la protéolyse était encore en augmentation après 35jours d'affinage.
fromage Serra / protéolyse / lipolyse / affinage / saison de lactation / localisation axiale dans le fromage
INTRODUCTION
Serra cheese is the most widely known farm cheese manufactured from rawewe's milk in Portugal, and was the first to be le-gally protected by an Appellation d'origine
contrôlée. It is made twice daily, usually
from October to June, using raw ewe's milk mostly from the Bordaleira breed. In the c1assical manufacture of Serra, coagula-tion occurs at ca 30 "C after addicoagula-tion of a vegetable rennet obtained from an a-queous infusion of dried tlowers of wild this-tle (Cynara cardunculus L) in the complete absence of any deliberately added starter culture. The gel is then manually eut into small pieces, molded to the form of a fiat cylinder and rubbed with crude kitchen salt on both surfaces. Ripening conditions in the maturation room are chiefly determined by the outer tempe rature and humidity. Af-ter a ripening period of ca 45 days, a typical Serra cheese has a flat-cylinder shape wi-thout sharp edges, with a diameter of ca 17 cm, a height of ca 5 cm and a weight of ca 1.5 kg. The rind (which is periodically washed with warm water during ripening) is thin, uniform, smooth and weil formed, and possesses a soft straw-yellow color. The cheese has a few small eyes, and its color ranges from ivory to white. It has a buttery texture, which leads to sponta-neous and rapid deformation upon slicing, and possesses a strong aroma and a c1ean, smooth, slightly acid flavor (Macedo et al, 1993).
As emphasized elsewhere (Macedo et al, 1993), statistically reliable data pertaining to the microbiological and biochemical changes that occur during ripening of Serra cheese are scarce and mostly outdated (Antunes and Santos, 1943; Cruz and Borrego, 1948; Santos, 1957; Vieira de Sa et al, 1970; Vieira de Sa and Barbosa,
1982; Barbosa, 1986). Recently, Macedo et al (1994a,b) have extensively charac-terized both the qualitative and the
quanti-tative microbiological changes that occur
during ripening of this cheese. The aim of this research effort was thus to comple-ment these studies by providing estimates of the degree of proteolysis and lipolysis
over a 35-day ripening period, throughout
the lactation season and at various axial locations within the cheese; the strategy was to lay out a priori a replicated three-way factorial design, and to assess a pos-teriori the statistical significance of ail three factors (and their interactions) on those bio-chemical processes.
MATE RIALS AND METHODS
Manufacture and sampling
The cheeses were manufactured in a small dairy farm in three sequential periods within the lacta-tion season (viz November, February and May) from duplicated batches of four 0.5-kg cheeses each with 1 week interval between replicates. Cheesemaking followed traditional practices: alter the tempe rature of previously filtered raw ewe's milk had reached 28 "C. crude kitchen salt was added to a ratio of 12g/L and the milk was stirred until complete solubilization occurred. Thistle was mixed with tap water until a brown suspension was obtained, filtered through a fine, c1ean cloth and the c1ear filtrate was added to the milk (004 9 of dry crude thistle per liter of milk) and gently stirred; the milk was then allowed to rest at 28 "C until complete coagulation had oc-curred (a status that was empirically assessed by the cheesemaker upon gentle shaking of the coagulation vat). The curd was manually cut by stirring the coagulum with the bare hand; 10 min later, the curd pieces were poured into a fine cloth bag and lightly pressed so as to help in the expulsion of whey. Drainage of whey was corn-pleted via pressing of the fresh cheese while in the plastic perforated mold by a 10-kg metal block for 12 h (alter 6 h, the weight was
momen-Proteolysis and Iipolysis in Serra cheese
tarily relieved and the cheese was turned upside down). Final salting was done by rubbing the whole outer surface of the cheese with kitchen salt at a ratio of 15 g/cm2. Alter 12 h of salting, the cheeses were put in ripening chambers maintained at a temperature of 9 "C and a relative humidity of 95%. The cheeses were turned upside down daily for the whole duration of ripening. Two cheeses in the curd form and two cheeses ripened for 7,21 and 35 days were sent to our laboratory under refrigerated condi-tions (ca 4 OC). Each cylindrically shaped cheese was then divided into 12 slices in the axial direc-tion starting from the rind towards the center, and each set of two slices symmetrically located within the cheese relative to the centerwere thor-oughly mixed in order to obtain six final samples for analysis. The samples were frozen at 30 "C
in Whirl-pack™ vacuum bags (Cole Parmer, Chi-cago, Il, USA) until physical and biochemical analyses were in order.
Chemical analyses
The fat and moisture contents of ail cheeses were determined according to the method of Gerber-Van Gulik (Anon, 1975a,b) and the method of the atmospheric oven at 100 oC for 24 h, respectively (Case et al, 1985).
8iochemical analyses
Samples for water soluble peptide (WSP) as-says were prepared as follows: 109of a cheese sample were homogenized with 90 ml of water for 3 min in a Stomacher lab-Blender 400 (Se-ward Medical, London, UK) using sealed bags. These bags were held at 40"Cfor 1 h, and the homogenates were centrifuged at 10000 rpm for 30 min. The supernatant was then decanted and filtered through a 0.22urnSyrfil filter (Nuclepore, Cambridge, MA, USA) to remove casein mi-celles in suspension. The concentration of WSP was measured by the Folin-lowry method (Robyt and White, 1987) at 750 nm. Sheep al-bumin (Sigma Chemical, St louis, MO, USA) was used as the standard. The concentration of WSP was expressed as mg equivalent of sheep albumin (SA) per 9 of nonfat dry matter (NFDM) of cheese. NFDM was calculated for each cheese slice using experimental information on both fat and moisture contents determined as detailed earlier.
365
Diethyl ether soluble fat samples were pre-pared as follows: 10 9 of cheese were macerated with 6 9 anhydrous sodium sulfate (Merck, Darmstad, Germany) in a screw-capped bottle, and 60 ml of diethyl ether (Merck) were finally added. The homogenate was then stirred for 1 h, ultrasonicated for 1 min in a Sonorex RK100 (Bandelin, Berlin, Germany), stirred for an extra hour and filtered through no 1 paper (Whatman, Maidstone, UK). The precipitate in the bottle was resuspended in 40 ml diethyl ether, filtered and pooled with the previous filtered diethyl ether ex-tract. Fat acidity (FA) was measured by titration of the diethyl ether soluble fat extract with 0.01 N ethanolic solution of potassium hydroxide (Merck) using phenolphthalein as indicator (Anon, 1991). FA was expressed as mmol per 1009of fat; the fat content of each cheese slice was experimentally determined as detailed in the previous subsection.
Experimental design
Three time periods within the lactation season were considered (corresponding to the months of November, February and May in an attempt to properly represent autumn, winter and spring, respectively), four points within the ripening period (0, 7, 21 and 35 days) and six axial posi-tions within the cheese (slice 1 or rind, to slice 6 or center). A 3 x 4 x 6 full factorial design repli-cated twice was thus generated (Box et al, 1978) as a basis for the performance of the experi-ments.
Statistical analyses
Statistical analyses were based on the ANOVA table method and were performed with the aid of the Statview package (Abacus Concepts, Berkeley, CA, USA). Validity of this methodo-logy is ensured only if the experimental errors are independent and normally distributed and if variance is constant. Since our original data, y, failed to satisfy these assumptions, they had to be mathematically transformed into:
yÀ_1 À
y'--
1where
y
denotes the geometric mean of the original data and parameter À is deter-mined according to the likelihood estima-tion method (Box et al, 1978), prior to ap-plication of the ANOVA methodology. Inorder to more easily understand the expe-rimental information generated, and since the conclusions obtained on the statistical significance of the transformed data are also fully valid for the original data (Box et al, 1978), those data associated with stati-stically significant factors were transfor-med back into the original form and even-tually plotted. In order to further refine the analysis of significance, ail possible pair-wise comparisons were performed using a multiple f-statistic as reference (a test u-sually known as Fisher's pratected least si-gnificant difference test).
RESULTS
Proteolysis
The two time variables (ie, the ripening time, T, and the position in the lactation season, S) and the space variable (ie, the axial location within the cheese, L) have
statistically significant effects on the concentration of WSP (P < 0.0001). The importance of the factors chosen was smal-lest for the axial location (with an F ratio of the sum of squares associated therewith to the sum of squares of experimental resi-duals, F, of 6.4, and a percent fraction of the sum of squares associated therewith to the whole sum of squares, R, of 6.2%) and highest for the ripening time (F = 95.3 and
R= 55.4%) in terms of the concentration of WSP. The interaction T*S was the single second-order interaction associated with a statistically significant effect on the concen-tration of WSP (F
=
5.6 and R=
6.6%). It could also be concluded that the concen-trations of WSP: i) were statistically diffe-rent between the curd and the cheese after 1 week (P < 0.0001) and between the 7-and 21-day-old cheese (P < 0.0001), but not between the cheeses thereafter(P=0.18); ii) were statistically different be-tween slice 1 and ail the five inner slices, which showed to be statistically similar to one another at the 5% significance level;
and iii) were statistically different between autumn and spring, between winter and spring (P < 0.0001), as weil as between au-tumn and spring although at a higher level of significance (P
=
0.0057).Although the concentration of WSPs in the curds did not exhibit significant varia-tions throughout the lactation season
(P = 0.58), this observation did not hold for
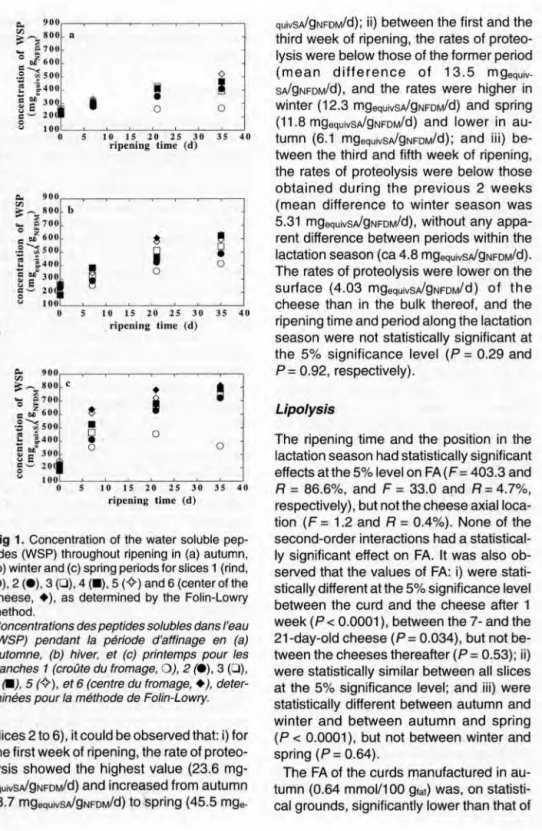
the 35-day-old cheeses (P = 0.004). Fully ripened cheeses in autumn (fig 1a) showed the lowest concentrations of WSP (ca 417 mgequivsA!gNFDM)whereas the highest values were observed in the spring (ca 706 mgequivsA!gNFDM)counterparts (fig 1c). Profiles of the concentration of WSP versus the axial location within cheese during ripening were similar thraughout the lacta-tion season (fig 1). Based on the values obtained for the concentration of WSP, it was apparent that after 7 days of ripening there was a significant departure of the be-havior exhibited by the rind (ie, slice 1) relative to that exhibited by the bulk of the cheese. For 35-day-old cheese, the rind showed the lowest concentration of WSP (347 mgequivsA!gNFDM),the center of the cheeses (ie, slice 6) the highest values (557 mgequivsA!gNFDM)and departure of the bulk from the rind behavior increased quan-titatively from autumn (456 vs 264 mgequiv-SA!gNFDM)to spring (814 vs 363 mgequiv. SA!gNFDM). The variations of the concentration of WSP were relatively fast at the initial stages of ripening and eventually tended to a plateau as time elapsed (fig 1).
The ripening time and the period within the lactation season were statistically signi-ficant (P < 0.0001 and P
=
0.0002, respec-tively) in terms of proteolysis rate (calcula-ted here as the change in the concentration of WSP between consecutive sampling limes within the ripening period divided by the corresponding time interval), whereas the axial location wilhin the cheese was on the edge of statistical significance accor-ding to common standards (P = 0.058).Proteolysis and Iipolysis in Serra cheese o
1
•
o o 10 15 20 25 30 ripening lime (d) 35 40a
"" 90 [Ila: ~_
80 c..-. Q70~ ~rz
60 .~-;::;50-
.
E ].40 ëcl'30s e
=- 20 o '" 10 o 0 o b 0 0~
e
0i
01
0 0 0 q 0 10 15 20 25 30 35 40 . ripening lime (d) b•
j
~
•
~
o o oc
10 15 20 25 30 ripening lime (d) 35 40Fig 1. Concentration of the water soluble pep-tides (WSP) throughout ripening in (a) autumn, (b) winter and (c) spring periods for slices 1 (rind, 0), 2 (e), 3 (0), 4 (.), 5 (~) and 6 (center of the cheese, +), as determined by the Folin-Lowry method.
Concentrations des peptides solubles dans l'eau (WSP) pendant la période d'affinage en (a) automne, (b) hiver, et (c) printemps pour les tranches 1 (croûte du fromage, 0), 2 (e), 3 (0), 4 (II), 5 (~), et 6 (centre du fromage, +),de ter-minées pour la méthode de Folin-Lowry.
slices 2 to 6), it could be observed that: i) for the first week of ripening, the rate of proteo-Iysis showed the highest value (23.6 mg-equivSAigNFDM/d)and increased from autumn (8.7 mgequivsAigNFDM/d)tospring (45.5
mge-367
quivSAigNFDM/d);ii) between the first and the third week of ripening, the rates of protee-Iysis were below those of the former period (m ean d iffe rence of 13.5 mgequiv-SAigNFDMid),and the rates were higher in winter (12.3 mgequivsAigNFDM/d)and spring (11.8 mgequiVSA/gNFDM/d)and lower in au-tumn (6.1 mgequivsAigNFDM/d);and Iii) be-tween the third and fifth week of ripening, the rates of proteolysis were below those obtained during the previous 2 weeks (mean difference to winter season was 5.31 mgequivsAigNFDM/d),without any appa-rent difference between periods within the lactation season (ca 4.8 mgequivsAigNFDM/d). The rates of proteolysis were lower on the surface (4.03 mgequivSA/gNFDM/d)of the cheese than in the bulk thereof, and the ripening time and period along the lactation season were not statistically significant at the 5% significance level (P = 0.29 and
P
=
0.92, respectively) .Lipolysis
The ripening time and the position in the lactation season had statistically significant effects at the 5% level on FA (F
=
403.3 andR
=
86.6%, and F=
33.0 and R=
4.7%, respectively), but not the cheese axialloca-tion (F=
1.2 and R=
0.4%). None of the second-order interactions had a statistical-Iy significant effect on FA. It was also ob-served that the values of FA: i) were stati-stically different at the 5% significance level between the curd and the cheese after 1 week (P< 0.0001), between the 7- and the 21-day-old cheese (P=
0.034), but not be-tween the cheeses thereafter (P = 0.53); ii) were statistically similar between ail slices at the 5% significance level; and iii) were statistically different between autumn and winter and between autumn and spring(P < 0.0001), but not between winter and
spring (P=0.64).
The FA of the curds manufactured in au-tumn (0.64 mmol/100 gfal) was, on statlsti-cal grounds, significantly lower than that of
10 15 20 25 30 ripening lime (d)
35 40
Fig 2. Value of fat acidity (FA) lhroughoul ripen-ing in aulumn (0), winter (e) and spring (0) periods, as determined by ethanolic acid/base titration.
Valeurs de l'acidité de la matière grasse (FA) pendant la période d'affinage en automne (0), hiver (e), et printemps (0), déterminées pour titra tian éthanolique acide/base.
the curds manufactured in both spring (1.02 mmol/100 glat) and winter (1.48 mmol/100 glat); however, the FA ob-tained in the cheeses after 35 days of ripe-ning was highest in spring (11.9 mmol/100 gfat) and lowest in autumn (6.6 mmol/100 gfat) (fig 2).
Irrespective of the period within the lacta-tion season considered, the lipolysis rate (calculated here as the change in the FA between consecutive sampling times wi-thin the ripening period divided by the cor-responding time interval) for the first week (0.95 mmol/100 g'at/dl was significantly higher than for the remaining ripening pe-riod (0.09 and 0.04 mmol/100 gIat/d, res-pectively). During the first week, it was also observed that the lipolysis rate was signifi-cantly lower for the autumn period (0.77 mmol/100 gfat/d) th an for the winter and spring periods (which showed rates of 1.11 and 0.96 mmol/100 gfat/d, respective-Iy). For the following 2 weeks of ripening, the lipolysis rate did not decrease in spring (0.20 mmol/100 glat/d) as much as in au-tumn (0.036 mmol/100 glat/d) and winter (0.034 mmol/1 00 glat/d). By the end of ripe-ning (Iast 2 weeks), the lipolysis rate was
lower in autumn (0.003 mmol/100 glat/d) than in winter (0.015 mmol/100 glat/d) and in spring (0.092 mmol/100 glat/d).
DISCUSSION
The samples of curd exhibited low levels for WSP and FA; this observation was ex-pected, however, because it is weil estab-lished that freshly secreted milk contains small amounts of peptides and amino acids, on the one hand, and free fatty acids, on the other, which are not necessarily the result of proteolysis (Reiter et al, 1969) and Iipolysis (Needs and Anderson, 1984), res-pectively. Differences in FA in the curd thraughout the lactation season were also expected because the fat composition of ewe's milk varies within fairly wide limits, and these limits are a direct function of the composition of the feed (Ramos and Juarez, 1981) which in turn depends on such seasonal factors as the weather (the Iivestock is predominantly fed with silage during winter and with fresh grass during spring). The lactation season of Bordaleira ewes usually starts in October and ends in June; therefore, the November milk collec-tion is representative of an initial stage, February of a middle stage and May of a final stage of lactation. Ramos and Juarez (1981) reported that titratable acidity ten-ded to increase with advancement within the lactation season, being highest after a-bout 3 months fram the beginning thereof; titratable acidity then tended to decrease up to 5 months, and increase again towards the end of the lactation season.
The increases in WSP and FA were highest in spring and lowest in autumn. In addition to the aforementioned variation in the milk composition, this fact may be partly explai-ned by differences in the ripening condi-tions, especially the temperature and the water activity (Lawrence et al, 1987); tem-perature is higher during spring than during autumn in the Serra region, and the salt to water ratio is lower in autumn than in spring
Proteolysis and lipolysis in Serra cheese 369
(Macedo et al, 1994a). As ripening time elapses, the observed rates of both proteo-Iysis and lipolysis in our experimental cheeses decrease most probably because the natural substrates for the two enzyme-catalyzed processes (casein and triglyce-rides, respectively) are gradually depleted.
From the observation by Macedo et al (1994a) that after 7 days of ripening the salt levels and pH values at the surface and in the interior of the cheese are statistically difterent from one another, statistical difte-rences in the WSP concentrations between the surface (ie, the rind) and the interior of the cheese (ie, the bulk) would be expected because the catalytic activity of protei-nases (contributed by the vegetable rennet and the microbial flora) is aftected by both pH and ionic strength (which is directly re-lated to the salt concentration), and the rates of growth of those microbes able to synthesize proteinases are affected by both pH and water activity (which is directly related to the salt concentration as weil). Our results have indicated that the lower WSP concentrations occur on the rind, a fact that may be partly accounted for by the higher saltto moisture ratio on the surface of the cheese when compared with the in-terior (Macedo et al, 1994a); in addition, the observed difterences of the concentration of WSP and FA between the rind and the bulk are highest in the spring, the period for which the difterences in the salt to moistu re ratio are also maximal (Macedo et al, 1994a). In terms of FA, statistically signifi-ca nt difterences between the surface and the interior of the cheese could not be ob-served. Two possible alternative explana-tions may be provided for this observation: either fat breakdown in Serra cheese i) is mainly associated with native milk lipases (Anon, 1991) or lipases present in the crude vegetable rennet as contaminants, both of which are expected to be uniformly distributed throughout the cheese, or ii) is mainly associated with lipases produced by microorganisms which grow more actively
during the first week of ripening (Macedo et al, 1994a), the most intense period of llpo-Iysis. Possible support for the microbial ar-guments on proteolysis (Fox, 1981) and li-polysis may be obtained by realization that the predominant microflora in Serra cheese are lactic acid bacteria (LAB), coliforms and yeasts, especially Leuconostoc lactis,
Lac-toccoccus lactis ssp lactis, Lactobacillus
paracasei, Hafnia alvei and
Sporobolo-myces roseus (Macedo et al, 1994b).
AI-though LAB show, in general, considerably high proteolytic but relatively low lipolytic activities (Choisy et al, 1987), such psy-chrotrophic bacteria as pseudomonas and coliforms are known to secrete thermoresi-stant proteinases (Grappin et al, 1985) and lipases (Anon, 1991). Furthermore, P
f1uo-rescens exhibits relatively high rates of
pro-duction of lipases in cheese which are se-riously impaired by decreasing pH (Stead, 1986), a situation which occurs during the first week of ripening in Serra cheese as a result of the action of LAB (Macedo et al, 1994a).
Although this study attempted to show statistically difterent behaviors of proteoly-sis and lipolyproteoly-sis in Serra cheese in terms of two time variables and one space variable, the empirical rationale presented relating the microflora and these two enzyme-dri-ven processes requires further fundamen-tal studies for complete verification without which understanding of the ripening pro-cess will not be fully possible.
ACKNOWLEGMENTS
The authors are grateful to the members of the technical board of ANCOSE (the Portuguese As-sociation of Breeders of Serra da Estrela) for their cooperation encompassing the local manu-facture and transport of the cheeses to the ESB premises. Financial support for AC Macedo was provided by a PhD fellowship (CIENCIA BD-1741/91-IF). Financial support for ML Costa was provided by a training fellowship (PEDIP). This project was funded by research grants provided by AI (the Portuguese Innovation Agency) within
the R&D project Impravement ot traditianal cneeses and their technalagy (MAQUETTE) and by AAIR (European Community) within the R&D project Design and production ot an enzymatic and microbial mixture ta improve the process ewe's cheese (Spain, France, Italy and Partugal) safety and quality and ta get a novel functianal tood as a respanse ta European demand far new products law in chotesterot and protein enriched.
REFERENCES
Anon (1975a) Détermination de la teneur en matière grasse - norme internationale ISO 3432. In:
Organi-sation Internationale de Normalisation - Fromages
Anon (1975b) Détermination de la teneur en matière grasse - norme internationale ISO 3433. In:
Organi-sation Internationale de Normalisation - Fromages
Anon (1991) Basic principles of the methods used for free fatty acid determination. In: Determination of Free Fatty Aeids in Milk and Milk Products. FIUIDF Bull 265, 8-18
Antunes TM, Santos 1(1943) Elementos para0estudo do queijo da Serra. Bol Pecu 11, 61-90
Barbosa M (1986) Serra da Estrela cheese. FIUIDF Bull 202,133-134
Box GEP, Hunter WG, Hunter JS (1978) Statistics for Experimenters. An Introduction ta Design, Data Analysis, and Madel Building. John Wiley, New York
Case RA, Bradley RL, Williams RR (1985) Chemical and physical methods. In: Standard Methods for the Examination of Dairy Products (GH Richardson, ed) American Public Health Association, Washington DC,USA
Choisy C, Desmazeaud M, Gripon JC, Lamberet G, Le-noir J, Tourneur C (1987) Os fen6menos microbio-16gicos e enzimàticos, e a bioquimica da cura (afi-naçâo). In:0Oueijo (A Eck, J Hermier, J Labiee,
J Lenoir, F Weber, eds; R Casquilho, trad) Publi-caç6es Europa-América, Mem Martins, pp 102-149
Cruz AA, Borrego JO (1948) Queijo à ovelheira e queijo à cabreira. Bol Pecu 16,17-25
Fox PF (1981) Proteinases in dairy technology. Neth Milk Dairy J 35, 233-245
Grappin R, Rank TC, Oison NF (1985) Primary proteo-Iysis of cheese proteins during ripening: a
review.-J Dairy Sci 68, 531-540
Lawrence RC, Creamer LK, Gilles J (1987) Texture de-velopment during cheese ripening. J Dairy Sei 70,
1748-1760
Macedo AC, Malcata FX, Oliveira JC (1993) The techno-logy, chemistry, and microbiology of Serra cheese: a review. J Dairy Sei 76, 1725-1739
Macedo AC, Costa ML, Malcata FX (1994a) Charac-terization of the microflora of Serra cheese: evolu-tion throughout ripening time, lactation period, and axial location. Int Dairy J 4, 1-16
Macedo AC, Malcata FX, Hogg TA (1994b) Microbiolo-gical profile in Serra ewes' cheese along ripening.
JAppl Bacteriol79, 1-11
Needs EC, Anderson MJ (1984) Lipid composition of milks from cows with experimentally induced masti-tis. J Dairy Res 51,239-249
Ramos MM, Juarez M (1981) The composition of ewe's milk and goal's milk. FIUIDF Bull 140, 5-8
Reiter B, Sorokin Y, Pickering A, Hall AJ (1969) Hydro-Iysis of fat and protein in small cheeses made under aseptic conditions. J Dairy Res 36,65-76
Robyt JF, White BJ (1987) Biochemical Techniques. Theory and Practice. Wavelend Press, Prospect Heights, IL, USA
Santos lA (1957) 0queijo da Serra. Bol Pecu 25, 5-17 Stead 0 (1986) Microbiallipases: their characteristics,
role in food spoilage and industrial uses.JDairy Res
53,481-505
Vieira de Sa F, Barbosa M (1982) Technological study of Serra da Estrela cheese-making. In: Proc IDF Gongr, Moscow, Russia, V1B1-462
Vieira de Sa F, Machado BR, Pinto OR, Cruz IV, Carneiro MD, Barbosa M, Reis MC (1970) Oufmica e
Biolo-gia: Maturaçao em queijos de ovelha Serra e Serpa.