Copyright © 2018 The Author(s). Published by VGTU Press
This is an Open Access article distributed under the terms of the Creative Commons Attribution License (http://creativecommons. org/licenses/by/4.0/), which permits unrestricted use, distribution, and reproduction in any medium, provided the original author and source are credited.
*Corresponding author. E-mails: [email protected]; [email protected]
ISSN 2029-4913 / eISSN 2029-4921 2018 Volume 24 Issue 3: 950–968 https://doi.org/10.3846/20294913.2016.1261374
PERCEIVED KEY DETERMINANTS OF PAYMENT INSTRUMENT
USAGE: A FUZZY COGNITIVE MAPPING-BASED APPROACH
Fabiana R. R. L. SANTOS1, Fernando A. F. FERREIRA2, 3*, Ieva MEIDUTĖ-KAVALIAUSKIENĖ4, 5
1ISCTE Business School, University Institute of Lisbon, Avenida das Forças Armadas, 1649-026, Lisbon, Portugal 2ISCTE Business School, BRU-IUL, University Institute of Lisbon,
Avenida das Forças Armadas, 1649-026 Lisbon, Portugal 3Fogelman College of Business and Economics, University of Memphis,
Memphis, TN 38152-3120, USA
4Faculty of Business Management, Vilnius Gediminas Technical University, Saulėtekio al. 11, LT-10223 Vilnius, Lithuania
5BRU-IUL, University Institute of Lisbon Avenida das Forças Armadas, 1649-026 Lisbon, Portugal
Received 30 May 2016; accepted 13 November 2016
Abstract. The recent economic climate has had direct repercussions on people’s daily lives. This has occurred not only in how they use payment instruments, but is also evinced in new concerns adjacent to technological advances, people’s safety and the credibility of financial institutions. In this regard, the banking sector has had a crucial role in countries’ economic development, making it increasingly important to understand how the banking system operates and what payment instru-ments are available to users. Relying on specialized literature and the application of fuzzy cogni-tive mapping, this study aims to understand the cause-and-effect relationships between customers’ preference factors in using payment instruments. The results show that usability aspects and safety concerns constitute the factors which users pay more attention to. Strengths and limitations of our proposal are also discussed.
Keywords: payment instruments, customer usage preferences, decision aid, FCM. JEL Classification: C44, C45, M10, G20.
Introduction
The increasing transformations in the environment in which financial institutions oper-ate have caused changes in the way they act. Many European countries have recently been confronted with the difficulties inherent to processes such as new strategy implementation, the creation of new products and services, and the need to adapt to and adopt emerging technologies and distribution channels (Reis et al. 2013). In this regard, it seems important that financial and banking institutions should maintain a steady rhythm of adaptation and competitiveness, in order to be able to compete with new actors with a high technological and commercial capability. Following this line of thinking, economic agents, customers and shareholders in particular have been aligning their expectations with new technologies, thus increasing their level of demand with the options put at their disposal (Ahmadirezaei 2011; Dangolani 2011; Reis et al. 2013).
While it is remarkable the way that the availability of information and the ease in rela-tionships between economic agents potentiate the development of the banking system and, in turn, that of the existing payment systems, consumers’ choices are based on certain de-terminants which condition their preferences as to the payment instrument to use in daily transactions. In this regard, understanding the factors which influence customers’ choices seems to be increasingly relevant for banking institutions, particularly if taking into account that those same choices may influence the planning and investments made by banks at the distribution channel level (Pinto, Ferreira 2010; Gogoski 2012; Reis et al. 2013). As such, this paper aims to identify the determining factors affecting customers’ choices regarding existing payment instruments, as well as to analyze the cause-and-effect relationships among those determinants.
From the methodological point of view, this study makes use of fuzzy cognitive map-ping, so as to ascertain, with a panel of decision makers, which factors are behind customers’ choices for a specific payment instrument. Although it is known that the fuzzy cognitive mapping approach allows static, dynamic and loop analyses of results for the modeling of dynamic systems, it can also be used for (simple) knowledge representation (cf. Peng et al. 2016). Indeed, in the current study, rather than analyzing system dynamics, our focus will be on the cognitive structure of factors affecting customers’ choices regarding existing pay-ment instrupay-ments. The epistemological stance thus taken differentiates our work from extant literature reporting fuzzy cognitive map applications, which has generally been more focused on the analysis of variable dynamics, rather than on knowledge sharing and representation per se. Given that the current study is process-focused, particular attention is given to the group knowledge sharing witnessed at the time of creation of the fuzzy cognitive map (FCM).
The next section presents the literature review, so as to provide the framing of the study. Then, the methodological framework of the applied techniques is provided. The following section presents the results, indicating the determinants which have a greater influence in customers’ choices and highlighting the practical implications of the insights obtained. The last section concludes the paper, highlighting the study’s contribution and limitations, and presenting ideas for future research.
1. Literature review
Payment systems play an important role in financial markets, as they facilitate commercial exchanges between consumers and producers and promote the stability and efficiency of the financial sector and of the economy at large (Hancock, Humphrey 1997). As Kahn and Roberds (2009: 1) state, “payment systems are the plumbing of the economy – a collection of conduits that is essential, pervasive, and boring (until there’s a malfunction)”. In practice, we can note that these systems function as an intermediation network, which is concerned with the transactions among economic agents. Given the complexity that usually exists in modern payment systems, one should keep in mind that any payment system is equipped with payment instruments or means which make possible the movement of funds, i.e. they constitute a set of tools or procedures that make possible the transfer of funds from a payer to a payee (Kokkola 2010).
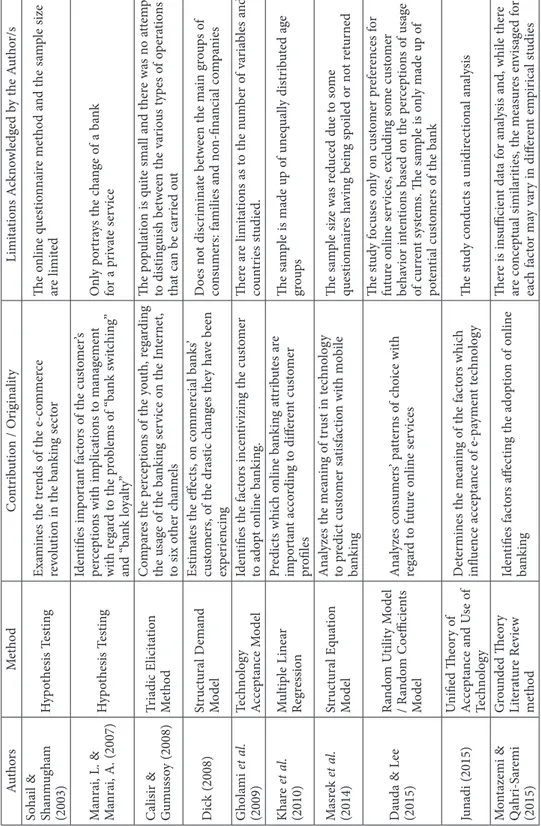
According to Hancock and Humphrey (1997), Kokkola (2010) and Ramos et al. (2011), there is a wide variety of different payment instruments, which should be analyzed individu-ally, as they present particular characteristics and, moreover, depend on the type of relation-ship and transaction between payer and payee. In practice, as the authors state, payment instruments can be categorized into: (1) cash payments, which are associated with low value face-to-face operations among individuals or between an individual and a vendor (Kokkola 2010); and (2) non-cash payments, which involve the transfer of funds between bank ac-counts (i.e. the means used by the payer to authorize a bank transfer of funds to a payee, or by the payee to withdraw funds from a payer (Kokkola 2010)). Non-cash payments are nor-mally carried out by the banking system (Hancock, Humphrey 1997) and the better known ones include: cards, credit transfer orders, direct debit, checks, commercial effects and electronic currency. Naturally, the transaction channel varies, as it can be associated to the Internet, phone banking, automated teller machines (ATMs) or mobile services, each one invoking strong customer preferences. As Reis et al. (2013) and Ferreira et al. (2016b) state, customer preferences may influence banks’ planning and investment at the distribution channel level, highlighting the importance of studying this topic. Given the above, the contributions made thus far have been important, as they resort to different methodologies and rely on different epistemological bases. Table 1 summarizes some of these studies, highlighting their contribu-tions and limitacontribu-tions.
According to Table 1, it seems evident that some of the reasons for which customers prefer a given instrument are related to technological innovation and the new distribution channels available, which tend to be more appealing and captivating for younger target groups. However, it seems equally evident that the studies carried out to date are unable to explain the manner in which the determinants of customer preference interrelate with each other. In other words, perhaps more important than identifying the determinants themselves might be to understand the cause-and-effect relationships emerging from their analysis. As Kim and Lee (1998: 303) state, “knowledge engineering is one of the most important tasks in developing expert systems. One of the primary objectives […] is to develop a complete, consistent and unambiguous description of the knowledge base”. In this regard, the present study resorts to cognitive mapping techniques to analyze the cause-and-effect relationships among the factors determining customers’ preferences in the usage of payment instruments.
Ta ble 1. C on tr ib ut io ns r ega rdin g t he s tud y o f c us to m er p ref er en ce fac to rs in t he u sa ge o f p ay m en t in str um en ts Aut hor s Me th od C on tr ib ut io n / Or ig in ali ty Limi ta tio ns A ck no w le dg ed b y t he A ut ho r/s So ha il & Sh anm ug ha m (2003) H yp ot hesi s T es tin g Exa min es t he t ren ds o f t he e-co mm er ce re vo lu tio n in t he b an kin g s ec to r Th e o nlin e q ues tio nn air e m et ho d a nd t he s am ple size ar e limi te d M anra i, L. & M anra i, A. (2007) H yp ot hesi s T es tin g Iden tifies im po rt an t fac to rs o f t he c us to m er ’s per cep tio ns w ith im plic at io ns t o m an ag em en t w ith r ega rd t o t he p ro blem s o f “ ba nk sw itc hin g” an d “ ba nk lo ya lty” On ly p or tra ys t he c ha ng e o f a b an k fo r a p riva te s er vice Ca lisir & G um us so y (2008) Tr iadic E lici ta tio n Me th od C om pa res t he p er cep tio ns o f t he y ou th, r ega rdin g th e u sa ge o f t he b an kin g s er vice o n t he I nt er net, to six o th er c ha nn els Th e p op ul at io n i s q ui te sm al l a nd t her e wa s n o a ttem pt to di stin gui sh b et w een t he va rio us t yp es o f o pera tio ns th at c an b e c ar rie d o ut Dic k (2008) St ruc tura l D em an d Mo de l Es tim at es t he eff ec ts, o n co mm er ci al b an ks ’ cu sto m er s, o f t he dra stic c ha ng es t he y h av e b een exp er ien cin g D oes n ot di scr imin at e b et w een t he m ain g ro ups o f co ns um er s: fa mi lies a nd n on-fin an ci al co m pa nies G ho la mi et al. (2009) Te chn olog y Accep ta nce M ode l Iden tifies t he fac to rs in cen tiv izin g t he c us to m er to ado pt o nlin e b an kin g. Th er e a re limi ta tio ns a s t o t he n um ber o f va ria bles a nd co un tr ies s tudie d. K ha re et al. (2010) M ul tip le L in ea r Reg res sio n Pr edic ts w hic h o nlin e b an kin g a ttr ib ut es a re im po rt an t acco rdin g t o diff er en t c us to m er pr ofi le s Th e s am ple i s m ade u p o f un eq ua lly di str ib ut ed a ge gro up s M asr ek et al. (2014) St ruc tura l E qu at io n Mo de l A na lyzes t he m ea nin g o f t ru st in t ec hn olog y to p re dic t c us to m er s at isfac tio n w ith m ob ile ba nk in g Th e s am ple size wa s r ed uce d d ue t o s om e ques tio nn air es h av in g b ein g s po ile d o r n ot r et ur ne d D aud a & L ee (2015) Ra ndo m U tili ty M ode l / R an do m C oefficien ts Mo de l A na lyzes co ns um er s’ p at ter ns o f c ho ice w ith rega rd t o f ut ur e o nlin e s er vices Th e s tud y f oc us es o nl y o n c us to m er p ref er en ces f or fu tur e o nlin e s er vices, ex cludin g s om e c us to m er be ha vio r in ten tio ns b as ed o n t he p er cep tio ns o f u sa ge of c ur ren t sys tem s. Th e s am ple i s o nl y m ade u p o f po ten tia l c us to m er s o f t he b an k Jun adi (2015) U nifie d Th eo ry o f Accep ta nce a nd U se o f Te chn olog y D et er min es t he m ea nin g o f t he fac to rs w hic h infl uen ce accep ta nce o f e-p ay m en t t ec hn olog y Th e s tud y co nd uc ts a unidir ec tio na l a na lysi s M on tazemi & Q ahr i-Sa remi (2015) G ro un de d Th eo ry Li tera tur e R ev ie w me tho d Iden tifies fac to rs a ffe ct in g t he ado pt io n o f o nlin e ba nk in g Th er e i s in sufficien t d at a f or a na lysi s a nd , w hi le t her e ar e co ncep tu al simi la rit ies, t he m ea sur es en vi sa ge d f or eac h fac to r m ay va ry in diff er en t em pir ic al s tudies
2. Methodology
2.1. Background on cognitive mapping
Frank and Badre (2015) and Sponarski et al. (2015) refer to cognitions as mental processes used to perceive, think, remember and understand, as well as to represent the act of us-ing those same processes. Cognition is a complex process arisus-ing from the interactions of vast populations of neurons and interconnected cerebral systems (i.e. interactions between neurological structures and the motor system). These processes can be artificial or natural, conscious or unconscious, and can be analyzed and applied in numerous research areas.
Human cognition relates to various concepts, among which are the mind, reasoning, per-ceptions and learning. In other words, through daily living, individuals acquire knowledge in their mind which allows them to generate sensations endowed with meaning and value. In this way, the relationship between the quantity and the quality of the information obtained has repercussions, and affects individuals’ minds. This occurs because individuals relate that which is created in their minds with real perceptions (i.e. real images which are observed), endowing those creations with meaning. Cognitive maps thus appear as a way to understand mental processes and the manner in which these interact with reality.
According to Kitchin and Freudschuh (2000), cognitive maps can be used in three dif-ferent ways: (1) to describe the way people learn, remember and process information about their surroundings; (2) to describe the process of thinking about the cause-and-effect rela-tionships; and (3) as a methodological approach, in order to understand cognition in general (i.e. through the construction of a cognitive map). It is worth noting, however, that the use of maps to visualize, understand and describe phenomena and/or reality is not new. Indeed, Carlucci et al. (2013) indicate that maps are one of the oldest tools representing non-verbal communication, in addition to being highly descriptive. Gavrilova et al. (2013) complement this idea, stating that maps are visual tools which facilitate representation and communica-tion of informacommunica-tion, providing support for its identificacommunica-tion and interpretacommunica-tion, and facilitat-ing its codification and consultation, through the stimulation of mental associations.
As a methodological approach, cognitive maps were first introduced as such in Tolman’s (1948) study Cognitive Maps in Rats and Men. Tolman (1948) defended that behaviors and emotions are not only analyzed as individual situations, but are also influenced by a set of underlying perceptions and interpretations (i.e. the way people react depends on how they perceive or interpret the situation at hand). According to Eden (2004: 673), cognitive maps are used to describe an individual’s thinking about a problem. As the author states, a “cognitive map is the representation of thinking about a problem that follows from the process of mapping”. Carlucci et al. (2013), in turn, declare that cognitive maps are used with the purpose of organizing and storing knowledge, so as to reduce individuals’ cognitive load and improve the mechanisms of perception and analysis of real situations, not only describing the problems but also enabling the improvement of learning. Indeed, cognitive maps are a useful tool that allows cause-and-effect relationships between variables in a certain problem or phenomenon to be modeled.
Papageorgiou and Salmeron (2013), Ferreira and Jalali (2015) and Ferreira et al. (2017) consider that cognitive maps have been increasing in notoriety because they represent an
im-portant methodological approach, which takes human metacognitive perception as its starting point, and allows complex decision problems to be structured and clarified. Given that human decision processes take place in a subjective and potentially difficult to explain context, cogni-tive mapping has been playing an increasingly important role in supporting decision making, insofar as “it provides a means of representing the way in which a decision maker models his decision-making environment, in terms of the concepts he himself uses” (Klein, Cooper 1982: 64). Indeed, cognitive maps take on a relevant position in what regards communication and decision, because they constitute a structuring instrument for complex decision problems, allowing experiences and ideas to be shared, and promoting discussion and learning between the participants involved. Wellman (1994) also indicates that cognitive maps take on the form of a qualitative graph of decision makers’ subjective beliefs, with a focus on the cause-and-effect relationships between the concepts (i.e. cognitive maps are a qualitative model based on the definition of variables and on the cause-and-effect relationships these present) (Well-man 1994; Carlucci et al. 2013; Jalali et al. 2016). In this regard, there are (Well-many studies using cognitive maps not only as a useful tool for decision making, but also as a mechanism which analyzes people’s perceptions of complex decision problems. This makes cognitive maps valu-able both as a decision-making support instrument and as a possible communication tool (Axelrod 1976; Carlucci et al. 2013; Gavrilova et al. 2013; Ferreira et al. 2016b).
In a more specific perspective, and according to Carlucci et al. (2013), cognitive maps have two main functions: (1) a descriptive function, stemming from the visual representation provided by maps to structure the decision problem at hand (i.e. they allow unnecessary cognitive load to be reduced); and (2) a function of support to decision making, in which maps are seen as an approach to systems thinking and a support to the processes of generation and elaboration of ideas, not necessarily connected to a specific question or to a context. The cognitive maps introduced by Axelrod (1976) are representations of an individual’s causal beliefs, represented by points and arrows. In the map, the points represent concepts, and the arrows are cause-and-effect statements relating the concepts between them. Eden (2004) complements this, referring that cognitive maps are characterized by their structural hierar-chy and are usually represented as a graph, where the goal appears at the top. This structure, however, is frequently drawn as a circle or presented as a chain. As an example, Figure 1 presents part of a cognitive map.
As Figure 1 illustrates, cognitive maps represent a network of ideas which are hierarchi-cally structured and connected by arrows that indicate cause-and-effect relationships (Axel-rod 1976; Kosko 1986; Wellman 1994; Eden 2004). The arrows can present positive (+) or negative (–) signs, depending on the cause-and-effect relationship between the concepts. In this regard, the existence of such relationships between concepts for decision making allows the participants to, during the development of the map, learn and improve their perceptions of the decision problem, re-evaluating and re-structuring their points of view. It should be noted, however, that there are various types of cognitive maps (Fiol, Huff 1992). Nevertheless, the importance of this type of representation, whether for decision making or for commu-nication, can be perceived, especially in situations of scarcity of information and/or a high degree of uncertainty, as in the case of understanding which factors determine customers’ choices in using a given payment instrument.
2.2. Cognitive Maps and Fuzzy Cognitive Maps
Kosko (1986) provided a valuable contribution to cognitive cartography when, in the 1980s, he created the so-called Fuzzy Cognitive Maps (FCMs), by combining cognitive maps with fuzzy logic. In practice, “fuzzy cognitive mapping is a flexible tool that has been successfully applied in a large number of disciplines” (Kok 2009: 124). In this regard, FCMs are considered a structuring tool which enables the representation and study of people’s and systems’ behav-ior (Calais 2008; Kok 2009; Salmeron 2009; Kang et al. 2012; Carlucci et al. 2013; Jetter, Kok 2014). For Kim and Lee (1998: 304), FCMs are “fuzzy signed directed graphs with feedback, and they model the world as a collection of concepts (or factors) and causal relations between concepts”. In turn, Kang et al. (2012), Salmeron and Gutierrez (2012) and Vidal et al. (2015) argue that FCMs represent an interactive structure of concepts (i.e. thinking network), in which each one interacts with the others, showing their dynamics and the different aspects of the system’s behavior. In other words, according to Kok (2009), Salmeron et al. (2012), Salmeron and Lopez (2012) and Lopez and Salmeron (2013), FCMs portray a system of beliefs for a given domain, being composed of concepts C, which represent the system’s main drivers, and are connected by directional arrows, which represent the cause-and-effect relationships between them.
As Carlucci et al. (2013) state, FCMs have two significant characteristics to be highlight-ed: (1) the cause-and-effect relationship between concepts/criteria follows a fuzzy logic, which is to say, it is no longer only signs that are used to indicate the type of causality (positive or negative), but a numeric interval ranging from –1 to 1 is also used, representing the degree of influence/intensity between the concepts; and (2) the system is dynamic and involves feed-backs, where a change in one of the concepts affects the others, allowing a temporal dimen-sion to be added to the operations of FCMs. Papageorgiou et al. (2012: 46) thus state that an
Fig. 1. Example of a cognitive map [partial view] Source: Eden (2004: 675).
“FCM is a dynamic tool because cause-effect relations and feedback mechanisms are involved”. In this regard, an FCM’s structure consists of concepts/nodes and arcs connecting them. Fig-ure 2 illustrates, as an example, the conceptual structFig-ure of an FCM, where Ci is a concept/
criterion and wij represents the degree of influence/intensity in the relationship between the criteria i and j. Each concept represents a characteristic in the system and is associated to a fuzzy value Ai in the range between [0, 1] or, in a binary logic, {0, 1}.
As for the weights of the arcs, they assume fuzzy values in the interval [–1, 1] or, in a trivalent logic, {–1, 0, 1}. In other words, there are three possibilities for each cause-and-effect relationship between the concepts/criteria: (1) positive causality (wij > 0) (i.e. an increase/
decrease in the value of Ci increases/decreases the value of Cj); (2) negative causality (wij <
0) (i.e. an increase/decrease in the value of Ci increases/decreases the value of Cj); and (3) no causality (wij = 0), which indicates an absence of relationship between Ci and Cj (cf. Kosko
1986; Kim, Lee 1998; Kok 2009; Salmeron 2009; Kang et al. 2012; Papageorgiou et al. 2012; Carlucci et al. 2013; Ferreira, Jalali 2015; Ferreira 2016).
Despite their graphical importance, FCMs are supported by an underlying mathematical model, which consists of a 1 × n state vector A, where the values of n concepts are included; and an n × n matrix of weights, also known as an adjacent or connecting matrix, holding the values/weights of the interconnections wij with regard to the n concepts included in the FCM.
The proposed matrix typically presents values equal to zero in all the entries of the main diagonal, meaning that a criterion seldom causes itself and that the value of each criterion is influenced by the values of the interconnected concepts as well as its previous value. In this regard, an FCM may freely interact and, at each interaction, the criteria assume new values. According to Kosko (1986) and Kang et al. (2012), formulation (1) allows the value of each criterion/concept to be calculated, based on the influence of the interconnection between concepts whose values are in the interval [–1, 1].
Fig. 2. Example of an FCM Source: Kang et al. (2012: 78).
w12 w42 w61 w14 w34 w24 w35 w46 w56 w16 w36 w32 w43 w23 w52 C1 C2 C3 C5 C4 C6
− − = ≠ = ω + ≤ ≤ ≤ ≤
∑
1 1 1 2 1 2 1 , 0 1, 0 1. n t t t i ij j j i i j A f k A k A k k (1)According to Kang et al. (2012), At
j (where Atj ∈ [0, 1]) consists in the activation level of
concept Cj in moment t. In turn, f represents the activation function (for details, see Trentin
2001; Salmeron 2009; Glykas 2010), and the coefficient k1 expresses the influence of the
concepts’ interconnection to a new value of Ai for concept Ci. As can be seen in Figure 2, the concept/criterion C6 is influenced by concepts C1, C3, C4 and C5. As such, a new state vector Anew appears by the multiplication of the state vector Aold by the weigh matrix W. In this way,
the variables’ strength (i.e. ranking) can be obtained at the end of the simulation, allowing the visualization of how the system is understood in a fuzzy logic. For it to be possible to deter-mine the system’s state, it is necessary that several simulations be done. In allowing complex decisional situations to be analyzed, FCMs resemble neural networks. Carlucci et al. (2013: 213) highlight that the “FCM is appropriate for data poor situations”. They are powerful dy-namic models of understanding, which reveals their importance in decision-making support.
3. Application and results
This study proposes to develop a fuzzy evaluation model whose objective culminates in iden-tifying the factors influencing customers’ choices of payment instruments. In this regard, the use of the methodology presented above intends to explore the applicability of FCMs in the context in question. As already pointed out, FCMs allow static, dynamic and loop analyses of the results to be produced, to model dynamic systems. Still, as clarified at the outset, in this study, perhaps more important than analyzing system dynamics might be to identify the cognitive structure of factors affecting customers’ choices regarding existing payment instru-ments. This is a result of the constructivist stance assumed from the beginning.
Carlucci et al. (2013) state that it is possible to initiate an FCM creation process through any of the following techniques: (1) from questionnaires; (2) by extraction from written texts; (3) by drawing it from data that shows cause-and-effect relationships; and, lastly, (4) through interviews with people who draw a map directly, such as one or more experts or a work team, for instance. In this study, and following Kim and Lee’s (1998) orientations, the development of the FCM was initiated through group meetings, i.e. face-to-face sessions with experts, named decision makers, who had specific knowledge about the subject in question (see also Ferreira et al. 2016a). Other factors were also taken into account in choosing the decision makers, such as their availability for participating in two group meetings with an approximate duration of 4 hours each.
The sessions were conducted by two facilitators (i.e. researchers) and the panel of decision makers included 4 professionals from the banking sector and 2 individuals who frequently use payment instruments – according to Eden and Ackermann (2001: 22), the facilitator should “relate personally to a small number (say, three to ten persons)”. These panel members were from the Central-West region of Portugal, half of them were female, with ages between 20 and 50 years old and their interaction was important to confront differing points of view
(i.e. customer logic vs. banking institution logic). In other words, the fact that the group was composed by participants from different banks and of different hierarchical levels, and by frequent users of various payment instruments, ensured the discussion was spontaneous and heterogeneous, allowing the debate underlying the structuring process to be enriched, and incorporating different perceptions in the cognitive structure that served as basis for the formulation of an FCM. Given the constructivist nature of this methodological approach, it should be noted that the focus lies in the process, rather than the end result. This suggests the technical procedures used may work well with any other group of decision makers. As Bell and Morse (2013: 962) state, “there is less emphasis on outputs per se and more focus on process”.
3.1. Developing the Fuzzy Cognitive Map
In order to elucidate participants on how the work session would proceed, an introduction was made enunciating the objectives and principles of the methodology to be applied. The next step consisted of presenting the trigger question: “Based on your values and personal experience, which factors influence a customer’s choice in the use of payment instruments?”. This question was asked by one of the facilitators and served as the starting point to the debate among the participants, allowing an environment of sharing of knowledge and experiences to be fostered.
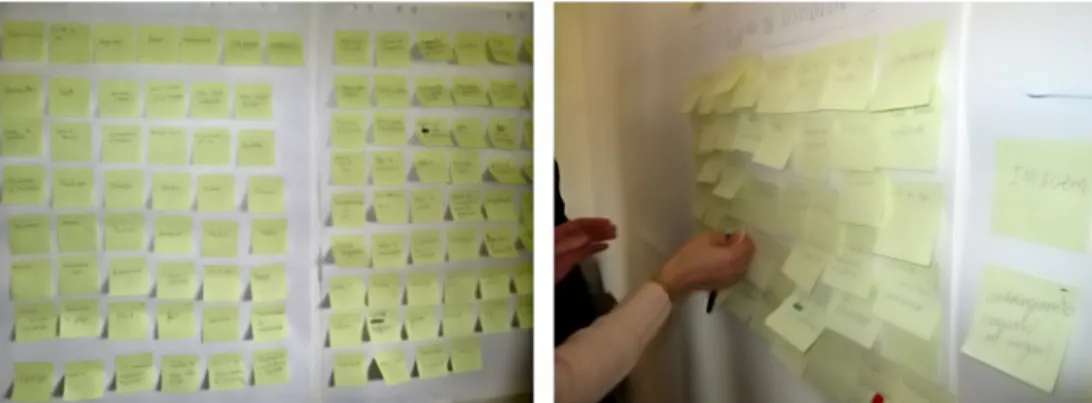
In this study, the response to the trigger question relied on the “post-its technique” (Acker-mann, Eden 2001), which is characterized, as the name indicates, by the use of post-its, and in which each decision maker writes one (and only one) criterion in each post-it that s/he considers pertinent in responding to the problem presented. For this process to be completed and satisfy the members of the panel, discussion and negotiation become key elements. From an operational point of view, large sheets of paper were placed in the meeting room and, in an initial stage, post-its were made available as required by the members of the panel. Fol-lowing this stage, the decision makers were asked to group the criteria by clusters (i.e. areas of interest), with a total of six clusters having been found: safety concerns; return to the client; image; services provided; usability aspects; and specific constraining factors. Finally, participants were asked to sort the post-its in terms of importance, placing the most important criteria at the top of each cluster and the least important at the bottom (see Ferreira et al. (2016a) for more details). Figure 3 presents snapshots of different stages of the structuring process. Although illustrative, these snapshots are important to highlight the humanistic, interactive and constructivist nature of the procedures followed.
Based on the Decision Explorer software (www.baxia.com), Figure 4 illustrates the final version of the “collective” or “strategic” map, which was validated by the decision makers following analysis and discussion.
The following stage of the process allowed the intensity of the cause-and-effect relation-ships between the criteria to be analyzed. For this purpose, the decision makers were asked to define, in the second group session, the degree of influence (i.e. intensity) inherent to each of the connections identified in the preceding stage. Given that each decision maker has a unique personal opinion, this stage of the process was quite time-consuming and demanding, and was successfully concluded thanks to the negotiation process established among the members of the panel. To visualize the dynamics of intensity between criteria, two software programs were
required, namely: FCMapper (http://www.fcmapper.net) and Pajek (http://mrvar.fdv.uni-lj.si/ pajek/). Figure 5 illustrates the cognitive structure of what, at a later stage, would become an FCM (for the purposes of simplifying Figure 5, the criteria were replaced by numbers. The complete version of the structure, containing all the specifications, is available upon request).
Once the FCM had been constructed, and per the method’s theoretical exposition, the inten-sities of the various connections within it were inserted into the adjacency matrix. Size restric-tions prevent us from displaying the adjacency matrix in this paper. However, Table 2 exemplifies the matrix used, where Ci and wij stand as defined by the panel members on a collective basis.
In practice, the values wij were directly projected by the decision makers following a long process of negotiation. Figure 6 exemplifies this exercise with the presentation of cluster 8 – i.e. safety concerns – where each connection’s degree of intensity lies in the range [–1, 1].
After conducting various tests and simulations in order to achieve the system’s stability, the visualization and analysis of the FCM’s dynamics provided the decision makers with a vision of the impact each criterion could have in choosing a payment method. Indeed, as Carlucci et al. (2013: 216) state, “once the FCM has been constructed, it can be used to model and simulate the behaviour of the system including performance objectives, process performance objectives and knowledge assets”. The next stage was then based on the analysis of the central-ity of the key determinants influencing customer’s choice of payment instruments.
3.2. Analysis of the centrality of preference factors
In conformity with Carlucci et al. (2013: 216), “through a proper neural network computa-tional model, [...] what we can get is an idea of the ranking of the variables in relationship to each other according to how the system is perceived in the FCM”. In this regard, Table 3 pres-ents the factors which, according to the collective perception of the panel members, present the highest centrality indices. In practice, according to the decision makers, when a customer thinks of using a payment instrument, s/he first considers usability aspects (24.30), followed by safety concerns (13.40), some specific constraining factors (8.90), return to the client (7.50), services provided (6.30) and image (5.70) (the complete list of factors and of their respective degrees of centrality is available upon request).
Fig . 4. G ro up cog ni tiv e m ap
Table 2. Adjacency matrix C1 C2 … Cn–1 Cn C1 0 w12 … w1n–1 w1n C2 w21 0 … w2n–1 w2n … … … … Cn–1 wn–11 wn–12 … 0 wn–1n Cn wn1 wn2 … wnn-1 0
Fig. 5. Basis cognitive structure of the FCM
Fig. 6. Analysis of intensity degrees Our results are aligned with the findings of Gholami et al. (2009) and Pinto and Ferreira (2010) with regard to the importance of usability aspects, in so far as this was the factor identified by the panel members displaying the highest level of centrality (this is also in ac-cordance with the findings of Ramos et al. (2011), Reis et al. (2013), Masrek et al. (2014) and Montazemi and Qahri-Saremi (2015), who highlight the importance of trust in technology to predict bank customer satisfaction).
Table 3. Degree of centrality of customer’s preference factors
Factor/Criterion Reference Outdegree Indegree Centrality
Usability Aspects 7 0.70 23.60 24.30
Safety Concerns 3 1.00 12.40 13.40
Specific Constraining Factors 8 0.80 8.10 8.90
Return to the Client 4 0.80 6.70 7.50
Services Provided 6 0.70 5.60 6.30
Although our focus was on the key determinants of payment instrument usage reveal-ing the highest levels of centrality, it should be emphasized, however, that the construction of an FCM in this study allowed a large number of other determinants to be identified. In particular, the issue of “image” can be easily overlooked, but can at times affect customers’ choices. Indeed, as one of the participants noted, some of the concepts included in the FCM are seldom taken into account in current appraisal and planning practices, but the con-struction of an FCM, despite its subjectivity, allowed the group to formalize them in a very natural manner, contributing to reduce the rate of omitted variables in the decision-making framework (for further discussion, see also Ferreira, Jalali 2015).
Beyond the ranking of key determinants provided in Table 3, another aspect to be high-lighted results from the ability to dynamically analyze the assessment system itself and under-stand the cause-and-effect relationships among the variables identified. In other words, this means that this method of structuring and analysis allows not only the determinants most influencing customer preferences to be hierarchized, according to their degree of centrality, but also to explore how an oscillation in intensity might affect the rest of the system, which in turn empowers planning decisions. Indeed, as pointed out by Papageorgiou et al. (2012: 45), “FCMs are simple, yet powerful tools for modeling and simulation of dynamic systems, based on domain-specific knowledge and experience”. Additionally, it was possible to identify several practical advantages of the FCM approach, such as: the interactivity, dynamism, flex-ibility and simplicity of the techniques used. Obviously, our framework is not without its own limitations, which form the basis of our recommendations.
Conclusion and recommendations
This study acknowledges the importance that payment instruments hold in people’s daily lives. In this regard, an FCM was developed with the aim of increasing the knowledge on cause-and-effect relationships between the factors influencing consumers’ choices with re-gard to the use of payment instruments. As Carlucci et al. (2013: 217–218) state, “FCM as a useful tool to support decision making […] allows to simulate the relationships which link together the development of organizational components, the impact on organizational processes, and the achievement of strategic objectives”.
As discussed, FCMs are characterized by their similarity to neural networks, whose prac-tical application focuses on the analysis of complex problems (Jetter, Kok 2014; Ferreira et al. 2016a, 2016b). As clarified at the outset, these maps allow static, dynamic and loop analyses to be produced. The main concern/aim of this study, however, was to identify the cognitive structure of factors affecting customers’ choices regarding existing payment instruments. The constructivist epistemological stance assumed allowed our contribution to be markedly different from the extant literature on FCM applications, which has generally been more focused on the analysis of variable dynamics, rather than on knowledge sharing and repre-sentation per se.
Transparency and simplicity in decision making are also characteristics attributed to FCMs, something which became evident for the members of the panel in this study. Indeed, according to the collective perception of these elements, usability aspects, safety concerns,
some specific constraining factors, return to the client, services provided and image are the factors most influencing the choice of a payment instrument in detriment of another/others. Beyond that, understanding the cause-and-effect relationships among the various factors for choice was something which was welcomed by the members of the panel.
In broad terms, the FCM developed in this study allows for greater transparency in the analysis of key determinants of payment instrument usage. This is reinforced by the direct involvement of a panel of decision makers, who provided consistency, functionality and realism to the system developed, and allowed for its validation. Due to the constructivist nature of this study, one should bear in mind, however, that its greatest contribution relies on the learning process inherent to the construction of an FCM. As noted by Zavadskas and Turskis (2011: 398), “most importantly perhaps was the finding that decision analysis can be useful to help multiple stakeholders understand what they agree and disagree about, focus on the things that they disagree about and explore options that are better for everyone involved”. In this sense, and despite its subjective nature, our framework is flexible enough to accommodate new information, allowing decision makers to immediately assess the impact of new data or determinants of payment instrument usage on the results. In light of this reasoning, the proposal presented in this study is work-in-progress, and improve-ments are always possible (and desirable) to strengthen banks’ planning decisions in this domain.
Given the results obtained, it seems evident that FCMs hold great potential, in meth-odological terms, for broadening our understanding of the scope of factors which lead banking customers to choose one given payment instrument over another/others. How-ever, some of the difficulties felt in the context of the present study should be borne in mind, such as that of assembling a panel of decision makers with availability to participate in the group sessions, as well as the need to deal with the great amount of subjectivity which characterizes the entire structuring process. In this regard, it is recommended that future initiatives consider involving: (1) other decision makers with intrinsic char-acteristics different from those of the present study; and (2) other contexts of applicabil-ity, namely those contemplating eventual methodological complementarities (i.e. ally-ing FCMs to other methodological approaches) (see Zavadskas and Turskis (2011) and Zavadskas et al. (2014) for examples). This would allow, with advantages to banks and customers, to increase the interest and discussion surrounding the application of FCMs in the development of payment instruments.
Acknowledgements
A non-copyrighted version of this paper was previously presented at the 2016 BAI Inter-national Conference, held in Nagoya, Japan. The authors gratefully acknowledge the superb contribution and infinite willingness of the panel members: António Fonseca, Joana Brites, Joana Oliveira, João Laranjeira, Marisa Carmo and Pedro Ribeiro. Institutional and facility support from the ISCTE Business School, University Institute of Lisbon, Portugal, is also acknowledged.
References
Ackermann, F.; Eden, C. 2001. SODA – Journey making and mapping in practice, in J. Rosenhead, J. Mingers (Eds.). Rational analysis for a problematic world revisited: problem structuring methods for complexity, uncertainty and conflict. 2nd ed. Chichester: John Wiley & Sons, 43–60.
Ahmadirezaei, H. 2011. The effect of information technology in Saderat banking system, Procedia – Social and Behavioral Science 30: 23–26. https://doi.org/10.1016/j.sbspro.2011.10.005
Axelrod, R. 1976. Structure of decision the cognitive maps of political elites. New Jersey: Princeton Uni-versity Press.
Bell, S.; Morse, S. 2013. Groups and facilitators within problem structuring processes, Journal of the Operational Research Society 64(7): 959–972. https://doi.org/10.1057/jors.2012.110
Calais, G. 2008. Fuzzy cognitive maps theory: implications for interdisciplinary reading: national im-plications, Focus on Colleges, Universities, and Schools 2(1): 1–16.
Calisir, F.; Gumussoy, A. 2008. Internet banking versus other banking channels: young consumers’ view, International Journal of Information Management 28(3): 215–221.
https://doi.org/10.1016/j.ijinfomgt.2008.02.009
Carlucci, D.; Schiuma, G.; Gavrilova, T.; Linzalone, R. 2013. A fuzzy cognitive map based approach to disclose value creation dynamics of ABIs, in Proceedings of the 8th International Forum on Knowl-edge Asset Dynamics (IFKAD-2013), 12–14 June 2013, Zagreb, Croatia, 207–219.
Dangolani, S. 2011. The impact of information technology in banking system: a case study in bank Keshavarzi Iran, Procedia – Social and Behavioral Sciences 30: 13–16.
https://doi.org/10.1016/j.sbspro.2011.10.003
Dauda, S.; Lee, J. 2015. Technology adoption: a conjoint analysis of consumers’ preference on future online banking services, Information Systems 53: 1–15. https://doi.org/10.1016/j.is.2015.04.006
Dick, A. 2008. Demand estimation and consumer welfare in the banking industry, Journal of Banking & Finance 32(8): 1661–1676. https://doi.org/10.1016/j.jbankfin.2007.12.005
Eden, C. 2004. Analyzing cognitive maps to help structure issues or problems, European Journal of Operational Research 159(3): 673–686. https://doi.org/10.1016/S0377-2217(03)00431-4
Eden, C.; Ackermann, F. 2001. SODA – the principles, in J. Rosenhead, J. Mingers (Eds.). Rational analysis for a problematic world revisited: problem structuring methods for complexity, uncertainty and conflict. 2nd ed. Chichester: John Wiley & Sons, 21–41.
Ferreira, F. 2016. Are you pleased with your neighborhood? A fuzzy cognitive mapping-based approach for measuring residential neighborhood satisfaction in urban communities, International Journal of Strategic Property Management 20(2): 130–141. https://doi.org/10.3846/1648715X.2015.1121169
Ferreira, F.; Jalali, M. 2015. Identifying key determinants of housing sales and time-on-the-market (TOM) using fuzzy cognitive mapping, International Journal of Strategic Property Management
19(3): 235–244. https://doi.org/10.3846/1648715X.2015.1052587
Ferreira, F.; Jalali, M.; Ferreira, J. 2016a. Integrating qualitative comparative analysis (QCA) and fuzzy cognitive maps (FCM) to enhance the selection of independent variables, Journal of Business Re-search 69(4): 1471–1478. https://doi.org/10.1016/j.jbusres.2015.10.127
Ferreira, F.; Jalali, M.; Ferreira, J.; Stankevičienė, J.; Marques, C. 2016b. Understanding the dynamics behind bank branch service quality in Portugal: pursuing a holistic view using fuzzy cognitive map-ping, Service Business 10(3): 469–487. https://doi.org/10.1007/s11628-015-0278-x
Ferreira, F.; Spahr, R.; Sunderman, M.; Banaitis, A.; Ferreira, J. 2017. A learning-oriented decision-making process for real estate brokerage service evaluation, Service Business 2016 11(3): 453–474 .
Fiol, C.; Huff, A. 1992. Maps for managers: where are we? Where do we go from here?, Journal of Man-agement Studies 29(3): 266–285. https://doi.org/10.1111/j.1467-6486.1992.tb00665.x
Frank, J.; Badre, D. 2015. How cognitive theory guides neuroscience, Cognition 135: 14–20.
https://doi.org/10.1016/j.cognition.2014.11.009
Gavrilova, T.; Carlucci, D.; Schiuma, G. 2013. Art of visual thinking for smart business education, in Proceedings of the 8th international forum on knowledge asset dynamics (IFKAD-2013), 12–14 June 2013, Zagreb, Croatia, 1754–1751.
Gholami, R.; Al-Somali, S.; Clegg, B. 2009. An investigation into the acceptance of online banking in Saudi Arabia, Technovation 29(2): 130–141. https://doi.org/10.1016/j.technovation.2008.07.004
Glykas, M. 2010. Fuzzy cognitive maps: advances in theory, methodologies, tools and applications (studies in fuzziness and soft computing). Berlin: Springer Science & Business Media.
https://doi.org/10.1007/978-3-642-03220-2
Gogoski, R. 2012. Payment systems in economy: present and future tendencies, Procedia – Social and Behavioral Sciences 44: 436–445. https://doi.org/10.1016/j.sbspro.2012.05.048
Hancock, D.; Humphrey, D. 1997. Payment transactions, instruments, and systems: a survey, Journal of Banking & Finance 21(11/12): 1573–1624. https://doi.org/10.1016/S0378-4266(97)00046-0
Jalali, M.; Ferreira, F.; Ferreira, J.; Meidutė-Kavaliauskienė, I. 2016. Integrating metacognitive and psy-chometric decision making approaches for bank customer loyalty measurement, International Jour-nal of Information Technology and Decision Making 15(4): 815–837.
https://doi.org/10.1142/S0219622015500236
Jetter, A.; Kok, K. 2014. Fuzzy cognitive maps for futures studies: a methodological assessment of con-cepts and methods, Futures 61: 45–57. https://doi.org/10.1016/j.futures.2014.05.002
Junadi, S. 2015. A model of factors influencing consumer’s intention to use e-payment system in Indo-nesia, Procedia – Computer Science 59: 214–220. https://doi.org/10.1016/j.procs.2015.07.557
Kahn, C.; Roberds, W. 2009. Why pay? An introduction to payments economics, Journal of Financial Intermediation 18(1): 1–23. https://doi.org/10.1016/j.jfi.2008.09.001
Kang, B.; Deng, Y.; Sadiq, R.; Mahadevan, S. 2012. Evidential cognitive maps, Knowledge-Based Systems 35: 77–86. https://doi.org/10.1016/j.knosys.2012.04.007
Khare, A.; Khare, A.; Singh, S. 2010. Role of consumer personality in determining preference for online banking in India, Journal Database Marketing & Customer Strategy Management 17(3/4): 174–187.
https://doi.org/10.1057/dbm.2010.18
Kim, H.; Lee, K. 1998. Fuzzy implications of fuzzy cognitive map with emphasis on fuzzy causal rela-tionship and fuzzy partially causal relarela-tionship, Fuzzy Sets and Systems 97(3): 303–313.
https://doi.org/10.1016/S0165-0114(96)00349-1
Kitchin, R.; Freundschuh, S. 2000. Cognitive mapping past, present and future. London and New York: Routledge.
Klein, J.; Cooper, D. 1982. Cognitive maps of decision makers in a complex game, Journal of the Op-erational Research Society 33(1): 63–71. https://doi.org/10.1057/jors.1982.7
Kok, K. 2009. The potential of fuzzy cognitive maps for semi-quantitative scenario development, with an example from Brazil, Global Environmental Change 19(1): 122–133.
https://doi.org/10.1016/j.gloenvcha.2008.08.003
Kokkola, T. 2010. The payment system. Frankfurt: AM Main.
Kosko, B. 1986. Fuzzy cognitive maps, International Journal of Man-Machine Studies 24(1): 65–75.
https://doi.org/10.1016/S0020-7373(86)80040-2
Lopez, C.; Salmeron, J. 2013. Dynamic risks modelling in ERP maintenance projects with FCM, Infor-mation Sciences 256: 25–45. https://doi.org/10.1016/j.ins.2012.05.026
Manrai, L.; Manrai, A. 2007. A field study of customers’ switching behavior for bank services, Journal of Retailing and Consumer Services 14(3): 208–215. https://doi.org/10.1016/j.jretconser.2006.09.005
Masrek, M.; Mohamed, I.; Duad, N.; Omar, N. 2014. Technology trust and mobile banking satisfaction: a case of Malaysian consumers, Procedia – Social and Behavioral Sciences 129: 53–58.
https://doi.org/10.1016/j.sbspro.2014.03.647
Montazemi, A.; Qahri-Saremi, H. 2015. Factors affecting adoption of online banking: a meta-analytic structural equation modeling study, Information & Management 52(2): 210–226.
https://doi.org/10.1016/j.im.2014.11.002
Papageorgiou, E.; Roo, J.; Huszka, C.; Colaert, D. 2012. Formalization of treatment guidelines using fuzzy cognitive maps and semantic web tools, Journal of Biomedical Informatics 45(1): 45–60.
https://doi.org/10.1016/j.jbi.2011.08.018
Papageorgiou, E.; Salmeron, J. 2013. A review of fuzzy cognitive maps research during the last decade, IEEE Transactions on Fuzzy Systems 21(1): 66–79. https://doi.org/10.1109/TFUZZ.2012.2201727
Peng, Z.; Wu, I.; Chen, Z. 2016. Research on steady states of fuzzy cognitive map and its application in three-rivers ecosystem, Sustainability 8: 1–10. https://doi.org/10.3390/su8010040
Pinto, S.; Ferreira, F. 2010. Technological dissemination in the Portuguese payments system: an em-pirical analysis to the region of Santarém, International Journal of Human Capital and Information Technology Professionals 1(4): 55–75. https://doi.org/10.4018/jhcitp.2010100104
Ramos, J.; Ferreira, F.; Monteiro-Barata, J. 2011. Banking services in Portugal: a preliminary analysis to the perception and expectations of front office employees, International Journal of Management and Enterprise Development 10(2/3): 188–207. https://doi.org/10.1504/IJMED.2011.041549
Reis, J.; Ferreira, F.; Monteiro-Barata, J. 2013. Technological innovation in banking services: an explor-atory analysis to perceptions of the front office employee, Problems and Perspectives in Management 11(1): 34–49.
Salmeron, J. 2009. Augmented fuzzy cognitive maps for modelling LMS critical success factors, Knowl-edge-Based Systems 22(4): 275–278. https://doi.org/10.1016/j.knosys.2009.01.002
Salmeron, J.; Gutierrez, E. 2012. Fuzzy grey cognitive maps in reliability engineering, Applied Soft Computing 12(12): 3818–3824. https://doi.org/10.1016/j.asoc.2012.02.003
Salmeron, J.; Lopez, C. 2012. Forecasting risk impact on ERP maintenance with augmented fuzzy cogni-tive maps, IEEE Transactions on Software Engineering 38(2): 439–452.
https://doi.org/10.1109/TSE.2011.8
Salmeron, J.; Vidal, R.; Mena, A. 2012. Ranking fuzzy cognitive maps based scenarios with TOPSIS, Expert Systems with Applications 39(3): 2443–2450. https://doi.org/10.1016/j.eswa.2011.08.094
Sohail, M.; Shanmugham, B. 2003. E-banking and customer preferences in Malaysia: an empirical
inves-tigation, Information Sciences 150(3/4): 207–217. https://doi.org/10.1016/S0020-0255(02)00378-X
Sponarski, C.; Vaske, J.; Bath, A. 2015. The role of cognitions and emotions in human-coyote
interac-tions, Human Dimensions of Wildlife 20: 238–254. https://doi.org/10.1080/10871209.2015.1010756
Tolman, E. 1948. Cognitive maps in rats and men, The Psychological Review 55(4): 189–208.
https://doi.org/10.1037/h0061626
Trentin, E. 2001. Networks with trainable amplitude of activation functions, Neural Networks 14(4/5):
471–493. https://doi.org/10.1016/S0893-6080(01)00028-4
Vidal, R.; Salmeron, J.; Mena, A.; Chulvi, V. 2015. Fuzzy cognitive map-based selection of TRIZ trends for eco-innovation of ceramic industry products, Journal of Cleaner Production 107: 202–214.
https://doi.org/10.1016/j.jclepro.2015.04.131
Wellman, M. 1994. Inference in cognitive maps, Mathematics and Computers in Simulation 34(2):
Zavadskas, E.; Turskis, Z. 2011. Multiple criteria decision making (MCDM) methods in economics: an overview, Technological and Economic Development of Economy 17(2): 397–427.
https://doi.org/10.3846/20294913.2011.593291
Zavadskas, E.; Turskis, Z.; Kildienė, S. 2014. State of art surveys of overviews on MCDM/MADM methods, Technological and Economic Development of Economy 20(1): 165–179.
![Fig. 1. Example of a cognitive map [partial view]](https://thumb-eu.123doks.com/thumbv2/123dok_br/19196780.952145/7.714.127.584.100.386/fig-example-of-a-cognitive-map-partial-view.webp)