XXX-X-XXXX-XXXX-X/XX/$XX.00 ©20XX IEEE
Continuous Reinforcement Operator applied to
Resilience in Disaster Rescue Networks
Javad J. Jassbi, Rita A.Ribeiro, Luis M.
Camarinha-Matos, José Barata
Uninova CTS and
FCT-NOVA University of Lisbon, Portugal {j.jassi, rar, cam, jab}@uninova.pt
Maria Isabel Gomes
Centro de Matemática e Aplicações, CMA FCT-Universidade Nova Lisbon, Portugal
Abstract— Resilience measurement can be viewed as a multicriteria hierarchical decision making problem since calculating the final level of resilience involves measuring different criteria, at several hierarchical levels, and then merging the information together. In this paper, a resilience model for disaster rescue networks is discussed with a full-reinforcement operator, denoted continuous full-reinforcement operator. This approach is tested with different levels of reinforcement and the results are compared with those from a Fuzzy Inference System. The proposed approach offers interesting features to support balanced development of disaster rescue networks and facilitates managerial decisions by imposing standards for criteria to penalize or reward the information fusion process.
Keywords — Resilience, Full-Reinforcement Aggregation Operators, Averaging Aggregation Operator, Disaster Rescue Network, Multiple Criteria Decision Making.
I. INTRODUCTION
It is believed that resilience is a succeeding paradigm to risk management. The aim of resilient systems surpasses reducing risks by enabling building systems to return to a nominal situation after being impacted. Particularly, such systems are quite useful for Disaster Rescue Networks (DRNs) which need to react while affected by disasters [1]. Disaster management is a complex and dynamic process which deals with a multiplicity of functions and actors where individuals, groups and organizations have to confront a situation as a collaborative team [2]. This raises the need for a multi criteria evaluation model for performance assessment. Although there are some frameworks to measure and calculate the resilience of a system [3] [6], two important challenges have to be taken in consideration: the list of criteria should reflect the specific characteristics of the system; and the information fusion model to determine the action´s ranking has to be flexible and reliable.
In this work, the focus is on the second challenge which has been less addressed in the literature. We borrowed an existing conceptual model [3] and employed an continous
reinforcement operator (CRO) to evaluate and rank the resilience level of disaster rescue networks. There are many classical aggregation operators, i.e. operators without reinforcement capabilities, of which probably the most common one is the "weighted average" [4]. However, by using a simple weighted average, the value of information does not consider standard deviation and balanced scores are not affecting the final value of the weighted average aggregation model. Furthermore, regardless of the minimum acceptable standard, the results are always the same. Since resilience is crucial for survivability of the system, while equilibrium, adaptability and stability are key factors [5], the chosen aggregation operator should satisfy all above issues such as equilibrium and penalize unbalanced DRN (chosing appropriate operators is discussed in [7]).
The class of full-reinforcement aggregation operators [7] [8] seems quite appropriate for dealing with the aforementioned problems and it has been successfully applied in other multicriteria decision processes [9, 10, 11]. In this work we introduce and test an improved version of a product FIMICA reinforcement operator [11] [13], denoted CRO (Continuous Reinforcement Operator) to assess its suitability for ranking Resilience in Disaster Rescue Networks.
Multicriteria decision making (MCDM) approaches can be applied in risk and resilience models to structure and aggregate all information measured by different criteria. In general, MCDM problems include two or more alternatives and "n" criteria to evaluate each alternative (or rather a preference for each alternative). The goal is to combine the scores obtained for each alternative per criteria, xij , using some aggregation operation "f", and then chose the highest rate as the “best alternative”. When addressing hierarchical MCDM, as in our work, there are other aggregations to be performed, one per layer of the hirarchical layer, until the final goal is obtained.
In summary, the main objective of this work is to assess the adaptability and stability of using a full reinforcement operator - specifically a Continuous Reinforcement Operator (CRO) - in the resilience domain, formalized as a
hierarchical MCDM problem. Furthermore, to assess CRO effectiveness, different levels of reinforcement are tested and, finally, all results are compared with a previous approach using a Fuzzy Inference System [3].
The paper is organized as follows: in next section the related literature, both for resilience models and aggregation operators, is reviewed and the continuous reinforcement operator is introduced; Section III deals with the conceptual model which is used in this work and in Section IV a case study borrowed from previous works is employed to evaluate proposed strategy. In Section V, the result from the previous section and a comparison of different strategies will be discussed. Finally, Section VI presents the conclusions and future direction of the work.
II. BACKGROUND
A. Resilience Models
Rescue networks are recommended as a form of Collaborative Networks for better performance in terms of resilience [2]. Collaborative resilience frameworks usually consider both the conceptual model, including the criteria and their relation, and the aggregation model to measure and merge all involved information. Successful frameworks should include both qualitative and quantitative methods. This is corroborated by some facts and evidence from previous research: traditional leadership structures are not appropriate for disaster rescue teams [12], Collaborative Networks are recommended as an effective approach to adopt in crisis situations, as well as the fact that Emergency Management networks involve a combination of formal and informal groups with relationships [2].
A resilient systems approach is more than risk management since it aims to prepare disaster rescue networks (DRN) for unpredictable situations, what should be part of any systematic plan for catastrophe management [14]. Further, resilience is of paramount importance for survivability of systems, when facing unpredictable situations.
The focus of resilience is adaptability and stability, which are crucial factors for the survival of any system [15]. However, different understandings of the concept are usual, depending on the application area (e.g. Psychology, Supply
Chain Management, Medical Management, Safety
Engineering, and so on) [6] [16][17][18].
It is important to distinguish between similar characteristic of rescue systems, such as flexibility, agility, and robustness with resilience, as they are sometimes used interchangeably [19]. In this work the following definition is adopted: "Resilience can be understood as the ability of a system to reduce the chances of a shock, to absorb a shock if it occurs (abrupt reduction of performance) and to recover quickly after a shock (re-establishing nominal performance)" [20].
To assess resilience in DRNs, important factors should be taken in consideration:
• Resilience is important at both individual and collective levels [21].
• Resilience is a learning process and thus access to past knowledge is crucial [22].
• There is no limit to improve networks’ resilience and past experience of events is one criteria by itself [23]. • Resilience is a capability of the system for adaptation
and to achieve higher levels of efficiency [24]. • Resilience could be used at both Macro and Micro
levels [12].
• Resilience for DRNs is difficult to estimate using post event models due to specific singularities of disasters [5] [25].
• Resilience, like most managerial concepts, deals with a variety of affecting variables in presence of dynamism and imprecise data [26].
All these issues increase the complexity of the problem and as such creating a comprehensive framework with an appropriate quantitative model is very difficult. That is why most of the evaluation models in literature are qualitative. Even the few proposed quantitative models usually only use simple aggregation operators, such as average or weighted average aggregation. There are also some papers using fuzzy logic or statistical approaches but mostly, again, ignore the synergy and redundancy of criteria [5] [26] [27].
B. Reinforcement aggregation operators for MCDM Aggregation operators generally take real input arguments from the closed interval [0,1] and produce an output rating also in [0,1]. This is usually denoted as
𝑓: 0,1!→ [0, 1] (1)
for operators that take arguments with "n" components. The most well known aggregation operators are the arithmetic or geometric means, and the min and max operators from multi-valued logic [7] [9]. There are several families of operators ranging from averaging operators, conjunctive, disjunctive, mixed and the recent family of reinforcement operators [8] [10] [13] – the latter being the focus on this work. Further, there are two main classes of aggregation operators with full-reinforcement behaviour, Uninorm and Fimica [8] [9] [10]. The main difference between Fimica and Uninorm operators is that the former are continuous [10] [13]. CROP operator belongs to the class of FIMICA operators and is an improved version from previsous work [11] [13].
The concept of full reinforcement refers to the capability of defining operators that, given a set of high scores, their aggregation will display an upward reinforced behaviour – e.g. higher than the average - and conversely, for lower values, a downward reinforcement behaviour will be displayed. Further, when defining an full-reinforcement continuous operator, such as CRO, there are three important requirements to consider: a) for a set of high scores to “positively” reinforce each other, it must obtain an aggregated higher score than any of the elements alone (upward reinforcement); b) for a set of low scores to “negatively” reinforce each other it must obtain a lower score than any of the elements (downward reinforcement); c)
it must ensure monotonicity and continuity to avoid discontinuities on aggregated results.
Full reinforcement operators can be very useful in risky situations where we want to reward solutions where all criteria have high satisfaction values and discard solutions that include criteria with very low satisfaction levels (see an interesting example in [11]). In [9] a good example is mentioned for medical diagnosis, where one will feel more confident if all symptoms of a disease are clearly present and, for example, the lack of any symptom will increase the confidence of the patient not having the disease.
As mentioned before, in this work we evaluate the suitability of a full-reinforcement continuous operator CRO – Continuous Reinforcement Operator for resilience in disaster rescue networks. CRO is an improved version of a previous reinforcement operator, denoted product FIMICA [11] and its formulation is:
𝐶𝑅𝑂 𝑥 =
!!!!!! !!!!(2)
where g ∈ ]0, 1] is the parameter controlling the reinforcement level (upward or downward) and xi > 0 for all criteria.
An illustration of the CRO behaviour for 2 variables and 2 control parameters is displayed in Fig. 1. The two variables (input a and input b) vary between 0 and 1; the score, vertical axis, represents their agregated values using CRO.
Fig. 1 CRO behavior with g=0.2 and g=0.8
As it can be observed, if we use the threshold g=0.2 (high upward reinforcement) most solutions are acceptable (non-risky situation), while if we use g=0.8 (high downward reinforcement) only solutions with very good satisfaction levels in the inputs (a and b axis)will be acceptable.
An illustrative example with 3 criteria and 5 alternatives is shown in Table I. For the sake of space only two reinforcement levels are discussed, g=0.2 and g=0.8. It is easy to verify that if g=0.8 all alternative scores are lower than the average. If a low value "g" (g=0.2) is used, most solutions are considered good and present CRO scores much higher than the simple average. Another interesting result is how much using a high reinforcement for "g" really discriminates alternatives with low values from criteria with high values. For instance, when g=0.8 all alternatives with criteria values below 0.7 display a result with a high downward reinforcement (e.g. A2 score is 0.168) and only when criteria have values higher or equal to 0.9 they will be reinforced positively, i.e. higher than the average (score =
0.991). When g=0.2 all solutions are higher than average with a big upward reinforcement for criteria values higher than 0.4. This example clearly illustrates the CRO “power” of penalizing or rewarding alternatives with low or high criteria values.
TABLE I.ILLUSTRATIVE EXAMPLE OF CRO X1 X2 X3 g= 0.2 CRO g= 0.8 CRO Average A1 0.2 0.2 0.2 0.504 0.023 0.2 A2 0.4 0.4 0.4 0.832 0.168 0.4 A4 0.8 0.8 0.8 0.979 0.756 0.8 A5 0.99 0.99 0.99 0.999 0.991 0.99
Since this work’s objective is the application of reinforcement operators in a Resilience case study, we will not discuss more the details of FIMICA- base operator for CRO, but interested readers can find more details in [11] .
III. CONCEPTUAL MODEL FOR RESILIENCE EVALUATION
STRATEGIES
A. Resilience Hierarchical Model
The main objective of this work is to improve the evaluation of resilience quantitative models, particularly the one proposed in [3]. There are several conceptual models in the literature applying different methods, which could be used for measuring the resilience of DRNs [25] [21]. In this paper we adopt the conceptual model from [3] as shown in Figure 2.
Fig. 2 Resilience Model adopted from [3]
As it can be observed, this model has two hierarchical layers (Figure 2). The first layer demonstrates Resilience of a system with three criteria, called Cognitive Resilience (CgR), Behavioral Resilience (BR) and Contextual Resilience (CtR). The second layer includes measurable variables to represent those three main resilience criteria. Cognitive Resilience represents the organizational perspective and it can be broken-down in two sub-criteria, Organizational Identity (OI) and Sense-Making (SM). Behavioral Resilience describes institutionalized behaviors to empower the system for learning and facing uncertain, non-predictive and destructive situations. It includes four sub-criteria: Resource Fullness (RF), Preparedness (P), Counter Intuitive (CI) and Useful Habits (UH). Contextual Resilience represents the collective reaction of the system which comprises three sub-criteria: Difference to Expertise (DE), Deep Social Capital (DC), and Broad Resource
Network (BR). More details about each sub-criteria are described in [3].
There are several reasons to select this conceptual model [5][21][22][14][30]:
• It is accepted and widely used by researchers and experts in the field.
• The criteria and sub criteria are well defined (in terms of measurability), which is not the case for many other models.
• It uses Micro and Macro levels and can be applied for Resilience in Collaborative Networks.
• It is a comprehensive model when both results and enablers are taken into account.
• The model’s hierarchical structure provides flexibility to evaluate different strategies for aggregation.
Finally, this conceptual model (Fig. 2) can be considered as a multi-criteria hierarchical decision-making problem and thus MCDM approaches and reinforcement operators could be effective to improve the obtained results.
IV. RESILIENCE MODEL EVALUATION
In this section, the real case study presented [3] is adapted to assess the usage of reinforcement operators for resilience systems. Table II depicts the information for the nine criteria (Fig. 2) for five alternative DRNs to be evaluated. The last alternative, DRN Red C, depicts values obtained from real questionnaires, as explained in [3].
TABLE II.INITIAL DATA FOR NINE CRITERIA (adapted from [3])
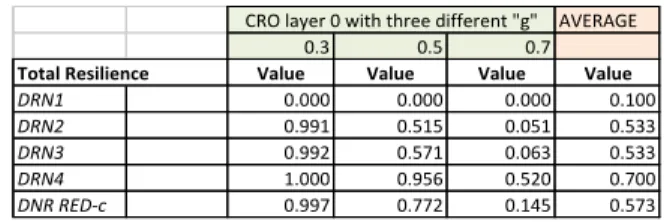
Now, to evaluate CRO we first tested its usage with three different values for "g" (penalizing or rewarding parameter), applied directly to the values in Table II, i.e. without considering the hierarchical structure of the model discussed (Fig. 2). The results obtained are shown in Table III.
TABLE III.RESILIENCE OF DRNS USING "CRO" WITH THREE
"g" AND THE RESULTS WITH CLASSICAL AVERAGE
Second, we tested the same three “g” reinforcement parameters with CRO but now applying them to the hierarchical MCDM model of Fig. 2. Table IV shows the results for each sub-criteria layer 1 and also the final aggregation (layer 0) which represent the same aggregation as the results of Table III. It is easy to observe how different the final results are when comparing the single layer MCDM approach (results in Table III) with the hierarchical MCDM model (results in Table IV). It is particularly noticeable the difference on the final results, when the reinforcement parameter (g) is high (e.g. g = 7). This shows how useful it can be to apply a hierarchical MCDM approach combined with a reinforcement aggregation, using the reinforcement parameter for assessing the adaptability – i.e. allows performing sensitivity analysis - of the resilience system.
Finally, Table V summarizes all tested results with CRO plus the results obtained by using a totally different approach i.e. Fuzzy Inference System for the mentioned case study [3].
V. DISCUSSION
Observing Table V we see that all approaches, from FIS (Fuzzy Inference System), MCDM with CRO and simple Average, provide the same order ranking for the two best alternatives DRN4>DRN Red-C and for the worst one DRN1. However, there are slight differences for DRN3 and DRN2, since FIS and Sub-CRO3 consider DRN3>DRN2 and the others consider DRN2>DRN3. These results show that the ranking order results are relatively similar. However, when performing a more detailed analysis by testing different levels of reinforcement one sees many other differences, which might provide better managerial insights.
OI SM RF PP CM UH DE DS BR DRN1 0.1 0.1 0.1 0.1 0.1 0.1 0.1 0.1 0.1 DRN2 0.4 0.8 0.8 0.4 0.4 0.3 0.4 0.6 0.7 DRN3 0.3 0.5 0.6 0.5 0.8 0.6 0.6 0.4 0.5 DRN 4 0.7 0.7 0.7 0.7 0.7 0.7 0.7 0.7 0.7 DRN Red-C 0.62 0.6 0.63 0.5 0.56 0.53 0.58 0.55 0.59
Cognitive Resilience (Cog.R) Behavioral Resilience (Beh.R) Contextual Resilience (Com.R)
Table with global results with 3 different g and comparison with simple average AVERAGE
0.3 0.5 0.7
Total Resilience Value Value Value Value
DRN1 0.000 0.000 0.000 0.100 DRN2 0.991 0.515 0.051 0.533 DRN3 0.992 0.571 0.063 0.533 DRN4 1.000 0.956 0.520 0.700 DNR RED-c 0.997 0.772 0.145 0.573 CRO layer 0 with three different "g"
TABLE IV.RESILIENCE USING "CRO" IN THE HIERARCHICAL MODEL, WITH THREE LEVELS FOR "g" AND SIMPLE AVERAGE
Sub Resilience Cog.R Beh.R Con.R Cog.R Beh.R Con.R Cog.R Beh.R Con.R Cog.R Beh.R Con.R
DRN1 0.109 0.012 0.037 0.048 0.002 0.009 0.030 0.001 0.004 0.100 0.100 0.100 DRN2 0.851 0.832 0.885 0.702 0.404 0.645 0.589 0.171 0.442 0.600 0.475 0.567 DRN3 0.681 0.954 0.838 0.469 0.741 0.551 0.349 0.465 0.348 0.400 0.625 0.500 DRN4 0.921 0.975 0.952 0.828 0.843 0.825 0.745 0.620 0.672 0.700 0.700 0.700 DNR RED-c 0.878 0.928 0.898 0.748 0.637 0.676 0.643 0.348 0.476 0.610 0.555 0.573 DRN1 DRN2 DRN3 DRN4 0.979 0.681 0.190 0.508 0.996 0.700 0.000 0.000 0.985 0.668 0.154 0.924 0.638 0.547 sub CRO 1 layer 1 with g=0.3 sub CRO2 layer 1 with g=0.5 sub CRO3 layer 1 with g=0.7 sub Average
Total Resilience sub CRO 1 Total Resilience sub CRO2 Total Resilience sub CRO3 Total Resil. sub Average 0.100
In general, the results clearly show that by using CRO and tuning the penalizing/rewarding parameter, "g", decision-makers can control the desired level of resilience, according to desirable objectives. For instance, in Table III the resilience result for DRN RED-c varies from 0.99702 (g=0.3) to 0.1452 (g=0.7)! Clearly by having a low penalizing factor "g" (upward reinforcement) the disaster rescue networks ratings become almost undistinguishable (respectively: 0.991, 0.990, 1, 0.997); however, when decision-makers are more demanding and use a higher penalizing parameter (downward reinforcement) their ratings drop dramatically (e.g. DRN3 drops to 0.5 and 0.048 respectively)! Therefore, by using higher downward reinforcement, only alternatives with good satisfaction levels will be acceptable and this could help to set standards, according to the minimum level that decision-makers find acceptable. In addition, by using the hierarchical model, managers can even refine their objectives by setting different acceptable thresholds for different groups of criteria or sub-criteria - in our case we used the same reinforcement levels but different ones can be used.
Another interesting aspect is observable by comparing the results obtained for the hierarchical model (sub-criteria) using CRO and simple average. Looking DRN4, at Table IV, the average result is 0.7 (all criteria values are 0.7 – Table II) but they are rather distinct with CRO, either if we set a reinforcement parameter of g=0.5 (result 0.9242) or g=0.3 (result 0.6378). It is clear the discriminatory power of using a full reinforcement operator, like CRO, being quite beneficial to support decision makers to take more informed decisions.
Now we will compare the results obtained from the hierarchical model with CRO and those from the Fuzzy Inference System [3], presented in Table V. For instance, DRN RED-C (with g=0.3) has similar values to the ones obtained with FIS, but if we do not need to set the parameter so low (g=0.3); DRN4 and DRN RED-C have similar classification, respectively 0.9956 and 0.9904, while there is a huge difference using FIS (0.7588 and 0.3792, respectively). It is clear that the FIS approach, when compared with the MCDM with CRO approach, displays a
rigid behavior and does not allow setting
thresholds/standards, i.e. the rules values would have to be changed to obtain different classifications. This will help decision makers to customize the model based on their standard and level of satisfaction according to the situation and type of the network.
VI. CONCLUSIONS AND FUTURE WORK
Resilience is a hot topic in many areas including collaborative networks while the challenge of measuring and quantifying the level of resilience is still an open question. Due to their nature, it is crucial for Disaster Rescue Networks to improve their capabilities so as to increasing
their performance when facing abnormal situations and proving to be a resilient system. Most works in this area focused only on conceptual models while this work deals with aggregation of criteria using reinforcement aggregation operators to compare different strategies for resilience measurement. Borrowing a conceptual model and case study, from a previous work, and employing a novel full-reinforcement aggregation operator, CRO (Continuous Reinforcement Operator), the objective was to analyze the power of being able to penalize unbalanced networks and to reward balanced ones, thus ensuring sustainable development for improving the resilience indexes in Disaster Rescue Networks (DRN).
We performed a comparative analysis with a Fuzzy Inference System – borrowed case study [3] - and a simple average and the obtained results highlighted the ability of CRO to penalize or reward criteria values, thus providing a good opportunity for customization, according to the standards or targets of decision-makers. In summary, by imposing different levels for parameter "g" (upward or downward reinforcement) in CRO, enables setting standards or minimum levels of expectation from managers’ perspectives.
For future work, we plan to compare CRO with other full-reinforcement operators and also apply the proposed approach to other case studies of resilience measurement and collaborative networks. Further, finding a method to calculate the “optimal g" in CRO could help to achieve a better result according to decision makers standards. And, finally, evaluating different strategies of Resilience improvement by simulating the impacts to find the optimal solution of resource allocation for each criterion would be part of the future work.
ACKNOWLEDGMENTS
This work was partially funded by FCT Strategic Program UID/EEA/00066/203, project PEST of UNINOVA and also by the Fundação para a Ciência e a Tecnologia (Portuguese Foundation for Science and Technology) through theproject UID/MAT/00297/2013 (Centro de Matemática e Aplicações).
REFERENCES
[1] Yondong, Z.: Social networks and reduction of risk in disasters: An example of Wenchuan earthquake: Economic Stress, Human Capital, and Families in Asia. In: Yeung W.J.J., Yap M. T. Vol.4, pp.171-182. Springer (2013)
[2] Camarinha-Matos, L. M.; Afsarmanesh, H.; Boucher, X.: The Role of Collaborative Networks in Sustainability. Collaborative Networks for a Sustainable World, IFIP AICT Series 336/2010, Springer, pp. 1-16. (2014)
[3] Jassbi, J, Camarinha-Matos, L, Barata, J, A Framework for Evaluation of Resilience of Disaster Rescue Networks. Risks and
TABLE V.RESULTS COMPARISON TABLE OF MCDM APPROACH AND FIS[3] APPROACH
Comparison Table CRO 1 CRO 2 CRO 3 sub CRO1 sub CRO2 sub CRO3 Average Sub Average FIS Result
DRN1 0.000 0.000 0.000 0.002 0.000 0.000 0.100 0.100 0.091
DRN2 0.991 0.515 0.051 0.985 0.668 0.154 0.533 0.547 0.263
DRN3 0.992 0.571 0.063 0.979 0.681 0.190 0.533 0.508 0.378
DRN4 1.000 0.956 0.520 0.996 0.924 0.638 0.700 0.700 0.759
Resilience of Collaborative Networks, IFIP AICT series 463/2015,
Springer, pp.146-158 (2015)
[4] S. Khanmohammadi, R. Ribeiro, and J. Jassbi, “Multi criteria decision making using dynamics of criteria,” 2003. Proceedings of the 11th Mediterranean Conference on Control and Automation (MED03), June 2003, #T3-013. URL: http://med.ee.nd.edu/MED11/pdf/papers/t3-013.pdf
[5] Arsovski, S.; Andre, P.; Ðordevic, M.; Aleksic, A.: Resilience of Automotive Sector: A Case Study. In: Proc.s of 4th International Quality Conference, Kragujevac, Serbia, May 2010 pp 89 – 104 (2010) http://www.cqm.rs/2010/3.html
[6] Bhamra, R.; Dani, S.; Burnard, K..: Resilience: the concept, a literature review and future directions. International Journal of Production Research, 49, 18, 5375 – 5393 (2011)
[7] Beliakov, G., Warren, J.: Appropriate choice of aggregation operators in fuzzy decision support systems. IEEE Transactions on Fuzzy Systems 9(6), 773–784 (2001)
[8] Yager, R.R., Rybalov, A.: Full Reinforcement Operators in Aggregation Techniques. IEEE Systems, Man and Cybernetics, Part B 28(6) (1998)
[9] Calvo, T., Mayor, G., Mesiar, R. (eds.): Aggregation Operators: New Trends and Applications. Studies in Fuzziness and Soft Computing, vol. 97. Physica-Verlag, Heidelberg (2002)
[10] G. Beliakov, A. Pradera, T. Calvo Aggregation functions: A Guide for Practicioners, Springer (2007)
[11] Ribeiro, R.A., Pais, T.C., Simões, L.F.: Benefits of Full-Reinforcement Operators for Spacecraft Target Landing. In: Greco, S., Pereira, R.A.M., Squillante, M., Yager, R.R., Kacprzyk, J. (eds.) Preferences and Decisions. STUDFUZZ, vol. 257, pp. 353–367. Springer, Heidelberg (2010)
[12] Boin, A.; McConnell, A.: Preparing for Critical Infrastructure Breakdowns: The Limits of Crisis Management and the Need for Resilience. Journal of Contingencies and Crisis Management 15, pp 50-59 (2007)
[13] R. A. Ribeiro, T. C. Pais. ‘Reinforcement Operators in Spacecraft Landing’. In: proceedings of the 5th workshop on Preferences and Decisions, Trento, Italy 6-8 April, 2009. URL:
http://events.unitn.it/en/trento2009/proceedings
[14] Park, J.; Seager, T. P.; Rao, P. S.; Convertino M, Linkov I.: Integrating Risk and Resilience Approaches to Catastrophe Management in Engineering Systems. Risk Analysis, 33(3), pp 356 – 376 ( 2013)
[15] Noran, O.: Collaborative Disaster Management: An Interdisciplinary approach, Journal of Computer in Industry, 65(6), pp1032-1040 (2014)
[16] Brown, K.: Global environmental change I: A social turn for resilience? Progress in Human Geography, 38, pp 107 – 117 (2014) [17] Folke, C.; Hahn, T.; Olsson, P.; Norberg, J.: Adaptive governance of
social-ecological systems. Annual Review of Environment and Resources, 30, pp 441-473 (2005)
[18] Ponis, S.; Koronis, E.: Supply Chain Resilience: Definition of Concept and its Formative Elements. The Journal of Applied Business Research, 28(5), pp 921 – 930 (2012)
[19] Christopher, M.; Peck, H.: Building the resilient supply chain. International Journal of Logistics Management, 15(2), pp 1-13 (2004) [20] Francis, R.; Bekera, B.: A metric and frameworks for resilience
analysis of engineered and infrastructure systems. Reliability Engineering and System Safety, 121, pp 90–103 (2014)
[21] Lengnick-Hall, C. A.; Beck, T. E.; Lengnick-Hall, M. L.: Developing a capacity for organizational resilience through strategic human resource management. Human Resource Management Review, 21, pp 243–255 (2011)
[22] Lengnick-Hall, C. A.; Beck, T. E.: Adaptive Fit Versus Robust Transformation: How Organizations Respond to Environmental Change. Journal of Management, 31(5), pp 538 – 575 (2005) [23] Vogus, T.J.; Sutcliffe, K.M.: Organizational Resilience: Towards a
Theory and Research Agenda. IEEE International Conference on Systems, Man and Cybernetics, 2-7 Oct 2007, Montreal, Canada, pp 3418 – 3422 (2007)
[24] Akgün, A. E.; Keskin, H.: Organisational resilience capacity and firm product innovativeness and performance. International Journal of Production Research 52(23), pp 6918 – 6937 (2014)
[25] Rose, A.: Economic resilience to natural and man-made disasters: Multidisciplinary origins and contextual dimensions. Environmental Hazards, 7(4), pp 383 – 398 (2007)
[26] Aleksić, A.; Stefanović, M.; Arsovski, S.; Tadić, D.: An assessment of organizational resilience potential in SMEs of the process industry, a fuzzy approach. Journal of Loss Prevention in the Process Industries, 26(6), pp 1238-1245 (2013)
[27] Azadeh, A.; Salehi, V.; Arvan, M.; Dolatkhah, M.: Assessment of resilience engineering factors in high-risk environments by fuzzy cognitive maps: A petrochemical plant. Safety Science, 68, 99– 107(2014)
![Fig. 2 Resilience Model adopted from [3]](https://thumb-eu.123doks.com/thumbv2/123dok_br/19207862.956900/3.918.87.446.604.744/fig-resilience-model-adopted.webp)