HOLOS, Ano 30, Vol. 6 16
APPROACH TO THE ECONOMIC VALUE GENERATED IN THE NATURAL PARKS OF
CORDOBA (SPAIN)
A. HIDALGO-FERNÁNDEZ*, R. E. HIDALGO-FERNÁNDEZ, J. A. C. MADUEÑO and M. ARRIAZA Universidad de Córdoba
Article received March/2014 and accepted in December/2014 DOI: 10.15628/holos.2014.2061
ABSTRACT
The economic valuation of the protected natural parks contributes to a holistic approach of the economy, from the market to the ecological and social perspective, aiming at a sustainable management of the natural heritage as well as reducing its deterioration. It also provides valuable information to policy makers for the
protection and conservation of the natural environment. To estimate the recreational use value of the natural parks we applied a revealed preference method and a declared preference method. The results are consistent with previous studies on these types of protected areas.
KEYWORDS: Natural parks, contingent valuation method, sustainability
ABORDAGEM AO VALOR ECONÔMICO GERADO NOS PARQUES NATURAIS DE
CÓRDOBA (ESPANHA)
RESUMO
A valoração econômica dos parques naturais protegidas contribui para uma abordagem holística da economia, do mercado à perspectiva ecológica e social, visando uma gestão sustentável do património natural, bem como reduzir a sua deterioração. Ele também fornece informações valiosas para os formuladores de políticas
para a proteção e conservação do meio ambiente natural. Para estimar o valor de uso recreativo dos parques naturais foi aplicado um método de preferência revelado e um método de preferência declarado. Os resultados são consistentes com estudos anteriores sobre estes tipos de áreas protegidas.
HOLOS, Ano 30, Vol. 6 17
1 INTRODUCTION
The parks generate goods and services that meet the needs of citizens, but in its management ever present lack of a market where exchanged and the public goods characteristics of non-rivalry and non-exclusion, which enables the allocation of a value.
In recent years, progress and environmental economics methodological contrasts allow us to establish a monetary value for assets that have no market. The basic elements of economic valuation are the productive, environmental and recreational use through the preferences of individuals and, as a result of the satisfaction derived from consumption and / or natural heritage conservation.
Inevitably find the economic value of natural heritage for several reasons. First, to satisfy the demand for justification of public expenditure on the conservation of natural heritage over other social needs such as health, education, etc., Second, to enable agencies acting in the defence of nature to know the true value of the natural heritage which they defend. Third, to provide the courts with information on which to calculate compensation for damage caused to the environment. Forth, to permit us to exploit the economic capacity of natural resources on a sustainable basis.
Different governments have sought to conserve the natural heritage by protecting the resource-rich areas. These conservation measures have identifiable and measurable costs compared to profit only quantifiable. From this perspective, the Administration is increasingly of the opinion and preferences of citizens and its economic valuation is used for cost-benefit analysis by public policies. Thus Barberán et al. (2002) argue that economic valuation of natural areas be considered as a tool for decision-making by public authorities relating to the conservation.
Traditionally, economists have defined the value of goods as the monetary value based on individual consumer preferences. Therefore, for a single well there exists various values depending on the individual differences of perception (Porras, 2003).
To determine the value of a natural, according to (Pearce and Turner, 1995), there are three approaches: a) value expressed by individual preferences, b) public preference value expression in social norms and c) physical functional value ecosystem. The set of benefits provided by natural assets to society represents the total economic value and are related to the use, directly or indirectly of it. This concept assumes that the sum of values of different types make up the total value of the resource (Jäger et al., 2001).
Following another approach (Boyle and Bishop, 1985) distinguishes four types of values for natural goods. First, those whose use involves a consumer, for example, hunting. Second, those whose use involves no consumption, such as the satisfaction of observing a landscape. Third, those who provide services through an indirect use, such as viewing a television program of a national park. And finally, the satisfaction of knowing that there is natural habitat or that particular animal species are living in a given habitat without direct or indirect contact.
HOLOS, Ano 30, Vol. 6 18
There is no consensus on the components of the formula that reflects the total economic value. Supported by the work of (Pearce and Turner, 1995; 1997; Porras, 2003) we can define the total economic value of a natural as the sum of a set of values: use values and non-use values:
Disaggregating the use values we have:
Direct use values: direct use of the property itself. They are represented by the products generated by ecosystems and the recreational use value of a natural area.
Indirect use values: enjoyment of the resource by another. They attributed by the value of environmental functions that support economic activity.
Option value: the value given by potential future use of natural good by the individual. This represents the value of the environment as a potential use against the use value itself. Option values are a subset of the use-values, in this case, for future use.
Just as we can distinguish non use values:
Existence value: represents the extent of the value derived from the very existence of the natural good, even if the citizen does not ever plan to visit it.
Bequest value: represents the willingness to pay so that future generations can make use of these resources or not.
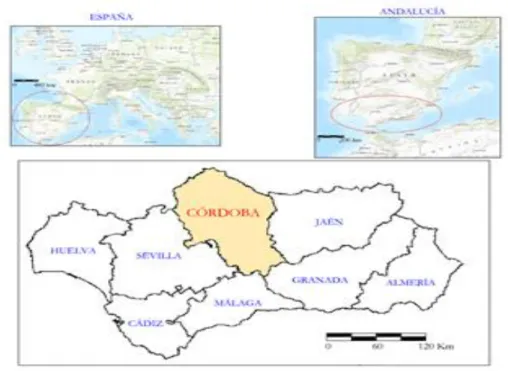
The aim of this paper is to focus on the total economic value (TEV) of goods and functions that are provided by three natural parks of Córdoba (Spain) (Figure 1). To estimate the recreational use value using the maximum willingness to pay a maximum input and willingness to donate for the conservation of the same, for which no data are available currently. These parks are used as a place of fun and entertainment by the public.
Figure 1- Location map of the province of Córdoba (Spain). Source: Authors. Ministry of Environment.
The Natural Park (NP) de Cardeña y Montoro is located in the northeastern part of the province of Córdoba, and occupies an area of 38,499 ha. The Hornachuelos NP is located west of
HOLOS, Ano 30, Vol. 6 19
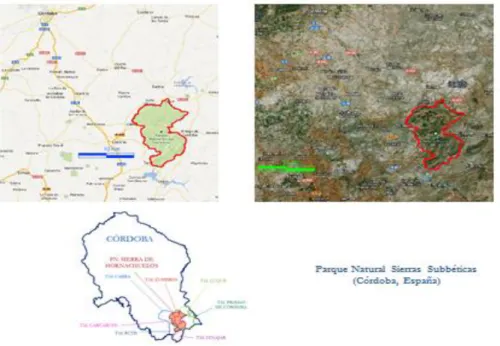
the province of Córdoba, and occupies 60,032 ha., and Sierras Subbéticas NP is located SE of the province of Córdoba, and covers 32,056 ha. (Figures 2, 3, 4. Plans Cardeña y Montoro, Hornachuelos and Sierras Subbéticas).
Figure 2- Plans Natural Park Cardeña y Montoro. Source: Authors. Ministry of Environment.
Figure 3 -Plans Natural Park Hornachuelos. Source: Authors. Ministry of Environment.
HOLOS, Ano 30, Vol. 6 20 Figure 4 -Plans Natural Park Sierras Subbéticas.
Source: Authors. Ministry of Environment.
2 MATERIAL AND METHODS
The estimate of TEV is calculated with current use values. The ecological value is determined from a productive value of natural resources from a sustainable basis, using a geographic information system (GIS) with base management system data and geographic representation that describes the environmental attributes and recreational use value using the Contingent Valuation Method and the Travel Cost Method. Indirect use values have been deducted from the value as a sink and CO2reserve three parks. And finally, the MVC future use
values - existence and bequest, are obtained.
The farms in the parks are primarily private estates and therefore we have reliable information for public use derived from the licensing system of the Ministry of Environment in Delegation of Córdoba as it is authorized to regulate the use by granting permits.
2.1 Current use value
2.1.1 Productive value
The developments that can be extracted from the ecosystem are:
Achievement hunting: Hunting income is obtained by considering the surface area used
for hunting, whether public or private, divided into hunting grounds. The Ministry of Environment of the Junta de Andalucía has provided data on annual catches by species of big game. Data on small game in those parks is not available as this type of hunting is not regulated. Every four years the public authority tenders hunting licences for which privately owned reserves are required to pay a fee to the Administration for permission to hunt. To get the value of hunting use we have consulted valuing hunting pieces of Andalucía (Junta de Andalucía, Department of
HOLOS, Ano 30, Vol. 6 21
the Environment. BOJA Nº.158 of August 10, 2007, 232/2007 Hunting Andalucía Plan amending the Regulations on Hunting approved by Decree 182/2005, of July 26.
Exploitation of pastures: To get the value of pasture we have considered the number of
cattle grazing and which stay in the bush and, according to Morrison (1966) and the work of Castillo et al. (2008), the estimated average consumption per animal of 2 kg of grass a day. This value is divided by three to equate to kilograms of barley in order to have approximately the same energy value. The market price of rice to Córdoba stood, at approximately 0.24 € / kg in 2009.
Use for beekeeping: The main advantage is of this use is the production of honey, but
other products like wax, propolis, royal jelly or pollen are also produced. The normal average yield per hive is between 20-25 kg of honey per year. For the 2009 campaign, a kilo of honey sold in the local market at 2.20 €. We have factored on an average of 20 kilos of honey per hive to always use the most conservative values.
Use of Cork: We have considered extracted cork kilos, according to data from the Ministry
of Environment of the Junta de Andalucía, for a quintal (46 kg) according to official statistics of the Ministry of Agriculture, Food and Environment (MAGRAMA).
Agricultural Utilization: Obtain the average yield of a hectare of land. 2.1.2 Environmental or ecological value
In the GIS platform we have integrated an inventory of the natural elements that make up the natural heritage of the three parks for the entire geo-referenced environmental information and allow thematic use together or separately, to make decisions or for any parameter estimation models created for this purpose.
To calculate the carbon content of trees, information available from the latest work produced in 2007 by the Ministry of Environment of the Junta de Andalucía has been used. In this work the value as a sink and CO2 reserve was obtained from indirect uses of forests within the environmental role it plays. According to the information in this work a weight for the parks.
2.1.3 Recreational Value
To determine the value of recreational propose a methodology using a Contingent Valuation Method based on the performance of a simulated hypothetical market survey to estimate the value that people attach to a particular environmental good directly and a Travel Cost Method based on conventional markets (prices) to estimate the social value of an area of recreational interest. Both methods require a type of information which can only be collected by interviewing visitors to the parks and obtaining personal data from them.
2.2 Future use value
We have chosen the Contingent Valuation Method because it is the only valid method of estimating non-use values such as the existence value, as opposed to Choice Experiments which study the lifestyle of the visitors, whose preferences are defined by the geographic location of parks. Work on the valuation of natural resources in Spain, using this method, are abundant,
HOLOS, Ano 30, Vol. 6 22
among which we should mention the economic valuation of the national heritage of the Cíes Islands (Prada et al., 2001), the Regional Park Calblanque (Martinez-Paz et al., 2007), etc. At this point it is interesting to note that Contingent Valuation Method work does not represent reality and clarify that the assessment performed (Farber et al., 2002) contains uncertainty because the ecological conditions are uncertain. Further we and defend (Hausman, 2012) that preferences are not stable although it would be convenient to assume stability of preferences in order to devise demand functions.
In defense of the Contingent Valuation Method, we argue that the alternative would give a value of zero or infinite recreational use and as that the results depend on the context, as can happen with anything else. With regard to the fact that preferences are not stable, this is not a MVC problem but is inherent to human nature.
For budgetary constraints 801 interviews were conducted, Table 1 specifies the number of visitors per year and the number of personal interviews park. The surveys were conducted in each of the parks on the marked trails and recreational areas that were busiest during the weekends. For these sample sizes and based on the variance of the variable under study (willingness to pay) sampling errors were 6% in Cardeña y Montoro, 5% Hornachuelos and 8% Sierras Subbéticas.
Table 1: Nature Parks.
PARKS VISITORS INTERVIEWS
Cardeña y Montoro 10,411 272
Hornachuelos 16,176 416
Sierras Subbéticas 4,230 113
TOTAL 30,817 801
Source: Authors. Data from the Ministry of Environment.
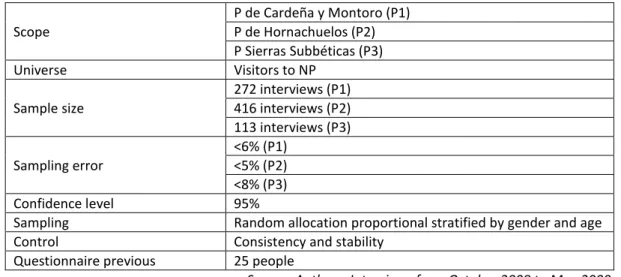
The sample (Table 2) was performed with proportional stratified random by gender and age group (between 18 and 30, 31 and 50, 51 and 70 years and over 70 years) for a lower error level to 4.9% and a confidence level of 95% (p = q = 0.5). Prior to fieldwork completed a questionnaire prior to 25 people.
Table 2: Technical. Scope P de Cardeña y Montoro (P1) P de Hornachuelos (P2) P Sierras Subbéticas (P3) Universe Visitors to NP Sample size 272 interviews (P1) 416 interviews (P2) 113 interviews (P3) Sampling error <6% (P1) <5% (P2) <8% (P3) Confidence level 95%
Sampling Random allocation proportional stratified by gender and age Control Consistency and stability
Questionnaire previous 25 people
Source: Authors. Interviews from Octubre 2008 to May 2009
The questionnaire was divided into three groups of questions: 1) characteristics of the visit to the park, with relevance to the costs incurred; 2) maximum willingness to pay for park
HOLOS, Ano 30, Vol. 6 23
admission, willingness to donate for the conservation of the park and accepted compensation by the non-enjoyment of the park; and 3) socioeconomic characteristics of the visitor.
2.3 The contingent valuation method
To calculate the maximum willingness to pay for the entrance (MWTP) logistic regression was used, a multivariate technique through which we intend to study the association relationship between a dichotomous variable and one or more independent variables (quantitative or categorical).
Using logistic regression, the Contingent Valuation Method requires asking a group of people what they would be willing to pay, or did pay, to obtain a specific good (Bishop and Heberlein, 1979), to determine a certain price whether the consumer purchases a good or not. The interest in this method progressed in the nineteen eighties, establishing (Hanemann, 1984) the theoretical basis for subsequent application.
According to Hanemann (1984) there is a relationship between the dichotomous response models and the theory of utility maximization that permits calculation of the willingness to pay for, as well as the welfare of individuals, based on the consideration that the consumer knows their initial utility function with certainty.
To calculate the maximum willingness to pay an entrance fee for visitors to enjoy the parks for recreational use, the visitor answers a series of questions about the willingness to pay. Following Gil et al. (2000) opting for a mixed format with binary type and open format questions.
This posed a dichotomous question to the individual. It proposed a set amount of money and the individual responded if he was willing or not to pay the suggested amount. The amounts proposed to avoid anchoring bias have been 3, 5, 7 and 11 €. The selection of these prices was performed according to Cooper (1993), and these five prices delimit the 80% of the observed distribution (Kanninen and Kriström, 1993). Later, based on the response obtained in the dichotomous question visitors were presented with a second open question to determine their maximum willingness to pay. According to Hanemann (1984), the maximum willingness to pay an entry is calculated by estimating the following logarithmic function:
(1)
Dibeing a dummy variable that takes a unit value if the visitor is willing to pay the price
quoted and zero otherwise, Ai collects prices stated by the WTP of visitors from the prices offered
to respondents (3, 5, 7 and 11 €), a and b are the parameters to be estimated and ui the error
term. From the above logarithm function average WTP is calculated as follows:
∫ ⁄ (2)
Once estimated, the extent of the value of recreational use relating to the importance of starting price is analyzed using the logit method (a discrete variable that contains the entrance price offered to visitors taking the values 3, 5, 7 and 11 €) and other socioeconomic variables on the preponderance to respond positively or negatively to the dichotomous question. The
HOLOS, Ano 30, Vol. 6 24
estimates could also have been made by maximum likelihood, assuming an accumulative distribution function of the willingness to pay of individuals log-logistic. Although Hanemann (1984) argued that the log-linear specification is not consistent with utility maximization, the fact is that, as is shown with empirical regularity, such specification often leads to a better quality of fit of the data and that the function, when defined only on the set of positive real numbers, is more consistent with the distribution of the willingness to pay of individuals (Júdez et al., 2003).
Then, using the two questions (closed and open) performed on the willingness to pay an entry and using the ordinary least squares model with semi-logarithmic specification of the dependent variable, we constructed a continuous variable. This variable expresses the value in use of each one of the parks, which were determined by the socioeconomic characteristics of the visitors to explain their maximum willingness to pay for recreational use of each of the parks.
The visitors' socioeconomic variables considered are: AG- a discrete variable indicating the respondent's age; IN-a discrete variable indicating monthly family income; EN– a discrete variable indicating the level of education; WA - a discrete variable indicating work activity; SX - a dichotomous variable indicating the sex; CF . a dichotomous variable indicating whether the visitor would be willing to contribute financially to the conservation of the park; VP - a dichotomous variable indicating whether the only purpose of travel is to visit the PN; NV – a discrete variable indicating the number of visits to PN in one year; NP - a discrete variable indicating the number of people traveling in the same car; PR - a discrete variable indicating the preferred reason for the visit and WTP - a dichotomous variable indicating whether the visitor would be willing to pay for recreational use the park.
In the willingness to donate (WTD) an annual contribution to the conservation of the park was selected as payment vehicle with the aim of estimating the value of future use by other individuals be they contemporaries or future generations.
In the willingness to accept compensation (WTC) a value arises from a willingness to receive compensation for not enjoying the park. This question proved more complicated in the interviews, due to the difficulty of understanding its meaning.
The format chosen in the Willingness to Donate and to accept to be compensated was to pose a dichotomous question (yes or no). If the answer is positive it is followed by an open question that asks the maximum amount which the respond and would be prepared to donate or the minimal amound that they would consider as acceptable compensation, thereby preventing bias to promote anchorage.
Estimates from the Contingent Valuation Method tend to be very sensitive to valuation questions (Caparrós and Campos, 2002) and are therefore likely to be affected by the payment vehicle and the scenario described (Hanemann, 1984) to avoid bias hypothesis.
It is therefore important to determine whether to use the maximum willingness to pay or the minimum willingness to accept compensation to avoid payment vehicle bias in the results on the number of protest responses.
Most works choose the more conservative question - willingness to pay, and following the recommendations of the commission of experts for the U.S. Administration Environment, NOAA (National Oceanic and Atmospheric Administration). Regarding the validity of the method concluded, (Arrow et al., 1993), this would yield reliable estimates of value, and subject to
HOLOS, Ano 30, Vol. 6 25
carrying out a correct design of the hypothetical market, recommending the use of the binary format as it avoids strategic bias, eases print response and represents a decision process similar to the market.
Carson (2012) argues that the Contingent Valuation Method involves general effects that usually characterize the behavior of market data and most of his critics have conceded in favor of the reliability of the contingent valuation method due to its provision of a reliable basis for measuring what that the public is willing to sacrifice for public goods.
In Spain, its application has been favored by the increase of the statements of the Administration of protected natural areas and the determination of the value of using a particular natural area for its visitors, from the hypothetical payment of an entrance to gain access to same.
Thus, Riera et al. (1994) applied the method in determining the value of the region of Pallars Sobirà (Lleida), Castillo et al., (2007) Natural Park Sierra de María-Los Vélez (Almería), Samos and Bernabéu (2011) Natural Park de los Calares del mundo y de la Sima (Albacete), among others.
In addition to estimating the value of the recreational use of each park we have proposed a methodology based on conventional markets (prices), the Travel Cost Method. And as has happened in similar studies, the recreational use value obtained by the Travel Cost Method differs and surpasses that obtained by the Contingent Valuation Method (Garcia and Colina, 2004).
Cameron (1992) demonstrates that the combination of methods involves gaining precision in the estimation of welfare measures, however there are significant differences between the estimates that are obtained by the two methods. The first difference is that contingent valuation estimates yield Hicksian consumer surplus and technique of travel cost estimates arises under a Marshallian demand curve. We have chosen these two valuation methods defined by the preferences of visitors by geographical location of the Nature.
2.4 The travel cost method
It is based on weak complementarity between demand Mäler the environmental good under study and some private goods (Azqueta, 1996). For example, if you wanted to evaluate the improvement of an environmental asset an increase in its consumption is expected, and the complementary relationship established with private goods would be an increase in demand for these. Knowing the demand function for private goods depending on the environmental good we could estimate the benefit of the improvement. To estimate the demand function the Travel Cost Method is developed in this study, in areas without equidistance.
For the welfare that is provided by users the enjoyment of the property, a consumer surplus calculation is necessary, once the demand function is known. , That is, the difference between the maximum amount visitors would be willing to pay for the number of units of the good demand and the amount actually paid in the market. Thus, we can calculate the value in use of a recreational area or changing the quality of an environmental asset to an improvement or deterioration.
HOLOS, Ano 30, Vol. 6 26
Regarding multipurpose trips, there were no longer consistent with those coming from further afield and whom stayed for the park. The number of inhabitants of each area was obtained by consulting the database of the National Institute of Statistics (NIS). To calculate the rate of visitors from each zone we have only considered the data populations of the municipalities relating to the residence of visitors (Prada et al., 2001).
There is no unanimity on the issues that should be considered as travel costs. We propose allocating them into two groups, those "unavoidable" and from the movement to the place and those considered "discretionary". For the present study, for distances in kilometers traveled we have implemented a fuel cost per person and € 0.10 per kilometer.
We have not included travel time cost because 100% of the sample displacement considered it to have been a nice trip and thus did not consider it to be a cost but an enjoyment, despite being very controversial and included a number of previous, (Campos et al. 1996; Vidal et al., 2004). It is estimated that if the person is free to choose their working day, then the value of their free time is determined by wage increases that cannot fail to perceive devote that time to work, but the reality is that for most people their working time and rest time is imposed.
The time of the visit has not been computed, we assume that the choice of visiting the countryside is because the respondent has estimated it would bring greater satisfaction and therefore considered zero opportunity cost for the time to visit. The omission of this information is unlikely to result in significant errors in estimating the recreational value of an environmental good (Farré, 2003).
To estimate the demand function for the TCM in areas without contours, as indicated by Riera, et al., (2005) it is required to get the following information for the following function:
Vij / Ni = f (Cij, Yi, Sj) 3
Where:
Vij is the total number of people who travel to the area i to area j per unit of time, usually
a year. Ni is the population of zone i. Vij / Ni is the average propensity of visitors to the area i into
space valued j. Cij is the travel cost from zone i to j study area. Yi is a vector of socioeconomic
characteristics of the area i. Sj is a vector space valued substitutes spaces j in zone i.
If, on the vertical axis we place the average number of visits to the park (independent variable) and on the horizontal axis we place travel costs (dependent variable), we obtain the points of a hypothetical demand curve. This would allow the consumer surplus to determine a visitor's representative and, from there, bring the total value of the recreational services that the environment provides, depending on the number of visitors (Azqueta, 1996).
Based on the work of Bengoechea (2003), among others, to assess an application by TCM areas we have divided the area of influence of the place into concentric zones using a Geographic Information System (GIS) for more accurate calculations, so that each is characterized by a certain monetary cost.
To determine the potential population of visitors in a natural area of influence, we have used ARCGIS, and spatial analysis of the data, we used a buffer which overcomes the assumption of straight-line distance and makes travel time estimates based on real maps of roads, ,. The
HOLOS, Ano 30, Vol. 6 27
number of inhabitants in each area (ring) was obtained from the population data of the NIS. Building on the municipalities map data from all provinces of Spain, a centroid has been assigned to each municipality, and this centroid has been associated with the total population of the municipality.
To calculate the rate of visitors the distance to the park from the place of origin of the visitors has been taken into account. These distances vary for each park and in no case are equidistant. Its procedure is the representation of travel cost points and ratios Vij / Ni among
which we assume a linear extrapolation (always negative slope). They are calculating consumer surplus of each population area, cumulatively, as the sum of the remaining areas under the demand curve along each section, multiplying each of these by the existing population in each zone.
3 RESULTS AND DISCUSSION
The visit is organized in groups of families or friends, with the presence of children. The visitor profile is a relatively young - approximately 70% of visitors are aged below 50 years, is divided equally between the sexes and mostly composed of professionals with media studies. Visitors usually live in municipalities with fewer than 50,000 inhabitants, are employees and have an average monthly household net income of less than 2,100 €, which tells us about the ability to pay for services provided (Table 3). The results obtained are in line with the results in other studies involving natural spaces in Spain (Martinez-Paz et al., 2008, Samos and Bernabéu, 2011). The means of transport used for the movement is the automobile.
Table 3: Socio-economic characteristics of visitors
Variable Sample (%)
Cardeña y Montoro Hornachuelos Sierras Subbéticas
Sex Man 50.8 53.2 45.0 Female 49.2 46.8 55.0 Age (years) 18-30 38.5 31.2 32.3 31-50 36.6 38.9 53.8 51-70 22.2 27.7 9.7 >70 2.7 2.2 4.3 Studies Elementals 32.0 47.7 39.0 Media 37.0 37.3 34.0 Higher 31.0 15.1 27.0 Work activity Entrepreneur 12.0 20.0 14.0 Salaried 43.0 38.1 41.0 Housewife 9.0 10.4 5.0 Student 21.0 12.3 14.0 Retired 6.0 12.5 9.0 Other† 9.0 7.7 17.0
Monthly family net income (€) <900 2.3 33.2 14.0 De 900 a 1.500 21.1 49.0 36.6 De 1.501 a 2.100 44.2 14.5 26.0 Más de 2.100 32.4 3.3 23.4 Municipality of residenc. < 10.000 hab. 41.0 29.0 26.0 10.000 – 50.000 hab. 23,0 41,1 60.0 > 50.000 hab. 36.0 29.9 14.0 †
Standing, family assistance recipients, etc.
HOLOS, Ano 30, Vol. 6 28
However, a higher monthly income was observed in Cardeña y Montoro, which in turn is stressed by the number of overnight stays among the three parks. The best known outside of Andalucía is Hornachuelos which has a high use by private hunting, and is highly valued by its supporters nationally and internationally. In turn the park is less visited by the inhabitants of the area due to its less extensive public space.
The assessment was undertaken in response to knowledge gained from the authorization system of the Administration and we do not have information on the uses of private land.
In hunting use we must include authorized hunting activity (Table 4).As the activity of small game hunting is not regulated, no data are available from the administration on this activity.
Table 4: Hunting use.
Parks Deer
(CervusElaphus)
Boars (Sus scrofa)
Mouflon
(Ovis orientales musimon)
Gamos
(Dama dama)
Cardeña y Montoro 2,546 561 170 519
Hornachuelos 4,042 985 82 52
Sierras Subbéticas - 75 - -
Source: Authors. Data from the Ministry of Environment
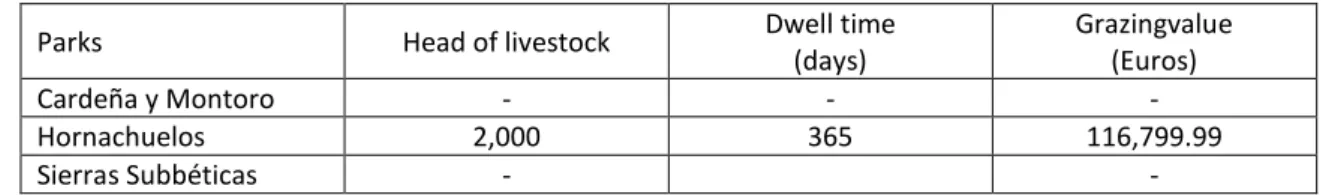
In exploitation of pastures in Cardeña y Montoro only done in private estates, where most of those in the sector work. In Sierras Subbéticas there were no livestock exploitations and its calculation Hornachuelos estimate € 11,800 (Table 5).
Table 5: Use of publicly owned pastures Parks Head of livestock Dwell time
(days) Grazingvalue (Euros) Cardeña y Montoro - - - Hornachuelos 2,000 365 116,799.99 Sierras Subbéticas - -
Source: Authors. Data from the Ministry of Environment
In developing beekeeping (Table 6), honey is the main rank, but additional products such as beeswax, royal jelly, pollen, etc. are also derived. There was no agricultural use in the parks.
Table 6: Beekeeping use.
Parks Hivesavailable Average yield per hive (kilos/year)
Cardeña y Montoro 60 20 2,640
Hornachuelos 1,300 20 25,997.8
Sierras Subbéticas - - -
Source: Authors. Data from the Ministry of Environment
The use of cork is one of the main forest resources. Cardeña y Montoro have an output of 166,818 kg of cork seconds and 16,682 kg of virgin cork, representing a value of € 263,282.64. Hornachuelos produced 42,012 quintals of reproduction cork and 1,755 pounds of virgin cork with a value of € 2,888,622.
The use of wood is obtained from pine parks in different varieties (Table 7). In Sierras Subbéticas there was no timber harvesting. In Cardeña y Montoro this has a value of € 29,393.84 and of € 933.34 in Hornachuelos.
HOLOS, Ano 30, Vol. 6 29 Table 7: Timber harvesting
Type of wood Cardeña y Montoro Hornachuelos
Pinuspinea a 8 €/m3 28 m3 - Pinuspinaster a 9 €/m3 732,5 m3 - Pinuspinea a 1,1 €/m3 1,458.60 m3 - Pinuspinaster a 1,4 €/m3 543,2 m3 - Pinuspinaster a 2,74 €/m3 568,14 m3 - Pinuspinaster a 6,96 €/m3 - 134,10 m3 Pinuspinea a 6 €/m3 1,359.40 m3 - Pinuspinaster a 7 €/m3 1,499.90 m3 -
Source: Authors. Data from the Ministry of Environment
The ecological advantage as CO2 reservesof the parks is € 200.3 million.
Next, we analyzed the value of recreational use of the parks. We analyzed the results obtained from the application of the Travel Cost Method zonal without equidistance (Vidal et al., 2004, Castillo et al., 2008) to estimate the demand function we distinguished visitors and classified concentric zones around each of the parks. In each of the parks we defined five concentric geographical areas, taking the park as the center (Figures 5, 6, 7).
Figure 5 - Results obtained in Cardeña y Montoro. Source: Authors. INE data
HOLOS, Ano 30, Vol. 6 30 Figure 6 - Results obtained in Hornachuelos.
Source: Authors. INE data
Figure 7 - Results obtained in Sierras Subbéticas Source: Authors. INE data
HOLOS, Ano 30, Vol. 6 31
To determine the points of the demand function we obtained a surplus and visitors, which when multiplied by the number of visitors a year, gave the total surplus (table8). Considering the results obtained in the three parks, the difference in value obtained for Cardeña y Montoro is as a result of overnight stays by visitors, since most of the visitors are hikers. Therefore, the Administration should promote visits spent in the parks.
Tabla 8 Total surplus (Euros) TravelCostMethodvisitors Parks Surplus per visitor
(Euros) Number of visitors
Total surplus (Euros) Cardeña y Montoro 1,462. 41 31,000 45,334,675.19
Hornachuelos 152.54 14,482 2,209,084.20
Sierras Subbéticas 211.26 11,838 2,500,936
Source: Authors. Data from the Ministry of Environment 1999.
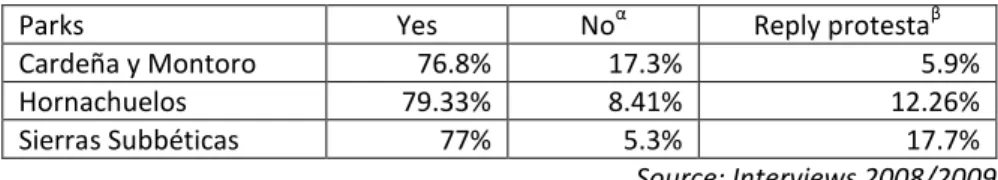
In applying the Contingent Valuation Method we obtained the maximum willingness of visitors to pay for entry to the park and willingness to donate for the conservation of the park. The analysis of closed and open questions obtained the results shown in table 9 and eliminated protest responses, as indicated (Farré, 2003) and maintained legitimate zeros (Dziegielewska and Mendelsohn, 2007). The maximum willingness to pay for the entrance to each of the parks and the annual willingness to donate for conservation is observed in table 10. To obtain these results the number of visits to each park, according to the Report of the Provincial Delegation of Córdoba of the Junta de Andalucía (2010), was taken into account.
Table 9: Would you be willing to pay an entrance fee to enjoy the natural park?
Parks Yes Noα Reply protestaβ
Cardeña y Montoro 76.8% 17.3% 5.9%
Hornachuelos 79.33% 8.41% 12.26%
Sierras Subbéticas 77% 5.3% 17.7%
Source: Interviews 2008/2009
α
:due to lack of financial resources (real zeros)
Β: Responses such as the following were considered to be protest responses: "Public Administration must deal" and
"already pay taxes." In these cases, the true willingness to pay for park admission is not zero.
We can say that the WTP obtained by the entrance to the parks in this study is similar to those obtained in other studies carried out in Spain. So Samos and Bernabéu (2011) obtained € 4.02 for the NP de los Calares del Mundo, Martinez-Paz et al (2008) in Calblanque Regional Park, Monte de lasCenizas y Peña del Águila, maximum values WTP are similar and within a range of between 4.5 and 7 €.
Table 10: Euros willing to pay to enjoy and to preserve the park Parks Willingness to pay an entrance
fee (Euros) to enjoy the park
Willingness to donate (Euros) for conservation of the park
Cardeña y Montoro 4.3 € 31.31 €
Hornachuelos 4.16 € 51 €
Sierras Subbéticas 5.1 € 46 €
Source: Interviews 2008/2009
However, there are other studies in Spain where the WTP obtained differs substantially to that obtained in this work. Thus, Gonzalez (2001) obtained low values of maximum willingness to pay, respectively, of 2.30 € for Mount Aloi, 1.41 € for the Pozas de Mougás, and 1.5 € for Monte
HOLOS, Ano 30, Vol. 6 32
Santa Tecla (Galicia), perhaps because these are parks in which a large number of the visitors live nearby.
Ultimately, the protest response values of our work can be considered as within acceptable limits established by the literature. Mitchell and Carson (1989) indicate protest responses usually ranging between 20% and 30%. The work done in Spain by Samos and Bernabéu (2011) with 20.5%, Oviedo et al., (2005) with 23.0% and Martinez-Paz et al., (2008) with a 29.1% all fall within this range.
Moreover, other studies in Spain do not reach the 20% protest response rate and their results are often based on the type of question asked. So, Perez Y Perez, et al., (1996) estimate the response rate of 0.7% protest when the format of question is dichotomous, and 7.2% when mixed. Barreiro and Perez Y Perez (1997) obtained 2.8% of protest responses when the question is of a dichotomous nature and up to 26.1% when mixed. Del Saz and Suárez (1998) obtained 1.0% of protest responses when the question format is dichotomous and 16.4% when mixed. Farré (2003) and Campos et al., (1996), which use the mixed question format, gave 15.6% and 16.9% of protest responses, respectively.
The scenarios for estimating the maximum willingness to donate for the conservation and high acceptance to be compensated for not being able to enjoy the visit to the park posed the individual with a dichotomous question and a yes or no answer. Later, based on the response, the visitor was asked a second open question to know their maximum willingness to donate and minimal acceptance to be compensated for the loss of use of the property.
As noted by Riera et al. (1994), there is a debate about what is the most appropriate outcome measure: the mean or median, in any of its variants. In dichotomous questions, the median has some advantages as being more consistent (Hanemann, 1994; Werner and Groves, 1993). However, it is common to calculate the simple average of the maximum willingness to pay indicated by respondents (Perez And Perez and Del Saz, 1997) as is determined in this work.
The donation value (Table 13) obtained under the hypothesis of willingness to donate an annual contribution to the conservation of the park, after excluding protest responses, is higher than in other studies in Spain. Castillo et al (2007) obtained a figure of € 16.5 for NP Sierra María-Los Vélez, while Vidal et al. (2004) obtained € 16.6.
We are unable to estimate the minimum value of willingness to accept compensation for not being able to enjoy the park due to protective measures by the Administration as protest responses reached 96% in Cardeña y Montoro, 98% and 95% Hornachuelos Sierras Subbéticas. However, Carson (2012) argues that a well designed contingent valuation should convey that the government is considering implementing a policy and that their responses will help inform that decision.
In this work we have been able to corroborate that the choice of one degree or another assessment, either the maximum willingness to pay or willingness to be compensated in euros because they cannot enjoy the park, is not indifferent, since there are differences between the two measures (Farré, 2003; Hausman, 2012).
The NOAA report (1993) recommends asking for WTP, the more conservative option, even if the willingness to be compensated variable is theoretically correct, as this minimizes the risk of overestimation in the answers.
HOLOS, Ano 30, Vol. 6 33
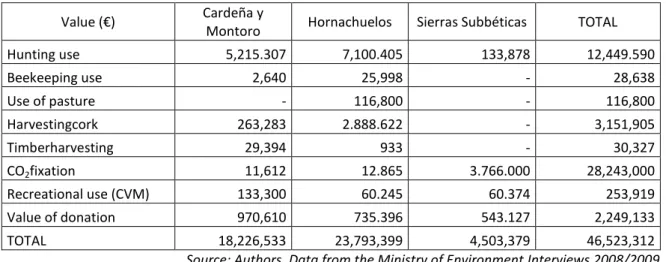
Finally, we have obtained an approximation of the economic value of the NN PP of Córdoba by the TCM of € 167,703,498.60. And by the CVM of € 56,000,200.80. The value obtained by the CVM is lower than that achieved by the TCM, is that employs more conservative values (table 11).
Table 11: Approach to Economic Value generated by the parks as Contingent Valuation Method. Value (€) Cardeña y
Montoro Hornachuelos Sierras Subbéticas TOTAL Hunting use 5,215.307 7,100.405 133,878 12,449.590 Beekeeping use 2,640 25,998 - 28,638 Use of pasture - 116,800 - 116,800 Harvestingcork 263,283 2.888.622 - 3,151,905 Timberharvesting 29,394 933 - 30,327 CO2fixation 11,612 12.865 3.766.000 28,243,000 Recreational use (CVM) 133,300 60.245 60.374 253,919 Value of donation 970,610 735.396 543.127 2,249,133 TOTAL 18,226,533 23,793,399 4,503,379 46,523,312
Source: Authors. Data from the Ministry of Environment.Interviews 2008/2009.
4 CONCLUSIONS
Economic valuation of the parks is an effective tool in combating the problems of protection and conservation of the environment and sustainability, as they have a high potential for generating profits. The characteristics of a public good in Spain to generate assets isnot offered in the market, and from this perspective, could lead to inadequate staffing. The administration does not have the necessary information of the design of these natural areas. Therefore, the assessment of the benefits generated becomes a critical aspect in its management.
We argue that, of all the techniques of environmental assessment that can be applied,the contingent valuation method offers more advantages, both for use as non-use. This method does not have the methodological limitations of other techniques such as those based on production functions or travel cost.
From an economic point of view it is reasonable to require that public spending on natural heritage be justified, and that public production analyzesthe potential against other social needs such as health, education, infrastructure, etc.. This should be permanently involved in decision-making about the same, and used to better endorse, and strengthen conservation arguments.
The Visitors Parks are positively valued. Therefore, we can conclude that social benefits exceed the costs of conservation by public institutions and citizens value the public investments in protection and conservation of the same.
5 REFERENCES BIBLIOGRAPHIES
1. ARROW, K., SOLOW, R., PORTNEY, P.R., LEAMER, E.E., RADNER, R., SCHUMAN, H. Report of the NOAA Panel on Contingent Valuation, National Oceanic and Atmospheric Administration (NOAA). Federal Register V.S8 nº 10, January 11. 1993.
HOLOS, Ano 30, Vol. 6 34
2. AZQUETA, D. Métodos para la determinación de la demanda de servicios recreativos de los espacios naturales en Gestión de espaciosnaturales. La demanda de servicios recreativos. Azqueta, D. y Pérez, L. (eds.), McGraw-Hill. Madrid, 51-74. 1996.
3. BARBERÁN, R., EGEA, P., PÉREZ Y PÉREZ, L. Los costes de la red Natura 2000 en Aragón. Metodología y estimación para Monegros y Los Valles. CITA. Documento de Trabajo, 2002, vol. 1. 2002.
4. BARREIRO, J., PÉREZ Y PÉREZ, L. Efecto del formato de pregunta en valoración de bienes públicos a través del método de valoración contingente. Hacienda Pública Española 143(4), 107-121. 1997.
5. BENGOECHEA, A. Valoración del uso recreativo de un espacio natural. Estudios de Economía Aplicada, agosto, 2003/vol. 21, nº 002. Asociación de Economía Aplicada (ASEPELT). Madrid, España, 321-338. 2003.
6. BISHOP, R. C., HEBERLEIN, T. A. Measuring values of extra-market goods: are indirect meausures biased?.American Journal Agricultural Economic, 61, 926-930. 1979.
7. BOYLE, K.J., BISHOP, R.C. The total value of wildlife resources: conceptual and empirical issues. Paper presented at the Association of Environmental and Resource Economics Workshop on Recreation Demand Modeling, Boulder, Colorado. 1985.
8. CAMERON, T.A. Combining contingent valuation and travel cost data for the valuation of nonmarket goods. Land Economics, 68 (3), 302-317. 1992.
9. CAMPOS, P., RIERA P., DE ANDRÉS, R., URZAINQUI, E. El valor económico total de un espacio de interés natural. La dehesa del área de Monfragüe. In: Azqueta, D., y L. Pérez y Pérez. (eds). Gestión de EspaciosNaturales. La Demanda de Servicios Recreativos. McGraw-Hill, Madrid, 193-216. 1996.
10. CARSON, R. T. Contingent Valuation: A Practical Alternative when Prices Aren´t Available. Journal of Economic Perspectives, 26(4), 27-42. 2012.
11. CASTILLO, M.E., SAMIR, S., CEÑA, F. El valor del uso recreativo del P N Sierra de María-Los Vélez (Almería). Economía Agraria y de losrecursos naturales, 8(2), 49-72. 2007.
12. DEL SAZ, S., SUÁREZ, C. El valor del uso recreativo de espacios naturales protegidos: aplicación del método de valoración contingente al Parque Natural de L’Albufera. Revista Española de Economía Agraria 182, 225-272. 1998.
13. DZIEGIELEWSKA Y MENDELSOHN.Does “no” mean “no”? A protest
methodology.Environmental and Resource economics. Vol. 38,nº1, 71. 2007
14. FARBER, S., CONSTANZA, R., WILSON, M. Using conjoint analysis to value ecosystem change. Environmental Science &Technology 34(8), 1407-1412. 2002
15. FARRÉ, M. El valor de uso recreativo de los espacios naturales protegidos. Una aplicación de los métodos de valoración contingente y del coste del viaje. Estudios de Economía Aplicada 21(2), 297-320. 2003.
16. GARCÍA, L., COLINA, A. Métodos directos e indirectos en la valoración económica de bienes ambientales. Aplicación al valor de uso recreativo del Parque Natural de Somiedo. Estudios de Economía Aplicada 22(3), 811-838. 2004
HOLOS, Ano 30, Vol. 6 35
Potencial de mercado de los productos ecológicosenAragón. Ed. Diputación General de Aragón. Zaragoza, 225 p. 2000.
18. GONZÁLEZ, M. Estimación de beneficios en espacios de uso recreativo en la provincia de Pontevedra. Revista Galega de Economía 10(1), 193-210. 2001.
19. HANEMANN, W.M. Welfare evaluation in contingent valuation experiments with discrete responses.American Journal of AgriculturalEconomics, 66, 332-341. 1984.
20. HANEMANN, W.M. Valuing the environment through contingent valuation. Journal of Economic Perspectives 8(4), 19-43. 1994.
21. HAUSMAN, J. Contingent Valuation: From Dubious to Hopeless. Journal of Economic Perspectives26 (4), 43-56. 2012
22. JÄGER, M., GARCÍA, J., CAJA, J., BURKART, R., RIEGELHAUPT, E. Valoración económica de los bosques; revisión; evaluación; propuestas. Fundación para la Conservación de las Especies y el Medio Ambiente (FUCEMA). Unión Mundial para la Naturaleza (UICN). 29 p. Disponible en: www.fucema.org.ar/gnb/valorización_bosques.pdf. 2001.
23. JÚDEZ, L., DE ANDRÉS, R., URZAINQUI, E. Valoración del uso recreativo del Parque Nacional de Doñana. Madrid: Colección de Estudios Ambientales y Socioeconómicos, 3 CSIC. 2003. 24. JUNTA DE ANDALUCÍA (2010): http:// www.juntadeandalucia.es/medio_ambiente.es
Consulta 1 de junio de 2010
25. KANNINEN, B.J., KRISTRÖM, B. Sensitivity of willingness to pay estimates to bid design in dichotomous choice valuation models: Comment. Land economics 69 (2), 199-202. 1993. 26. MARTÍNEZ-PAZ, J., MARTÍNEZ-CARRASCO, F., FRUCTUOSO, E., NAVALÓN, E. Valoración
económica y políticas de gestión en el Parque Regional de Calblanque, Monte de las Cenizas y Peña del Águila (Murcia). Comunicación presentada al III Congreso de la Asociación Hispano-Portuguesa de Economía de los Recursos Naturales y Ambientales. Palma de Mallorca, 4-6 de junio. 2008.
27. MITCHELL, R.C., CARSON, R.T. Using Surveys to Value PublicGoods: The Contingent Valuation Method. Washington, D.C.: stylus pub IIc, 463 p. 1989.
28. MORRISON, B.F. Compendio de alimentación del ganado. U.T.E.H.A. (Unión Tipográfica Editorial Hispanoamericana). VIII Edición. México. 1966.
29. OVIEDO, J.L., CAPARRÓS, A., CAMPOS, P. Valoración contingente del uso recreativo y de conservación de los visitantes del Parque Natural los Alcornocales. Estudios Agrosociales y Pesqueros 208, 115-140. 2005.
30. PEARCE, D.W., TURNER, R.K. Economía de los Recursos Naturalesy del Medio Ambiente. Colegio de Economistas de Madrid. Celeste Ediciones. Madrid, 488 p. 1995.
31. PÉREZ Y PÉREZ, L., BARREIRO, J., SÁNCHEZ, M., AZPILICUETA, M. La valeurd’usage à des fins de loisir des espacesprotégés en Espagne. Comparision entre métgide des uts de déplacement et méthodedévaluation contingente.Cahiersd’Economie et Sociologie Rurales, nº 41, 40-56. 1996.
32. PÉREZ Y PÉREZ, L., DEL SAZ, S. Valoración contingente de los servicios recreativos de espacios protegidos: el caso del Parque Natural de la Dehesa del Moncayo. Cuadernos Aragoneses de Economía 7(1), 135-145. 1997.
HOLOS, Ano 30, Vol. 6 36
33. PORRAS, N. El monte mediterráneo en los albores del tercer milenio; a la luz de la economía ambiental y la economía ecológica. Montes;revista de ámbito forestalnº 72; 2º trimestre, 72-78. 2003.
34. PRADA, A., GONZÁLEZ, M., POLOMÉ, P., GONZÁLEZ, X., VÁZQUEZ, M.A. Valoración económica del patrimonio natural. Instituto de Estudios Económicos de Galicia Pedro Barrié de la Maza, A Coruña. 2001.
35. RIERA, P., DESCALZI, C., RUIZ, A. El valor de los espacios de interés natural en España. Aplicación de los métodos de la valoración contingente y el coste del desplazamiento. Revista Española de Economía, monográfico Recursos Naturales y Medio Ambiente, 207-320. 1994.
36. SAMOS, A., BERNABÉU, R. Preferencias de servicios en el Parque Natural de los Calares del Mundo y de la Sima (Albacete, Castilla-La Mancha, España). Agrociencia45, 519-530. 2011. 37. VIDAL, F., MARTÍNEZ-CARRASCO, L., ABENZA, L., GONZÁLEZ, E. Valoración económica del
Parque Regional de Sierra Espuña (Murcia). V Congreso de Economía Agraria 15-17 septiembre. Universidad de Santiago de Compostela.2004.
38. WERNER, M., GROVES, T. A Practical Procedure for Public Policy Decisions. Contingent valuation and demand revelation –without apology. In: Discussion Paper. San Diego. University of California, Dep. of Economics, 93-51. 1993.