BJRS
RADIATION SCIENCES
08-01 (2020) 01-13ISSN: 2319-0612 Accepted: 2019-12-02
Image quality evaluation of a small animal PET scanner
Gontijo, R.M.G.
1,2; Ferreira, A.V.
1; Souza, G.C.A.
1,2;
Mendes, B.M.
1; Silva, J.B.
1; Mamede, M.
1,21Centro de Desenvolvimento de Tecnologia Nuclear (CDTN / CNEN)
31270-901 Belo Horizonte, MG, Brasil
2Universidade Federal de Minas Gerais (UFMG)
Departamento de Anatomia e Imagem 30130-100 Belo Horizonte, MG, Brasil
ABSTRACT
Performance testing of small animal PET scanners is very important to ensure the high performance required for this particular type of PET scanner. In this sense, National Electrical Manufactures Association (NEMA) published its NU 4/2008 standards, a consistent and standardized methodology for measuring scanner performance parameters for small animal PET imaging. Imaging capabilities of the scanner LabPET SOLO 4 were tested during two years according NEMA NU 4/2008 methodology. Results indicates that the equipment, despite a decade of use, presents performance appropriated and similar to performance of equipments reported in Literature.
1. INTRODUCTION
The importance of small animal Positron Emission Tomography (PET) has increased during the last decades as a valuable tool to noninvasive in vivo studies of preclinical animal models, to contribute in the drug development, to evaluate novel PET tracers and to in vivo therapy monitoring [1, 2]. In the case of radiopharmaceutical development, before human trials, it is necessary an extensive data of preclinical studies concerning dose, biodistribution, route of excretion, effectiveness for a clinical indication and toxicity. Before the preclinical PET scanners development, such preclinical data could be obtained only through sacrificing and tissue dissecting of a large number of animals [1]. Nowadays small animal PET scanners allow an entire dynamic biodistribution study in a same animal in a single scan. Furthermore, a single animal can be studied multiple times during the course of the preclinical evaluation.
Due to differences in size between humans and rodents, PET scanners dedicated to small animals imposes higher performance requirements than does clinical PET scanners [3]. The small structures of small animals are subjects two or three orders less in weight and volume than the human structures.
Guidelines to evaluation small animal PET scanners performance were introduced last decade [4] while guidelines for clinical PET scanner evaluation have been available for a long time [5, 6, 7, 8]. The National Electrical Manufactures Association (NEMA) in its NEMA Standards Publication NU 4/2008 [4] presents a consistent and standardized methodology for evaluating the performance of small-animal PET scanners. According this publication, the PET performance should be evaluated by the following parameters: 1) Spatial Resolution; 2) Sensitivity; 3) Coincidence Events Rate; and 4) Image quality [4].
The purpose of this work was to evaluate the performance of the LabPET SOLO 4 system installed at CDTN/CNEN. The equipment is used in preclinical stages of development of new radiopharmaceuticals as in studies of new applications of traditional radiopharmaceuticals. Therefore, its very important to assure its appropriated performance in order to guarantee the reliability, reproducibility and validity of preclinical data. Imaging capabilities of the scanner were evaluated on the basis of the NEMA NU 4/2008 publication [4]. The image quality parameters (i)
uniformity, (ii) spill-over-ratio and (iii) recovery coefficients were evaluated during two years, from March 2017 to March 2019.
2. MATERIALS AND METHODS
The TriumphTM platform is a small animal PET system dedicated for rodents imaging. The
subsystem LabPET 4 consists of a stationary gantry with 1536 detectors. It employs an Avalanche Photo Diode (APD) detector ring incorporating an assembly of Lutetium yttrium oxyorthosilicate – Lu1.9Y0.1SiO5 (LYSO) and Lutetium gadolinium oxyorthosilicate – Lu0.4Gd1.6SiO5 (LGSO)
scintillators optically coupled one after the other [9]. LabPET 4 images are acquired using a 250-650 keV energy window and 22 ns coincidence timing window. It provides axial field of view (FOV) of 3.7 cm and can operate in a dynamic or static mode. Coincident data are saved in list mode and can be sorted out as sinograms. Some important features are compiled in Table 1. More details about the LabPET 4 design and architecture are presented elsewhere [10, 11].
Table 1: Summary of the LabPET 4TM technical specifications.
Parameter Specification
Detector Crystal Material Phoswich pair of LYSO and LGSO
Crystal Dimension 2.0 x 2.0 x 14 mm3
Number of detector rings 24
Crystals per ring 64
Number of Crystals 1536
Axial field-of-view 37 mm
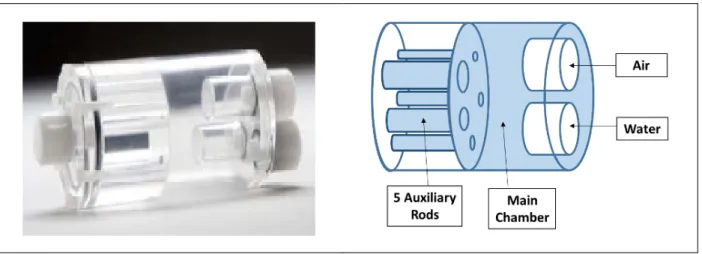
For imaging capabilities evaluation, the NEMA NU 4/2008 recommends a specific Image Quality (IQ) phantom. This phantom (Figure 1) is made up of polymethylmethacrylate (PMMA) with internal dimensions of 50 mm length and 30 mm diameter. It possess a main chamber that communicates with five different diameters auxiliary rods (1, 2, 3, 4, and 5mm), all of which are expected to be filled with radiopharmaceutical water solution. Thus, activity concentration in any rod is the same that the one in main chamber. In addition, the IQ phantom possess two cold
chambers - one of them to be filled with air and the other one with water, both no radioactive. Details of IQ phantom are presented at NEMA 4-2008 publication [4].
Figure 1: Image Quality phantom. Right: Photo gallery of authors; Left: schematic representation
where blue indicates radiopharmaceutical fillable volumes.
IQ phantom was filled with 18F-FDG (Radioglic®) aqueous solutions (3.7 MBq) and placed on
mouse imaging bed to simulate actual mouse imaging. The activity in the phantom were measured with a Capintec CRC®-25R activimeter. PET image acquisition was done for 20 min. The fillable volume of the phantom is 22 ml. Thus, the expected activity concentration in IQ phantom is 168.2 kBq.ml-1.
IQ phantom image acquisition and reconstruction were performed with the LabPET 1.12.1 software, provided by the small-animal PET scanner manufacturer [12]. Image reconstruction protocol consists of MLEM-3D algorithm, 20 iterations, no high resolution mode, no attenuation or scatter corrections, no post-filtering. Figure 2A presents a typical PET image of the IQ phantom.
After image reconstruction, image quality tests recommended by the NEMA 4-2008 publication [4] were performed, namely Uniformity, Spill-Over Ratio (SOR) and Recovery Coefficient (RC):
(i) The Uniformity test consists of to obtain mean (ACmean), maximum (ACmax), minimum
(ACmin) and standard deviation (ACSD) of the activity concentration in the main chamber. To
height shall be analyzed (Figure 2B)[4]. The number of counts per second (CPS) in the VOI were converted in activity concentration (kBq.ml-1) using a previous calculated conversion coefficient
(CC). The percentage standard deviation (%SD), also named image roughness (%IR) [13], was evaluated according the equation (1):
%𝑆𝑆𝑆𝑆 = %𝐼𝐼𝐼𝐼 = 100 ×
𝐴𝐴𝐴𝐴𝑆𝑆𝑆𝑆𝐴𝐴𝐴𝐴𝑚𝑚𝑚𝑚𝑚𝑚𝑚𝑚 (1)
where ACSD is the standard deviation of the activity concentration measured in VOI of 22.5 mm
diameter and 10 mm height positioned in the uniform region of the IQ phantom; and ACmean is the
mean activity concentration measured in the same VOI.
(ii) The ratio between the mean activity measured in a cold chamber (filled with air or water) and the mean activity measured in the main chamber provides the Spill-Over Ratio. To perform this test, a central cylindrical VOI (4 mm diameter, 7.5 mm heigh) shall be analyzed (Figure 2C) [4].
(iii) The ratios between the mean activity measured in each one of the five auxiliary rod and the mean activity measured in the main chamber provides the image Recovery Coefficients. To perform this test, the 10mm length central region of each rod shall be average to obtain a single image in which the coordinates of the highest value pixel are determined. Then, for each rod, the mean activity concentration must be determined considering a 10mm axial line passing through the highest value pixel (Figure 2D) [4].
More details of the image analysis for image quality tests are provided in NEMA 4-2008 [4]. In this work, image quantitative analysis were performed using PMOD® software, v3.7 [14] - a software designed for research in the field of molecular imaging that allows quantitative data processing. Activity concentration in specific VOI was achieved using PMOD® PBAS tool. This tool supports viewing and processing of molecular images and allows quantitative approaches as statistics of VOI pixels [14].
The PET quality imaging tests were repeated 17 times, from March 2017 to March 2019 in order to evaluate the performance of the small animal scanner.
Figure 2: A: Typical IQ phantom PET image; B: cylindrical VOI positioned for Uniformity test;
C: cylindrical VOIs positioned for Spill-Over Ratio test; D: Recovery Coefficient test: (left) red line indicates the 10mm length central region of the 5mm rod; (right) orange circle indicates the average image of the 10mm length central region of 5mm rod and cross indicates the hottest pixel.
A B
C D
3. RESULTS AND DISCUSSION
Uniformity tests:
The results of the uniformity tests are presented in the Table 2. The mean ACmean in the VOI of
22.5 mm diameter and 10 mm height positioned in the uniform region was 178 ± 5 kBq.ml-1.
Table 2: Uniformity tests results. Values of activity concentration (mean, standard deviation,
minimum and maximum) and Image Rougness (%IR) for each image evaluated are presented.
Image Date (kBq.mlACmean-1) (kBq.mlACSD-1) (kBq.mlACmin-1) (kBq.mlACmax-1) %IR (%)
1 30/03/2017 180.1 12.7 134.4 237.2 7.1 2 19/04/2017 179.3 15.2 121.9 240.3 8.5 3 02/05/2017 175.8 14.3 126.4 230.7 8.1 4 16/05/2017 177.1 12.2 136.9 235.6 6.9 5 02/06/2017 176.6 11.7 130.5 222.1 6.6 6 14/06/2017 178.0 12.8 123.2 238.4 7.2 7 30/08/2017 174.4 14.8 119.8 246.3 8.5 8 14/09/2017 174.5 14.6 128.0 258.6 8.4 9 28/09/2017 176.5 15.4 126.4 245.6 8.7 10 19/10/2017 177.7 15.0 121.3 237.4 8.4 11 01/11/2017 172.7 14.9 120.9 229.6 8.6 12 01/12/2017 172.7 12.6 124.8 223.6 7.3 13 20/03/2018 189.1 17.2 131.9 263.7 9.1 14 12/06/2018 187.4 17.9 121.9 240.3 9.6 15 18/09/2018 183.0 18.9 126.4 230.7 10.3 16 29/11/2018 179.8 16.3 127.0 265.5 9.1 17 20/03/2019 179.7 14.6 121.5 246.6 8.1 Mean - 178 15 126 241 8 SD - 5 2 5 13 1
AC = Activity Concentration in the uniform region VOI; %IR = Image Roughness.
All ACmean values are higher than expected activity concentration in the IC phantom (168 kBq.
ml-1). It is believed that the conversion coefficient (CC) used to convert CPS.voxel-1 in kBq.ml-1
was responsible for this systematic overestimation. The CC was obtained using a mouse phantom, which has a small volume than IQ phantom. Thus, a smaller attenuation is expected resulting in a higher counting efficiency.
Changes in the value of ACmean were low (%SD = 2.6%) considering all images acquired in this
two year period. However, the “coldest spots” (ACmin) on the images were up to 35% lower than the
mean value (Image 14). This variation was higher for the “hottest spots” (ACmax): up to 48% higher
than the mean value (Image 8). Thus, care must take when measuring the activity in very small structures/volumes, with a feel voxels. In addition to the partial volume effect problem, variations induced by hot or cold spots can increase uncertainties in small volume measurements.
The main parameter to evaluate the uniformity, the percentage image roughness (%IR), was calculated. The %IR range considering all images in the period of two years was 6.6 % to 10.3 %. The mean %IR calculated considering the images in this two year period was 8 ± 1 %. Literature reports a %IR of 7.0 % for a scanner of the TriumphTM platform in a superior model (LabPET 8)
[15]. This value is within the range found in our work, but is lower than our mean value. Nevertheless, it must kept in mind that literature value [15] was based only in one study of the scanner performance while this work performed 17 studies during two years. In that way, it is possible to conclude that the results are in accordance with literature reported values for a similar equipment. Other two studies [2, 16] compared imaging performance of different small animal PET scanners. In both studies, the scanner LabPET SOLO 4 was not considered. In one study, with eleven different scanners, %IR values ranged from 4.5 % to 15.4 % [12]. In the other study, with
four scanners, %IR was around
8 % to 9 % [2].
Spill-Over Ratios (SOR) tests:
The SOR tests were completed for all 17 images. Figure 3A presents an axial view of the IQ phantom, in the region of the two cold chambers. In this figure, the line profile of the PET signal intensity is showed. This line profile indicates more activity in the air cold chamber compared to the water cold chamber. This finding is in agree with the pattern presented in a multicenter small animal PET study [2]. Figure 3B presents results of Spill-Over Ratio tests. During the period, water spill-over-ratios ranges from 0.15 to 0.22 while air spill-over-ratios ranges from 0.25 to 0.33. Mean values considering the two-year period were 0.18 ± 0.02 for SOR in water and 0.28 ± 0.02 for SOR in air.
Figure 3: Spill Over Tests: A) Axial view of the IQ phantom in the region of the two cold chambers
and line profile analysis of the PET signal intensity across the two cold chamber. B) Spill-over-ratios in water and in air for all the 17 images evaluated.
Goertzen et al. [16] presented SOR in water and in air for eleven different small animal PET scanners.Of these eleven, four small animal PET scanners did not presented attenuation and scatter correction, like the LabPET 4 tested in our work. SOR values in water and in air ranging from (0.09 to 0.27) and (0.09 to 0.37) respectively were reported within this equipment group [16]. Our results are in agreement with these ranges. It is important to notify that in the group of equipments that possess attenuation and scatter correction, SOR values in water and in air were much lower, ranging
A)
from (-0.01 to 0.13) and (0.01 to 0.15) respectively [16]. This fact highlights the importance of these corrections to improve the image quality.
Recovery Coefficient (RC) tests:
The recovery coefficients were evaluated in each image for all rods (1 to 5 mm diameter). The range of the RC were (0.10 to 0.14), (0.37 to 0.57), (0.68 to 0.90), (0.77 to 0.97) and (0.79 to 1.04) for the rods with 1 mm, 2 mm, 3 mm, 4 mm and 5 mm, respectively. The mean values and the standard deviation of the recovery coefficients for all five rods in the two-year period of investigation are presented in Figure 4.
Figure 4: Mean values of the Recovery Coefficients in the period March/2017 to March/2019.
The mean recovery coefficients calculated in this study were lower than the value presented by Goertzen et al. [16] for the LabPET 8: 0.19, 0.78, 0.97, 1.00 and 1.02 for the rods with 1 mm, 2 mm, 3 mm, 4 mm and 5 mm, respectively. These differences were expected since LabPET 8 axial FOV is twice the size of LabPET 4 axial FOV and a 3D reconstruction algorithm was used in image reconstruction in both studies [16]. The mean recovery coefficients obtained for LabPET 4 in this work are within the range of commercial small animal PETs evaluated in Literature [2, 16].
0.11 ± 0.01
0.48 ± 0.05
0.77 ± 0.07 0.86 ± 0.06
The acknowledgement of the image quality parameters is an important step for ensure the reproducibility of preclinical image studies. To date, long-term studies of uniformity, spill-over-ratio and recovery coefficients of a small animal PET scanner are unknown. Our two year evaluation of LabPET SOLO 4 scanner show that activity concentration measurements in the phantom could be very stable (2.6 %SD). That is very important parameter for image quantification. Recovery coefficients, SOR (air and water), and %IR show higher variation in time (6 – 12 %SD, 8 – 12 % SD and 12 %SD, respectively). These parameters affect image quantification and visualization of small structures and low/high uptake interfaces. These results show that in spite of a relatively stability in image quality parameters, they vary in time. Therefore, it is important to know the range of variation of each specific equipment, especially when comparing image quantification studies from different equipment in different preclinical image centers.
Our results also suggests that measurements of image quality parameters for small animal PET scanner based on a single image section should be considered with caution, especially when a manufacturer is disclosing their equipment features. Results from a long-term evaluation are desirable in this case.
4. CONCLUSION
Imaging performance of LabPET SOLO 4 scanner was studied during two years. All parameters (uniformity, spill-over ratio and recovery coefficients) presented results compatible with values reported by other authors [2, 12, 16] on the basis of the National Electrical Manufactures Association (NEMA) NU 4/2008 standards [4]. In this way, despite a decade of use, the small animal PET scanner of CDTN/CNEN generates images with adequate quality to preclinical studies.
The results reveals a good stability in the scanner performance, specially the activity concentration measurements, which is a very important parameter for image quantification. Other parameters such as the recovery coefficient. %IR and SOR show a higher degree of variability. That means that, for our equipment, we should be concerned when quantifying small structures and adjacent high/low uptake regions. That kind of information is important and justifies long-term studies for better acknowledgment of and individual equipment of a preclinical image center or
when acquiring a new equipment. In this last case, the buyer institution should ask the manufacturer about long-term behavior of the equipment.
ACKNOWLEDGMENT
We thank the CDTN / CNEN, FAPEMIG and CNPq for the funding.
REFERENCES
[1] YAO R.; LECOMTE R.; CRAWFORD E. Small-Animal PET: What is it, and why do we need it? Journal of Nuclear Medicine Technology. 2011. v.40 nº3, p.157-165.
[2] MANNHEIM JG et al., Reproducibility and comparability of preclinical PET imaging data: A multi-center small animal PET study Journal of Nuclear Medicine. Published on March 8,
2019 as doi:10.2967/jnumed.118.221994.
[3] BAO et al., Performance evaluation of the Inveon dedicated PET preclinical tomograph based on the NEMA NU-4 standards. Journal of Nuclear Medicine. 2009. 50:401-408.
[4] NEMA - National Electrical Manufacturers Association. Performance Measurements of SmallAnimal Positron Emission Tomographs. Rosslyn VA; 2008 Standards Publication NU
4-2008.
[5] NEMA - National Electrical Manufacturers Association. Performance Measurements of Positron Emission Tomographs (PETS). Rosslyn VA; Standards Publication NU 2-1994.
[6] NEMA - National Electrical Manufacturers Association. Performance Measurements of Positron Emission Tomographs (PETS). Rosslyn VA; Standards Publication NU 2-2001.
[7] NEMA - National Electrical Manufacturers Association. Performance Measurements of Positron Emission Tomographs (PETS). Rosslyn VA; Standards Publication NU 2-2007.
[8] NEMA - National Electrical Manufacturers Association. Performance Measurements of Positron Emission Tomographs (PETS). Rosslyn VA; Standards Publication NU 2-2018.
[9] GE Healthcare Technologies. Triumph Service Guide Technical Publication. Revision Draft
6, Copyright. Available at: <http://www.gehealthcare.com>. 2011.
[10] TRETRAULT M. A., et al. System architecture of the LabPET small animal PET scanner.
IEEE Transactions on Nuclear Science, 2008. v.55, p. 2546-2550.
[11] FONTAINE R., et al. The hardware and signal processing architecture of LabPETTM, a small
animal APD-based digital PET scanner. IEEE Transactions on Nuclear Science, February 2009. v. 56, p. 3-9.
[12] Gamma Medica-Ideas, User Manual: Positron Emission Tomography (PET) Scanner Software - Manual for Acquisition and Processing of PET Images from the LABPET System.
Software version: LABPET 1.12.0, (2010).
[13] BELCARI, N. et al. NEMA NU-4 Performance Evaluation of the IRIS PET/CT Preclincial Scanner. IEEE Transactions on Nuclear Science, 2017. v.1, n.4, p. 301-309.
[14] PMOD Tecnologies LCC, PMOD v.3.7. User Manual, (2015).
[15] PRASAD, R., RATIB, O., ZAID, H., NEMA NU-04-based performance characteristics of the LabPET-8TM small animal PET scanner, Phys Med Biol. 2011, 56(20):6649-6664.
[16] GOERTZEN et al. NEMA NU 4-2008 Comparison of Preclinical PET Imaging Systems. 2012, JNM, v. 56, p. 1300-1309.