BRAZIL: AN APPLICATION OF PORTER’S DIAMOND AND
ATTRACTIVENESS ANALYSIS FOR FRENCH FDI
Renata Rondon Cunha
Project submitted as partial requirement for the conferral of Master in International Management
Supervisor:
Álvaro Augusto Rosa, Assistant Professor, ISCTE Business School, ISCTE- IUL
BR
A
Z
IL
: A
N
A
P
P
L
IC
A
T
ION
OF
P
O
R
TE
R
’S
D
IA
M
O
N
D
A
N
D
AT
T
R
AC
T
IVE
N
E
S
S
ANA
L
Y
S
IS
FO
R
FR
E
N
C
H
FD
I
R
en
at
a
R
on
don
C
u
nh
a
Resumo
A atratividade de um país é medida pelo retorno de custo de capital, que deve ser maior ou igual ao obtido em outro negócio e com um nível aceitável de risco de operação a seus funcionários e acionistas. Para tal avaliação, as oportunidades de mercado e riscos do país são balanceados e comparados a outros países de características similares.
A estagnação da economia europeia tem gerado entre os países europeus a necessidade de expandir seus horizontes à outras partes do globo onde a economia é mais dinâmica e propícia a resultados positivos.
França é o país escolhido como um investigador de novos mercados. Empresas francesas beneficiam-se consideravelmente de investimentos no Brasil, não somente pelo seu crescimento e economia estável, mas também pela poderosa influência em toda a América Latina. O Brasil pode ser a porta de entrada para investimentos franceses nesta região.
Esta dissertação parte da teoria de atratividade e do Diamante de Michael E. Porter para analisar as indústrias e setores em que o Brasil possui vantagem competitiva. Cada atributo do diamante é analisado para evidenciar tal competitividade. Deste modo, algumas qualidades que pareçam fraqueza, podem ser consideradas como oportunidade para investimentos em termos de competitividade mundial.
O estudo feito analisa os dados através de fatos correntes e atual situação econômica do mercado brasileiro, em busca dos pontos economicamente atrativos como país alvo de investimento estrangeiro direto (IED) francês.
Finalmente, os resultados desta pesquisa reveem o uso do Diamante Nacional para a atratividade do país.
Palavras-chave: Diamante de Porter, atratividade de um país, França e Brasil, relação
econômica
Abstract
The attractiveness of a country is measured by the return of the cost of capital that has to be equal or higher than those made elsewhere and holding an acceptable operational risk to the investor’s employees and shareholders. In order to reach this assessment it is necessary to weigh and compare the markets’ opportunities as well as the country risks with other similar countries.
The stagnation of the European economy has generated amongst the European countries the need to expand their horizons to other parts of the globe where the economy is more dynamic and favourable to positive results.
France is the chosen country as a seeker for new markets. French companies benefit largely from investing in Brazil not only because of its growing and steady economy but also by the powerful influence in all Latin America.
This dissertation is based upon the attractiveness theory and of Michael E. Porter’s Diamond designed to analyse the industries and sectors in which Brazil has competitive advantage. Each attribute of the diamond is studied to explain such competitiveness. Thus, some qualities that may be seen as a weakness can be considered an opportunity of investment in terms of world-wide competitiveness.
This study analyses data through the lens of current facts and economic situation of Brazilian market revealing its economically attractive points as a target country for French foreign direct investment (FDI).
In conclusion, the findings of the research revise the use of the National Diamond analysis on country’s attractiveness for investment.
Keywords: Porter’s Diamond, country attractiveness, France and Brazil, economic relation JEL Classification System: F23 and O54
Executive Summary
Em tempos de crise econômica europeia, mesmo os países mais estáveis e com economia forte buscam meios de sobreviver e manter a economia favorável. Ao mesmo tempo, os países em ascendência aproveitam a oportunidade para impor-se em termos mundiais e conquistar o seu espaço.
Esta dissertação busca através da ferramenta teórica do Diamante de Michael E. Porter, analisar a vantagem competitiva do Brasil e sua atratividade para outros países.
Como alvo de investimento, o Brasil é o país escolhido para este estudo por ser o “B” dos BRIC e pela atual exposição mundial. Muito falado atualmente mas ainda visto com ressalvas, este país tem se mantido entre os maiores em termos de PIB e está em busca de infraestrutura, tecnologia e educação de países desenvolvidos.
Como investidor, o país escolhido é a França. Um importante país europeu que deve buscar parceiros para manter seu desenvolvimento e crescimento positivo.
Os dois países em questão possuem boas relações políticas e econômicas, vários investimentos e parcerias bilaterais, inclusive estratégicas.
Este estudo visa enfatizar, com auxílio da ferramenta teórica escolhida, as características das indústrias e setores brasileiros, bem como possiblidades de investimento pelas empresas francesas, através de exemplos práticos de atividades com capacidade de absorção de novos negócios.
Acknowledgements
I would like to thank Professor Álvaro Rosa for his guidance and encouragement as my supervisor throughout this dissertation writing.
I also thank my friend Maria Teresa Lobato Cardoso for her assistance and advise.
Special thanks to Jorge Yuri de Lion Yamane, my husband, his support, patience and love make everything possible.
Finally, I would like to thank my parents, Marcia and Carlos, and family for all their support, faith and understanding.
Contents
1 Introduction ... XV
2 Brazil ... 16
2.1 Demography and geography ... 16
2.1.1 Region’s features ... 17
2.2 Politics ... 19
2.3 Economy ... 20
2.3.1 Brazilian Clusters ... 24
3 Literature review ... 29
3.1 Diamond of National Advantage ... 31
3.1.1 Industries classification ... 34
3.1.2 The patterns of Brazil competitive advantage ... 34
3.1.3 Factor Conditions ... 41
3.1.4 Demand Conditions ... 44
3.1.5 Related and Supporting Industries ... 45
3.1.6 Firm Strategy, Structure and Rivalry ... 47
3.2 Synthesis of Porter’s Diamond Analysis ... 48
4 An overview of France business prospect ... 50
4.1 Demography, geography and politic ... 50
4.2 Economy ... 50
4.3.1 Presence in Brazil ... 52
4.3.2 Investment opportunities in Brazil ... 55
4.3.3 Joint declaration between the governments ... 57
5 Conclusion ... 59
6 Bibliography ... 62
7 Appendix ... 71
7.1 Estimative of Brazilian resident population in 01/07/2010 (IBGE, Estimativas de população, 2013) ... 71
7.2 Cluster of Internationally Competitive Brazil Industries, 2010, elaborated by the author (International Trade Centre, Products, 2010), (International Trade Centre, Services, 2010) . 72 7.3 The Global Competitiveness Report 2013-2014 (World Economic Forum, 2013) ... 76
List of figures
Figure 1: Map of Brazil, with division of Regions and States (adapted from IBGE, Mapas) . 18
Figure 2: Reproduction of The Determinants of National Advantage (Porter, 1990, p. 72) .... 33
Figure 3: Structure of MERCOSUR Common Nomenclature (adapted from MDIC, 1988) ... 34
Figure 4: The Cluster Chart (adapted from Porter, 1990, p. 288) ... 39
Figure 5: Share of Exports of the World and Brazil by Cluster, in 2010 (elaborated by the author) ... 40
List of tables
Table 1: Estimative of population (referring to 2012) for the six most populated cities in Brazil (IBGE, Estimativas de população, 2013) ... 17
Table 2: GDP Ranking of 2010 and 2011 (The World Bank, 2011) ... 21
Table 3: GDP per capita, PPP of 2010 and 2011 (The World Bank, Search, 2011) ... 21
Table 4: Brazilian GDP global and per capita of 2010, by region (Data Source: IBGE, 2012, p. 18) ... 22
Table 5: Percentage of Gross Value Added (GVA) at basic prices, by region in 2010 (IBGE, 2012, pp. 22-23) ... 23
Table 6: Gross Value Added (GVA) at basic prices, by region in 2010 (Data Source: IBGE, Contas Regionais do Brasil, 2012) ... 24
Table 7: Model and sources assessment for Brazil in 2013 ... 30
Table 8: Top Fifty Brazilian’s Industries in Terms of World Export Share, 2010 (elaborated by the author, Data Source: International Trade Centre, Products, 2010) ... 37
Table 9: Brazilian Services in Terms of World Export Share, 2010 (elaborated by the author, Data Source: International Trade Centre, Services, 2010) ... 38
Table 10: Top ten French companies in Brazil (Exame, 2011) ... 52
Table 11: France Trade balance with exports to Brazil (Data Source: International Trade Centre, 2013) ... 52
List of Abbreviations
ANCINE National Cinema Agency (Agência Nacional do Cinema)
BA Bahia State
BRIC Brazil, Russia, India and China
CE Ceará State
DF Federal District (Distrito Federal)
EMBRAER Brazilian Aeronautic Company (Empresa Brasileira de Aeronáutica) FDI (IED) Foreign Direct Investments (Investimento Estrangeiro Direto) GDP (PIB) Gross Domestic Product (Produto Interno Bruto)
GVA Gross Value Added
HS Harmonized System
HDI Human Development Index
IBGE Brazilian Institute of Geography and Statistics (Instituto Brasileiro de Geografia e Estatística)
IMF International Monetary Fund
INSEE National Institute of Statistics and Economic Studies - France
IPEA Applied Economic Research Institute (Instituto de Pesquisa Econômica Aplicada)
i.e. That is (to say); in other words
ITA Institute of Aeronautic Technology (Instituto Tecnológico de Aeronáutica) MDIC Ministry of Development, Industry and Foreign Trade (Ministério do
Desenvolvimento, Indústria e Comércio Exterior) MERCOSUR
(MERCOSUL)
Common Market of South (Mercado Comum do Sul)
MG Minas Gerais State
NCM MERCOSUR Common Nomenclature (Nomenclatura Comum do Mercosul)
PESTEL Political, Economic, Social, Technological, Environmental and Legal
PPP Purchasing-Power-Parity
R$ Brazilian currency: Real
RJ Rio de Janeiro State
SP São Paulo State
SWOT Strengths, Weaknesses, Opportunities and Threats
UN United Nations
UNESCO United Nations Educational, Scientific and Cultural Organization
1 Introduction
The main objective of this paper is to provide a study on country’s attractiveness, specifically, Brazil, under the theoretical framework of Michael E. Porter’s Diamond theory in a French perspective of internationalization strategy.
The analysis of the four determinants of the National Diamond theory helps to perceive which are the industries and clusters in the target country that represents an international competitive advantage. This paper emphasizes the relevance of Brazilian’s competitive advantage and attractiveness.
Brazil as a BRIC has a significant participation in the world’s economy and the visibility it generates attracts the attention of other countries.
France is the chosen country analysed as a potential investor in Brazil.
In the context of World Trade Organization, these two nations have different characteristics in socio-economic aspects and the bilateral relationship can help them complete the missing points and balance their needs.
The choice of two countries in different continents with many dissimilarity was made to prove a point of observation that a country considered “developing” (World Trade Organization, 2013), and other considered in common practice “developed” (United Nations Statistics, 2003) are striving in the same world economy and in the same level of offers.
The economic connections can be called as “bilateral relationship”. Little & Marandi (2003) define the bilateral relationship as “those with a high level of both action and belief components. The relationship is important to both parties economically, and considerable trust and commitment to long-term development of the relationship exists on both sides”.
The treaty signed by the presidents of France and Brazil in the meeting that took place in the end of 2012, and its agreements and contracts under way will be analysed.
2 Brazil
This chapter will give a panoramic view of the fundamental characteristics of Brazil such as demography, economy and politics, with special emphasis in the current economic situation of the country.
The history of Brazil started to be written in 1500, when the Portuguese navigators landed on its shores. Because of its immense vastness of resources and the amenity of the climate, people from all over the world migrated to Brazil in search for a better life, contributing thus far to the rich melting pot that is the Brazilian culture.
The official language of Brazil is Portuguese.
The data source for many of the referential information about Brazil is from IBGE and the reports are presented in its local currency: Brazilian Real (R$).
Most part of referential data in this paper is from the year of 2010. Since the Brazilian Real has currency exchange variations, the U.S. Dollar will be used as common currency to avoid misunderstandings and comparison of different currencies.
The conversion rate was defined as the result of the division of Brazilian’s GDP of 2010 (IBGE, 2012, p. 18) in U.S. Dollar by Brazilian’s GDP of the same year (The World Bank, 2011) in Brazilian Real:
2143035000000
3770085000000 = 0,5684
The rate used to exchange Brazilian Real into U.S. Dollar is 0,5684.
2.1 Demography and geography
The population of Brazil according to the census of 2010 (IBGE, Brasil em síntese, 2013) reached the number of 190.755.799 people. The total area of Brazil is 8,515,767.049 km² (IBGE, Sala de Imprensa, 2012).
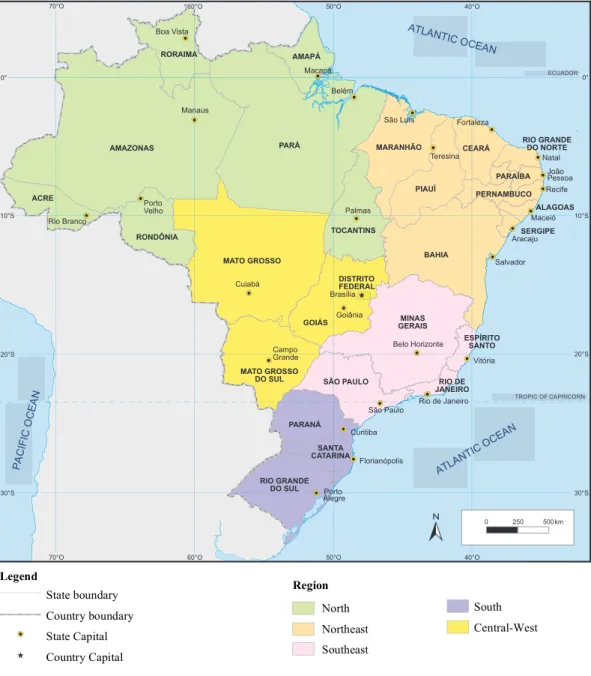
The country is divided in five macro regions: North, Northeast, Central-West, Southeast and South. Each macro region is composed by states with a governor. Brazil has a total of twenty-six states and the Federal District, where Brasília, the capital of the country is located.
The most populated cities are São Paulo, Rio de Janeiro, Salvador, Brasília, Fortaleza and Belo Horizonte.
City State Region Population
São Paulo SP Southeast 11 376 685
Rio de Janeiro RJ Southeast 6 390 290
Salvador BA Northeast 2 710 968
Brasília DF Central-West 2 648 532
Fortaleza CE Northeast 2 500 194
Belo Horizonte MG Southeast 2 395 785
Table 1: Estimative of population (referring to 2012) for the six most populated cities in Brazil (IBGE, Estimativas de população, 2013)
2.1.1 Region’s features
To organize its statistics programme, in 1945, Brazil was divided in five macro regions. The regions were grouped in a historic and geographic perspective. The divisions are relevant to facilitate public policies and decisions regarding the economic location, social and tributary activities, planning, surveys and identification of space structures in urban and rural agglomerations.
The distribution of regions is as follows (Imprensa Nacional Brasileira, 2013, p. 48):
The North region (in Portuguese: Região Norte) is composed by seven States: Rondônia, Acre, Amazonas, Roraima, Pará, Amapá and Tocantins.
The Northeast (in Portuguese: Nordeste) region is composed by nine States: Maranhão, Piauí, Ceará, Rio Grande do Norte, Paraíba, Pernambuco, Alagoas, Sergipe and Bahia.
The Southeast region (in Portuguese: Região Sudeste) is composed by four States: Minas Gerais, Espírito Santo, Rio de Janeiro and São Paulo.
The Central-West region (in Portuguese: Região Centro-Oeste) is composed by three States and the Federal District (Brasília): Mato Grosso do Sul, Mato Grosso and Goiás.
Figure 1: Map of Brazil, with division of Regions and States (adapted from IBGE, Mapas)
Region North Northeast Southeast South Central-West State boundary Country boundary State Capital Country Capital Legend PA CIF IC O CEA N ATLA NTIC OCEA N ATLANTIC OCEA N ECUADOR TROPIC OF CAPRICORN
2.2 Politics
The political structure of a country can greatly influence its business and the role of the Government is essential for the competitive advantage analysis. This section explains the Brazilian structural aspects in politics and the roles of each sphere in the administration system.
Brazil is a Federal Republic formed by the Union, States and Municipalities. It is a Presidential democratic system.
The Union is divided in three independent branches working harmoniously amongst them: the Legislative Power (elaborates the law), the Executive Power (executes programs, laws and provide public services) and the Judicial Power (judges, solves conflicts – it is composed by the courts in different levels: Supreme Federal Court, the Superior Court of Justice and other Superior Courts, the National Justice Council and the Regional Federal Courts) (Portal Brasil, 2009).
The Executive Power for the whole nation is headed by the President. The State level is represented by the Governor and in the Municipality sphere is represented by the Mayor.
The President, Governor and Mayor are elected directly for four years having the possibility of only one re-election in a consecutive term.
The voting system is compulsory for citizens from 18 to 70 years old and it is optional for citizens from 16 to 18 and older than 70 years old (Presidência da República, 1988).
The fundamental objectives of the Union sphere of action are: the construction of a free, fair and solidary society; the guarantee of national development; the eradication of poverty and marginalization, the reduction of social and regional differences and the promotion of the nations’ welfare regardless origin, race, sex, colour, age or any other form of discrimination.
The State level of government has the responsibility to provide security, basic sanitation, health, education, culture, tax, and transportation between urban areas.
The Municipality is responsible for education, public transportation and urbanization. Health and local taxes are partial responsibilities of the Municipalities.
The country economy is closely linked to its politics. Each president has a particular style of administration that has an impact on the relationship between private companies and the head government. It means that companies can expect adjustments in each four years, in a normal term of government.
The current Brazilian Government adopts as priority the industrialization, mobility and strategic cooperation in global terms. However, its priorities change according to the needs of the nation.
2.3 Economy
This section will give an overview of Brazilian’s economic profile with the main clusters and activities relevant to the country.
Brazil is the largest economy in Latin America (BBC, 2012). It is also a member of the economic block MERCOSUR1 and one of its founders. Furthermore, Brazil with Russia, India and China form the grouping acronym BRIC, the emerging economies.
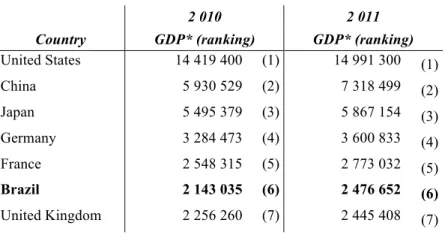
According to The World Bank, Brazil represented the 6th country in the GDP ranking of 2011,
with a GDP of 2.476.652 million US dollars.
In terms of GDP based on purchasing-power-parity (PPP) per capita, which is “the rate at which the currency of one country would have to be converted into that of another to purchase the same amount of goods and services in each country” (Callen, 2012), Brazil had 11.769,41 US dollars per capita.
The GDP does not indicate the real level of economic development of a country, but it is still a measure to compare how much the countries’ economy is moving. The GDP based on PPP per capita helps us to approach the purchasing power considering the same currency for the countries.
1 MERCOSUR means “Common Market of South” and the countries members are Argentina, Brazil, Paraguay,
Uruguay, Venezuela and Bolivia (this last is in process of admission). Source: MERCOSUR, retrieved 03 10, 2013: http://www.mercosur.int/t_generic.jsp?contentid=4002&site=1&channel=secretaria&seccion=3
2 010 2 011
Country GDP* (ranking) GDP* (ranking)
United States 14 419 400 (1) 14 991 300 (1) China 5 930 529 (2) 7 318 499 (2) Japan 5 495 379 (3) 5 867 154 (3) Germany 3 284 473 (4) 3 600 833 (4) France 2 548 315 (5) 2 773 032 (5) Brazil 2 143 035 (6) 2 476 652 (6) United Kingdom 2 256 260 (7) 2 445 408 (7)
* (in millions of US dollars)
Table 2: GDP Ranking of 2010 and 2011 (The World Bank, 2011)
2 010 2 011 Country GDP pc, PPP* (ranking) GDP pc, PPP* (ranking) Luxembourg 84 763,73 (1) 88 780,62 (1) Qatar 77 868,48 (2) 86 506,64 (2) Macao SAR, China 65 279,42 (3) 79 480,09 (3) Singapore 58 061,51 (4) 61 069,58 (4) Norway 57 451,52 (5) 61 046,19 (5) France 34 275,76 (24) 35 365,70 (25) Brazil 11 186,67 (73) 11 634,05 (73) * (in US dollars)
Table 3: GDP per capita, PPP of 2010 and 2011 (The World Bank, Search, 2011)
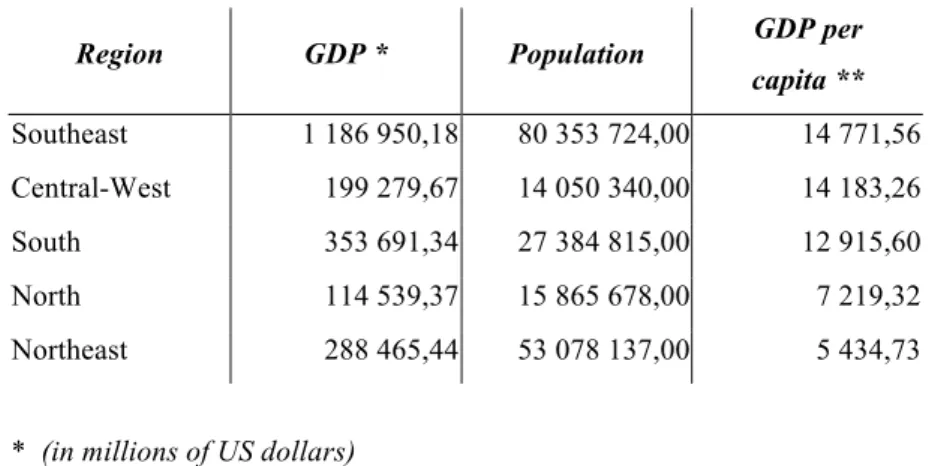
The Brazilian GDP of 2010 showed that it is concentrated in the Southeast region (more than 50%) as well as the population (42%).
Region GDP * Population GDP per capita ** Southeast 1 186 950,18 80 353 724,00 14 771,56 Central-West 199 279,67 14 050 340,00 14 183,26 South 353 691,34 27 384 815,00 12 915,60 North 114 539,37 15 865 678,00 7 219,32 Northeast 288 465,44 53 078 137,00 5 434,73
* (in millions of US dollars) ** (in US dollars)
Table 4: Brazilian GDP global and per capita of 2010, by region (Data Source: IBGE, 2012, p. 18)
The participation of activities in the GDP is measured by the Gross Value Added (GVA) at basic prices. It is the output at basic prices minus intermediate consumption at purchaser prices. The basic price is the amount receivable by the producer from the purchaser for a unit of a product minus any tax on the product plus any subsidy on the product.
North Northeast Southeast South Central-West Total Ac ti vi ti es * Agriculture 10,0% 17,1% 29,9% 25,5% 17,4% 100% Extractives Industry 18,5% 7,4% 71,1% 1,4% 1,6% 100% Transformation Industry 4,8% 9,3% 60,3% 21,0% 4,7% 100% Construction 7,1% 17,5% 50,6% 15,3% 9,4% 100% Production and distribution of facilities (1) 5,1% 20,1% 47,7% 20,0% 7,1% 100% Commerce 4,8% 15,9% 51,4% 19,5% 8,4% 100% Transport, storage and mail 4,0% 11,8% 59,4% 18,0% 6,9% 100% Information Services 2,5% 8,3% 69,9% 12,0% 7,4% 100% Finances (2) 1,9% 8,3% 66,9% 13,9% 9,0% 100%
Real estate activities
and rent 5,0% 13,6% 57,1% 15,9% 8,5% 100%
Management, Health, Education and Social Security
7,7% 19,8% 40,1% 13,4% 19,1% 100%
Other services 3,2% 12,6% 62,1% 15,0% 7,1% 100%
Total 5,5% 13,8% 54,4% 16,6% 9,6% 100%
(1) Electricity, gas, water, sewage and public cleaning
(2) Financial intermediation, insurance and pension funds and services
Table 5: Percentage of Gross Value Added (GVA) at basic prices, by region in 2010 (IBGE, 2012, pp. 22-23)
The activities that most impacted the GDP of 2010 were the transformation industry and public administration, health, education and social security (each one represents 16,2% of the GVA in the GDP), followed by other services (14,3%) and commerce (12,5%).
North Northeast Southeast South Central-West Total Ac ti vi ti es ** Agriculture 9 718,13 16 686,08 29 110,23 24 811,76 16 971,03 97 297,23 Extractives Industry 10 074,87 4 058,05 38 739,42 779,90 849,15 54 501,38 Transformation Industry 14 181,93 27 700,84 179 380,70 62 396,17 13 963,87 297 623,51 Construction 7 397,50 18 139,10 52 514,03 15 919,06 9 750,47 103 720,16 Production and distribution of facilities (1) 3 023,57 11 852,53 28 185,20 11 807,92 4 172,13 59 041,34 Commerce 11 045,34 36 446,62 118 031,57 44 794,35 19 319,79 229 637,67 Transport, storage and mail 3 673,02 10 836,69 54 668,24 16 540,49 6 326,06 92 044,50 Information Services 1 486,20 4 907,51 41 290,61 7 067,56 4 348,68 59 100,56 Finances (2) 2 635,38 11 454,42 92 206,86 19 145,32 12 343,83 137 785,82 Real estate
activities and rent 7 141,24 19 580,10 82 014,63 22 804,10 12 164,48 143 704,56 Management, Health, Education and Social Security 22 939,10 58 710,47 119 029,76 39 739,44 56 727,55 297 146,32 Other services 8 350,40 33 169,63 163 209,39 39 384,32 18 612,70 262 726,45 Total 101 666,69 253 542,04 998 380,62 305 190,40 175 549,74 1 834 329,49
* (in millions of US dollars)
(1) Electricity, gas, water, sewage and public cleaning
(2) Financial intermediation, insurance and pension funds and services
Table 6: Gross Value Added (GVA) at basic prices, by region in 2010 (Data Source: IBGE, Contas Regionais do Brasil, 2012)
Brazil has a vast diversity of activities and it varies according to the natural resources, geographic position, local needs and tax incentives by the States.
2.3.1 Brazilian Clusters
In this part some important clusters in each region of this country will be explored.
A cluster is a geographic proximate group of interconnected companies, service providers and associated institutions in a particular field (Porter, 2000, p. 15).
In general the clusters are the results of business-government collaboration. The local governments offer tax exemptions, infrastructure (for transportation, electricity, telecommunication) and local support (schools, public services, hospitals). Clusters develop
the cities and surrounding areas, attract qualified workforce, create a mutually support among the group of industries and encourages a pro-competitive behaviour.
Under mentioned is an overview of some important clusters and activities by region:
2.3.1.1 North Region:
Zona Franca de Manaus (Free Zone of Manaus) is a model of economic development,
implemented by Brazilian government with the main goal to facilitate an economic basis in the Western Amazonia in order to promote a better productive and social integration in this region. The States belonging to it are Acre, Amazonas, Rondônia and Roraima and the cities Macapá and Santana (from Amapá State). Zona Franca de Manaus has three economic clusters: commercial, industrial and agribusiness. The industrial cluster has around 600 high-technology factories and generates more than 500.000 jobs, direct and indirect. The agribusiness’ segment has its activities on food production, agriculture, fisheries, tourism, wood processing and others2.
Serra dos Carajás has the highest quality iron ore in the world. The Company Vale explores
it. It is the biggest metal and mining company in the world. Vale’s mines covers 3% of the Carajás National Forest’s area. The railroads, airport and hydroelectric power station are part of the business to supply its demand3.
2.3.1.2 Northeast Region:
Porto Digital is a partnership among the private, public sectors and universities. Located in
Recife (Pernambuco State), one of the most important cities of Brazil, it was founded in July 2000. This cluster has 200 institutions of information technology and communication, creative technology, specialised services and development agencies. In 2010, these companies achieved a revenue of 568 million US dollars4.
2 Source: SUFRAMA, retrieved 10 26, 2013: http://www.suframa.gov.br/zfm_principal.cfm 3 Source: VALE, retrieved 10 26, 2013: http://www.vale.com
Camaçari Industrial Complex started its operation in 1978. It was the first planned
petrochemical complex in Brazil. Located in Camaçari (Bahia State), is 50 kilometres far from Salvador, the capital of the State. It is composed of over than 90 chemical and petrochemical companies besides the production of cellulose, copper metallurgy, textiles, automobiles, beverages and services. It employs 30.000 people, directly and indirectly. Its total sales are around 15 billion US dollars per year5.
2.3.1.3 Southeast Region:
Resende Industrial Park (Rio de Janeiro State) is located in a strategic area bordering São
Paulo State. This city is an industrial cluster and the main sectors presents are metal-mechanic and chemical-pharmaceutical (Prefeitura de Resende, 2013). The GDP of Resende in 2010 was of 3,6 billion US dollars (IBGE Cidades, 2010).
Campinas Cluster, in Campinas (São Paulo State) located 100 km from São Paulo city. The
cluster has industries in different sectors such as automobile, textile, metallurgic, alimentary, petrochemical, pharmaceutical, telecommunications, electronics, information technology, fine chemicals, furniture, ceramic and others. It has a total of 6.478 industries, 14.027 services companies and 19.974 companies. Fifty of the 500 biggest companies in the world are in this area (Cendotec, 2005, p. 01). Campinas is a very important city in the Brazilian context and its GDP in 2010 was 20,8 billion US dollars (IBGE Cidades, 2010).
Embraer is the Brazilian aeronautic company, created in 1969 as a mixed capital company
under government control. In 1994 Embraer was privatized and restructured. This company was founded with the support of Brazilian Government having the purpose to transform science and technology provided by the Institute of Aeronautic Technology (ITA) into engineering and industrial capability6. In 2012, its net income was 348 million US dollars.
5 Source: Camaçari Industrial Development Committee, retrieved 10 26, 2013: http://www.coficpolo.com.br/ 6 Source: EMBRAER, retrieved 10 27, 2013: http://www.embraer.com.br/en-us/conhecaembraer/tradicaohistoria
2.3.1.4 South Region:
Cluster electro-metal-mechanical, in the city of Joinville (Santa Catarina State) concentrates
2.038 industries employing 75.345 people in 2011 (FIESC, 2013, p. 143), in different sectors such as foundry, household appliances, plastic and technology. In 2010, Joinville had a GDP of 10,5 billion US dollars (IBGE Cidades, 2010).
Vale do Rio dos Sinos Footwear cluster, in Rio Grande do Sul State, is the aggregation of
firms of 30 municipalities located around Sinos River. This cluster has the industries to supply the footwear chain: tannery and leather. In 2005, the footwear industry represented 23,5% of total employment in Rio Grande do Sul State (Costa, 2010, p. 162). The total of related industries are 1.745 of footwear industry and 675 of diverse industries as rubber, tobacco, leather and fur. The GDP in 2010 of Vale do Rio dos Sinos’ region was of 21,4 billion US dollars (ACI, 2013).
2.3.1.5 Central-West Region:
Nova Mutum, in Mato Grosso do Sul State, is a municipality whose main activities are in the
primary sector of the economy (Prefeitura de Nova Mutum - MT, 2013). Its economic activities are: soya, corn, cotton, aviculture, cattle, swine, familiar agriculture, apiculture, milk production and viniculture. This is the third municipality of Brazil with a better human development index (HDI) and reference in tourism destination because of its sustainable technology in the agribusiness (Agronotícias, 2013).
Anápolis, in Goiás State, is an important agro-industrial cluster with 100 companies and a
pharmaceutical cluster with 15 firms of medium and large scale7.
All the Brazilian regions have clusters. Some are focused in the agribusiness, as Centre-Western, others with a mix of industries and activities. In general the cities that are the capital of State have large concentration of people, commerce and industries. The old model of clusters in Brazil was to have the industries around the big centres or its axes as São Paulo, Rio de Janeiro and Belo Horizonte. Nowadays, new clusters tend to be created in cities that do not have many industries. The local government offers incentives to develop new areas.
This decentralization may balance the employment and development of Brazilian regions, as well as the improvement of services that come together such as transportation, construction, telecommunication, education and basic sanitation.
3 Literature review
This section will approach the theory of country attractiveness and the model applied in the perspective of Brazil as a competitive advantage nation.
The attractiveness of a country can be measured in many ways. According to Philippe Lassere, a country is considered attractive when there are market and industries opportunities and it is acceptable in terms of risks for the employees and shareholders. These are the two generic points to be used as the logic of attractiveness. If the investor gets a return equal or higher than its risk adjusted weighted cost of capital, then, this country is considered attractive (Lasserre, 2003, pp. 156-157).
It is very difficult to do generalizations, however the country is analyzed in its entirety to give a general perception of its opportunities and risks. To refine the evaluation, the country is compared to another with similar features.
The decision to enter the foreign markets is made after a very diversified analysis, which aims to identify the country’s attractiveness followed by the implementation of the strategies chosen (entry mode, developing paths and organization control).
In the assessment of the country’s attractiveness, many factors have to be considered: size and growth, resources, incentives and risks. In terms of industry, the market and internal competition are important factors for companies interested in FDI.
The market and industry opportunities are measured by the potential demand and how easy it is to compete in the country. Brazil has a high internal demand in growth (also because of the middle-class effect), large availability of raw materials, innovation culture and investments incentives granted by the government.
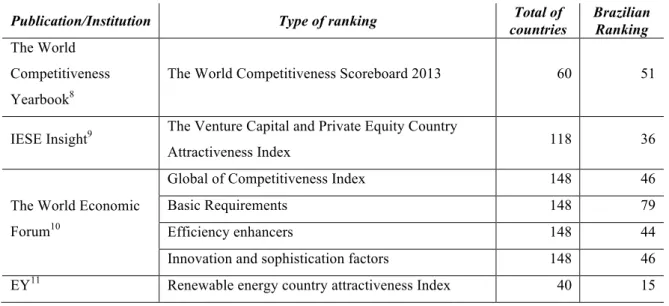
The risks of a country affect differently the distinct market segments. There are many models and sources of countries’ assessment that compare the risks of countries. Below is a list of various rankings, showing the position of Brazil:
Publication/Institution Type of ranking Total of countries Brazilian Ranking The World Competitiveness Yearbook8
The World Competitiveness Scoreboard 2013 60 51
IESE Insight9 The Venture Capital and Private Equity Country
Attractiveness Index 118 36
The World Economic Forum10
Global of Competitiveness Index 148 46
Basic Requirements 148 79
Efficiency enhancers 148 44
Innovation and sophistication factors 148 46 EY11 Renewable energy country attractiveness Index 40 15
Table 7: Model and sources assessment for Brazil in 2013
Looking inside these rankings, the most important risks identified in Brazil are tax regulations and rates, corruption, supply of infrastructure and inefficient government bureaucracy.
Many theories and studies could be used and combined to help the decision of FDI, being the most common used the PESTEL, Porter’s five-forces framework, SWOT, Hofstede model, rankings and financial indicators analysis.
The focus of this paper is in the initial part of the decision-making process, i.e.: the analysis of attractiveness.
The theoretical framework chosen to be studied in this paper is the “Determinants of National Advantage”; also known as “National Diamond” or “Diamond of National Advantage”.
8 Source: The World Competitiveness Center (WCC), retrieved 10 01, 2013: http://www.imd.org/wcc
9 Alexander Groh, Heinrich Liechtenstein and Karsten Liese. The project was initiated at IESE Business School
Barcelona in 2006 with a European pilot study. From the European study we gained experience and the confidence to extend the study globally. Source: retrieved10 02, 2013, http://blog.iese.edu/vcpeindex/ranking-2013/
10 Source: The Global Competitiveness Report 2013-2014, retrieved 09 28, 2013:
http://www.weforum.org/reports/global-competitiveness-report-2013-2014
11Source: EY, RECAI August 2013, retrieved 09 28, 2013: http://www.ey.com/Publication/vwLUAssets/Rene
3.1 Diamond of National Advantage
The book “The Competitive Advantage of Nations” published in the 90s by Michael E. Porter opened a new view about the advantages of the countries. All the knowledge of previous studies and publications in the scope of companies has been adapted to the nations context.
“The principal goal of a nation is to produce a high and rising standard of living for its citizens.” – Michael E. Porter
Porter has applied his diamond theory in 8 countries (Germany, Italy, Japan, Korea, Sweden, Switzerland, the United Kingdom, and the United States). He also studied Denmark and Singapore that are not detailed in his book. His study was very precise and detailed and the most data collected are from the 70s.
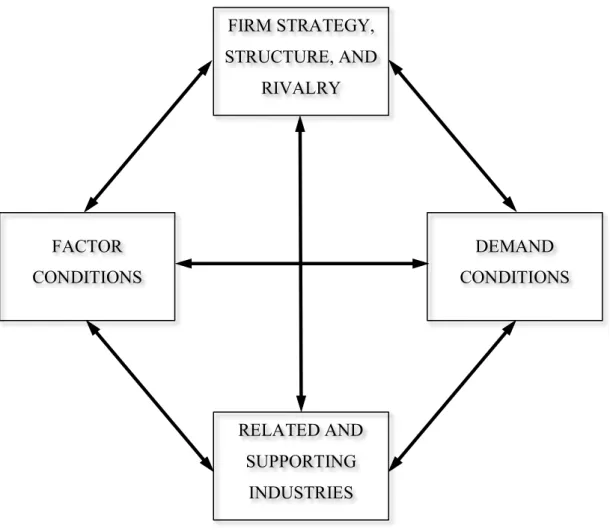
The Diamond of National Advantage consists of four attributes that analysed individually or as a system are determinant to understand the advantage of a nation and identify how each nation establishes the playing field and operations on its industries.
Inside the nation it is important to exist competition amongst the industries. To be competitive and reach better results the industries will invest in researches and development, and as a consequence a high level of services and/or products are ensured giving the nation more advantage to stay competitive.
The attributes of the diamond help to understand the strengths and weakness of the nation in a determined region or industry. The attributes determined by Porter are the following: factor conditions, demand conditions, related and supporting industries and firm strategy. The government’s policies and chance are also contributing factors that have an impact in all the determinants of the diamond and they can be decisive for the success or not of the system.
The factors “Government” and “Chance” were considered later on in Porter’s analysis. The Government is a relevant factor and will be considered and explored in this paper while the factor chance will not be deeper considered once it is intangible and an unpredictable situation.
The Government plays an essential role of providing the right conditions and encouragement to the industries for the achievement of higher levels of competitive performance. It is
responsible for taking decisions in terms of legislations, internal procedures of commerce, monetary control (adapt the volume of means of payment to the real needs of the National economy, regulates the internal value of currency (Banco Central do Brasil, 1964, pp. 01-02)) and treaties with other countries or economical blocks that can be decisive for the internal industries.
Following is a brief explanation of the four attributes referred by Porter (The Competitive Advantage of Nations, 1990, pp. 73-110):
Factor Conditions are the aspects in terms of production such as infrastructure and specialized human resources. The factor conditions are in general created by the nations and not by the natural environment. The presence of raw material, for example, plays an important role in the competitive advantage of industries in the nation, but Porter defends that the factors conditions goes beyond it. If a nation is not endowed with natural resources, it can be found in other countries. It is not a problem that cannot be overcome.
Demand conditions are the demands of the internal market in terms of products and services. The home’s demand shapes the form of how the firms receive, interpret and responds to buyers’ needs.
Related and supporting industries refer to the existence or absence of suppliers and related industries internationally competitive.
Firm strategy, structure and rivalry are the national tendencies of how the companies are created, organized and managed in the country and how the intern rivalry is played.
Figure 2: Reproduction of The Determinants of National Advantage (Porter, 1990, p. 72)
In the context of this paper, Brazil is the country to have its attributes reviewed. In this section a diamond’s analysis will be described in relation to this nation.
As explained before, Brazil has the characteristic of a country continent because of its dimension, different cultural and natural aspects. For these reasons, it is very difficult to generalize the country. The strengths and weakness of one region or city can be the opposite of others, even among neighbours, but it is still a single country. This study will exemplify by pointing a region or city, in case a need for a better understanding and analysis if necessary.
FIRM STRATEGY, STRUCTURE, AND RIVALRY RELATED AND SUPPORTING INDUSTRIES FACTOR CONDITIONS DEMAND CONDITIONS
3.1.1 Industries classification
This section aims to explain the classification of goods and merchandises used in this paper. This classification is important to help the identification of the kind of industries that exports the most in Brazil and later will be classified into the cluster chart.
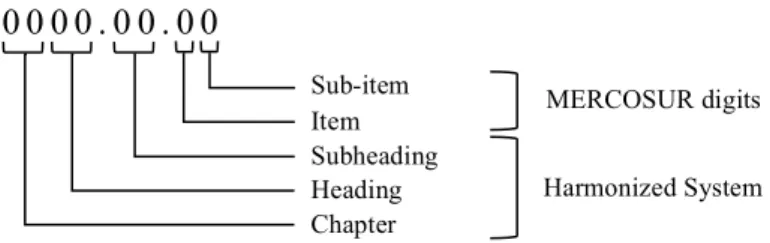
The industries in Brazil (and MERCOSUR) have a classification known as NCM (MERCOSUR Common Nomenclature). The first six digits presented in the code (each two represents: chapter, heading and subheading, respectively) follow the Harmonized System (HS) defined by the World Customs Organization, and the last two digits (item and sub-item), are created under the definition established between the MERCOSUR countries.
Figure 3: Structure of MERCOSUR Common Nomenclature (adapted from MDIC, 1988)
The classification of goods in NCM is governed by the General Rules for the Interpretation of the Harmonized System (MDIC, 2013). For this paper’s purposes, the 4 first digits will be used because they will be enough for further analysis. These digits correspond to the “chapter” and “heading” of the Nomenclature, also identified by “HS4”. For this level of detail, that will be designated as “Industry”.
3.1.2 The patterns of Brazil competitive advantage
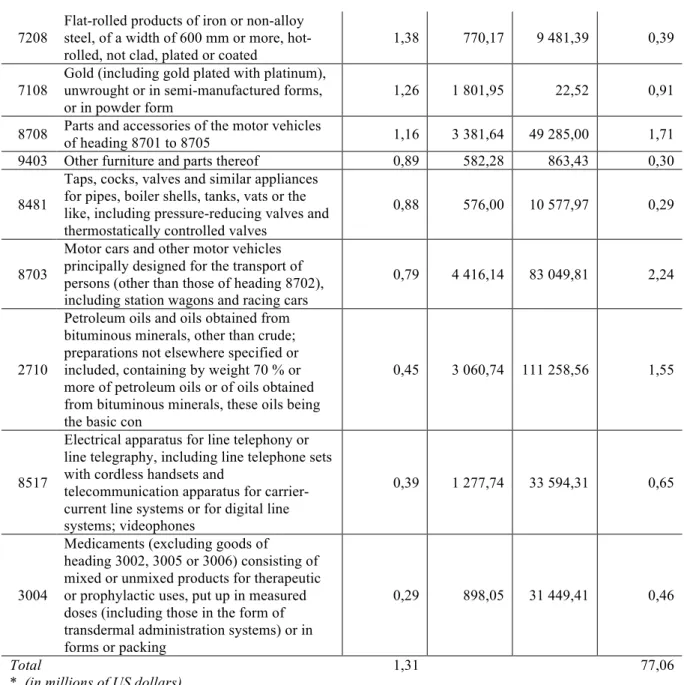
Based on Porter’s studies, the top fifty Brazilian industries will be analysed, in terms of share world exports.
To produce this final table, online tables from the International Trade Centre website were generated for the Brazilian’s exports and World’s imports and exports. The data are from year 2010. To validate the accurate data of those tables for the Brazilian’s imports and exports of the studied year, it was compared with data from Brazilian government (MDIC, 2010).
0 0 0 0 . 0 0 . 0 0 Sub-item Item Subheading Heading Chapter Harmonized System MERCOSUR digits
A difference was found between the sources, an export for the NCM HS4 9998 “Consumption on board (fuels and lubricants for ships and aircraft)”. The Brazilian government accounted 36.955,77 million US dollars, without imports registered for the same industry/period. In the calculations, this export represented 1,87% of the “Share of Total Brazilian Exports”. This item will not be added to the list of top fifty because it is not in the United Nations Statistics and its “chapter” 99 is used for “Commodities not specified according to kind” (UN comtrade, 2007).
Below the top fifty export for the Brazilian industries:
Industry Share of Total World Exports Export Value * Import Value * Share of Total Brazilian Exports
1701 Cane or beet sugar and chemically pure sucrose, in solid form 43,06 12 761,41 3,50 6,47 2601 Iron ores and concentrates, including roasted iron pyrites 27,91 28 911,88 138,01 14,65 1201 Soya beans, whether or not broken 27,76 11 043,00 435,59 5,60 0207 Meat and edible offal, of the poultry of heading No 0105, fresh, chilled or frozen 27,59 5 952,03 30,53 3,02 8307 Flexible tubing of base metal, with or
without fittings 25,91 649,31 665,84 0,33
2401 Unmanufactured tobacco; tobacco refuse 24,98 2 706,67 679,82 1,37 0202 Meat of bovine animals, frozen 23,13 3 376,28 648,27 1,71 0901
Coffee, whether or not roasted or
decaffeinated; coffee husks and skins; coffee substitutes containing coffee in any
proportion
21,42 5 203,35 215,18 2,64 2304 Soybean oilcake and other solid residue,
wh/not ground 21,16 4 719,37 128,74 2,39
7201 Pig iron and spiegeleisen in pigs, blocks or
other primary forms 20,20 971,14 3,52 0,49
8706 Chassis, with engines, for vehicles of positions 87.01 through 87.05 17,82 635,60 177,24 0,32 2207
Undenatured ethyl alcohol of an alcoholic strength by volume of 80 % vol or higher; ethyl alcohol and other spirits, denatured, of any strength
16,86 1 014,29 413,22 0,51
4703 Chemical wood pulp, soda or sulphate, other than dissolving grades 16,33 4 434,24 3 251,04 2,25
2009
Fruit juices (including grape must) and vegetable juices, unfermented and not containing added spirit, whether or not containing added sugar or other sweetening matter
14,43 1 924,69 276,41 0,98
1507 Soya-bean oil and its fractions, whether or
not refined, but not chemically modified 13,83 1 347,66 139,37 0,68 4104
Tanned or crust hides and skins of bovine (including buffalo) or equine animals, without hair on, whether or not split, but not further prepared
chemically defined; aluminium oxide; aluminium hydroxide
1602 Other prepared or preserved meat, meat offal
or blood 10,37 1 268,18 33,75 0,64
1005 Maize (corn) 9,50 2 214,96 759,78 1,12
4107
Leather further prepared after tanning or crusting, including parchment-dressed leather, of bovine (including buffalo) or equine animals, without hair on, whether or not split, other than leather of heading 4114
9,06 982,53 70,49 0,50
0102 Live bovine animals 8,79 658,66 45,00 0,33
7207 Semi-finished products of iron or non-alloy
steel 8,27 2 434,34 224,63 1,23
7202 Ferro-alloys 7,58 2 038,95 2 513,75 1,03
6802
Worked monumental or building stone (except slate) and articles thereof, other than goods of heading 6801; mosaic cubes and the like, of natural stone (including slate), whether or not on a backing; artificially coloured granules, chippings and powder, of
6,26 633,16 393,22 0,32
5201 Cotton, not carded or combed 5,48 821,55 683,05 0,42 0203 Meat of swine, fresh, chilled or frozen 4,90 1 226,58 0,91 0,62 8802
Other aircraft (for example, helicopters, aeroplanes); spacecraft (including satellites) and suborbital and spacecraft launch vehicles
4,63 3 999,05 10 806,30 2,03
4802
Uncoated paper and paperboard, of a kind used for writing, printing or other graphic purposes, and non-perforated punch-cards and punch tape paper, in rolls or rectangular (including square) sheets, of any size, other than paper of heading No 4801 or 4803
4,14 934,19 2 132,97 0,47
8429
Self-propelled bulldozers, angledozers, graders, levellers, scrapers, mechanical shovels, excavators, shovel loaders, tamping machines and road rollers
3,66 1 349,69 8 411,85 0,68
8701 Tractors (other than tractors of heading
8709) 2,84 1 047,87 1 233,30 0,53
2603 Copper ores and concentrates 2,75 1 237,74 9 654,49 0,63
7601 Unwrought aluminium 2,74 1 280,35 1 322,01 0,65
8409
Parts suitable for use solely or principally with the engines of heading
No 8407 or 8408
2,58 1 446,94 12 238,97 0,73 6403
Footwear with outer soles of rubber, plastics, leather or composition leather and uppers of leather
2,02 924,30 809,40 0,47 4011 New pneumatic tyres, of rubber 1,91 1 277,12 12 867,16 0,65 3901 Polymers of ethylene, in primary forms 1,82 1 113,05 9 982,20 0,56 8704 Motor vehicles for the transport of goods 1,81 1 686,89 19 775,19 0,85 8407 Spark-ignition reciprocating or rotary
internal combustion piston engines 1,81 641,37 4 383,61 0,32 8501 Electric motors and generators (excluding generating sets) 1,79 721,84 5 912,87 0,37 8414
Air or vacuum pumps, air or other gas compressors and fans; ventilating or
recycling hoods incorporating a fan, whether or not fitted with filters
1,53 932,22 14 070,30 0,47 2709 Crude oil from petroleum and bituminous
7208
Flat-rolled products of iron or non-alloy steel, of a width of 600 mm or more, hot-rolled, not clad, plated or coated
1,38 770,17 9 481,39 0,39 7108
Gold (including gold plated with platinum), unwrought or in semi-manufactured forms, or in powder form
1,26 1 801,95 22,52 0,91 8708 Parts and accessories of the motor vehicles
of heading 8701 to 8705 1,16 3 381,64 49 285,00 1,71 9403 Other furniture and parts thereof 0,89 582,28 863,43 0,30 8481
Taps, cocks, valves and similar appliances for pipes, boiler shells, tanks, vats or the like, including pressure-reducing valves and thermostatically controlled valves
0,88 576,00 10 577,97 0,29
8703
Motor cars and other motor vehicles principally designed for the transport of persons (other than those of heading 8702), including station wagons and racing cars
0,79 4 416,14 83 049,81 2,24
2710
Petroleum oils and oils obtained from bituminous minerals, other than crude; preparations not elsewhere specified or included, containing by weight 70 % or more of petroleum oils or of oils obtained from bituminous minerals, these oils being the basic con
0,45 3 060,74 111 258,56 1,55
8517
Electrical apparatus for line telephony or line telegraphy, including line telephone sets with cordless handsets and
telecommunication apparatus for carrier-current line systems or for digital line systems; videophones
0,39 1 277,74 33 594,31 0,65
3004
Medicaments (excluding goods of heading 3002, 3005 or 3006) consisting of mixed or unmixed products for therapeutic or prophylactic uses, put up in measured doses (including those in the form of transdermal administration systems) or in forms or packing
0,29 898,05 31 449,41 0,46
Total 1,31 77,06
* (in millions of US dollars)
Table 8: Top Fifty Brazilian’s Industries in Terms of World Export Share, 2010 (elaborated by the author, Data Source: International Trade Centre, Products, 2010)
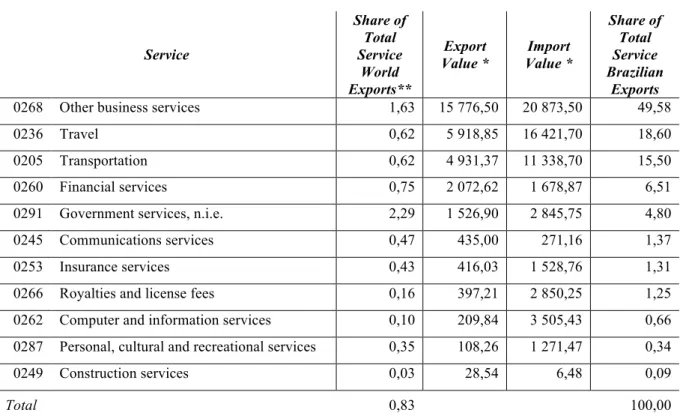
The services also have a considerable impact in the inputs and outputs of the economy. They are classified according to an internationally agreed framework for the compilation and reporting of statistics of international trade in services (International Trade in Services, 2010, p. 14):
Service Share of Total Service World Exports** Export Value * Import Value * Share of Total Service Brazilian Exports
0268 Other business services 1,63 15 776,50 20 873,50 49,58
0236 Travel 0,62 5 918,85 16 421,70 18,60
0205 Transportation 0,62 4 931,37 11 338,70 15,50
0260 Financial services 0,75 2 072,62 1 678,87 6,51
0291 Government services, n.i.e. 2,29 1 526,90 2 845,75 4,80
0245 Communications services 0,47 435,00 271,16 1,37
0253 Insurance services 0,43 416,03 1 528,76 1,31
0266 Royalties and license fees 0,16 397,21 2 850,25 1,25 0262 Computer and information services 0,10 209,84 3 505,43 0,66 0287 Personal, cultural and recreational services 0,35 108,26 1 271,47 0,34
0249 Construction services 0,03 28,54 6,48 0,09
Total 0,83 100,00
* (in millions of US dollars)
** The World Total Exported services has missing data from some countries
Table 9: Brazilian Services in Terms of World Export Share, 2010 (elaborated by the author, Data Source: International Trade Centre, Services, 2010)
The result found in the top fifty illustrates how important the natural resources are to Brazil, not only one kind of product but in a diversified range as sugar cane, iron, soya beans, tobacco and coffee. All those had more than 20% each in terms of share of total world exports that represents a significant number.
In 2010, according to Center for Advanced Studies for Applied Economics, the agriculture represented 21% of Brazil’s GDP. The important exports in the same period for some products reveals the international competitive advantage of this nation in this area.
On a services’ perspective, the nation’s share of total world exports is very low, what can be explained by the high internal demand, and confirmed by a very high importation of services. Moreover, the exports of all services (31 billion US dollars) represented a high share of total Brazilian’s export (228 billion US dollars).
The top fifty reveals the importance of the main products exported and how concentrate it is, since it represents more than 75% of share of total Brazilian exports.
Following Porter’ study, in order to summarize the top fifty list, the structure of broad cluster will be adapted to the representation of the share of Brazilian’s exports. The products in the list were aggregated in the level of the “chapter”, defined by the Harmonized System (HS), and organized into the clusters (see Figure 4: The Cluster Chart). For some kind of products as “Live animals”, in this paper the classification will be in a different way from Porter’s: “Multiple business” instead of “Food/Beverage”. The services are aggregated in a cluster with the same name.
The broad cluster will be classified in three levels:
Upstream industries: its primary products are inputs to products in other industries.
Industrial and Supporting Functions: related to particular end uses and transformation industry.
Final Consumption goods: end-user sectors (also has primary products that are inputs in other industries, as example “Foods/Beverages” are the soya beans, that can be at the same time to the final user or can be processed into a derivated product).
Figure 4: The Cluster Chart (adapted from Porter, 1990, p. 288)
The list of Brazilian exports was classified according to the Cluster Chart and the result is a clear overview of the nation in terms of competitiveness and its competitive sectors.
Upstream Industries
Industrial and Supporting Functions
Final Consumption Goods and Services Materials/
Metals Forest Products
Petroleum/ Chemicals Multiple Business Transportation Food/ Beverage Textiles/ Apparel Housing/
The clusters chart has the broad clusters and its level. Below in each cluster are identified the total share of Brazilian Exports and the percentage it represents in terms of World Exports.
Figure 5: Share of Exports of the World and Brazil by Cluster, in 2010 (elaborated by the author)
The selected clusters identified as board clusters are the international competitive Brazilian industries. They are grouped in five clusters and they are most concentrated in upstream industries and final consumption goods and services. This last represents almost half of total of Brazil’s exports, which stands the highly international competitive industries.
The largest industry in terms of Brazil’s exports is the food and beverage. It represents more than 26% of total nation’s exports. The second cluster is the materials and metals and represents 20% of total nation’s exports. The third is the cluster of petroleum and chemicals, which represents more than 13% of total nation’s exports. The fourth cluster has all services and it represents 16% of total exports.
The cluster level of industrial and support industry is not so competitive as the others, but still has an important value. At this level, there is the fifth cluster, i.e.: Transportation. Motorcars,
UPSTREAM INDUSTRIES INDUSTRIAL AND SUPPORTING FUNCTIONS FINAL CONSUMPTION GOODS AND SERVICES Materials/ Metals Forest Products Petroleum/ Chemicals Multiple Business Transpor-tation Food/ Beverage Textiles/ Apparel Housing/
Household Health Care Personal Services
Brazil: World: 20,64 8,70 Brazil: World: 0,47 4,14 Brazil: World: 13,52 1,39 Brazil: World: 4,38 1,30 Brazil: World: 7,80 1,40 Brazil: World: 26,37 21,52 Brazil: World: 1,76 4,50 Brazil: World: 0,30 0,89 Brazil: World: 0,46 0,29 Brazil: World: 1,37 24,98 Brazil: World: 16,12 0,83 Brazil: World: 34,63 2,84 Brazil: World: 12,19 1,37 Brazil: World: 46,38 2,01
parts and accessories of motor vehicles are very competitive industries in Latin America market and aircraft industry in the world.
The clusters reinforce the results of the top fifty indicating that the natural resources are the international competitive advantage of Brazil, followed by transportation, represented by the automotive and aircrafts sectors. The services’ clusters, in a more detailed level, are mostly represented by architectural, engineering and other technical consultancy added by other business and legal, accounting, management and public relations services.
Some clusters have a high participation in the Worlds Export Share but it is not so representative in Brazilian Exports shares, therefore they will not be selected.
The Brazilian clusters illustrate the sectors of Brazil’s strength and the areas that the nation is internationally competitive.
3.1.3 Factor Conditions
This part of the study presents, in a general way, the nation’s factors input conditions, which are the natural and human resources and infrastructure.
Brazil’s international competitive industries gravitate around its natural resources associated to its climate, soil and the magnificence of this country.
Besides the Amazon forest, Brazil has a huge forest range in addition to some areas that are undergoing reforestation. Brazil has one of the most extensive river systems with 8 basins. The hydropower potential of those rivers are 260 GW and only 25% are being used in the energy production (Brazilian Electricity Regulatory Agence, 2003).
The plantation area is largely developed as well the areas for livestock production.
The technology for agriculture is highly developed and receives large investments by the government, private companies and producers operating in this area.
In terms of infrastructure, Brazil has many points to be improved specially the sector of internal transportation. However, in the last years both attention and investments have been rising towards this sector.
The country will host two big international events in the near future, namely: the next Football World Cup, in 2014, and the Olympic games, in Rio de Janeiro, in 2016. These two great events are one of the main reasons for many investments to be encouraged and funded by the Brazilian government.
The education in Brazil has received more attention by the Government in terms of investments. It is still a key factor to be improved in Brazil as the level of education is related to the social-economic conditions. The expected years of education is 16,3 between the ages of 5 and 39, which is close to the average of the OECD. Amongst adults between 25 to 64 years old, only 41% studied up to high school level. The positive point is that in the adult population between 25 to 34 years old, 53% have finished the high school (OECD, 2013).
The higher education receives more attention than elementary school in terms of public investment, but it is not accessible for all. In most cases, students who had a good basic and elementary school education are those who reach public higher education although the social-economic condition is also a strong determinant.
In Brazil the public education is free of charge. The government implemented a program of social and racial quotas. This program aims to reserves a percentage of places in the universities for students coming from public education, low income families and also for those that are self declared black, mixed race and indigenous. The racial quotas percentage varies per State and follows the recent census done by IBGE. This program was created to reduce the disparity of races in the public universities. The last census showed that 52% of the Brazilian population are self declared black, mixed race or indigenous, but nonetheless they represent less than 30% of the university students (Governo Federal do Brasil, 2012).
In terms of world rankings, the Brazilian universities have a lot to improve. In 2012/2013 Times Higher Education ranking, Brazil had only one University in the Top 200 and in 2013/2014 it drops out from the Top 200’ list (Times Higher Education, 2013).
Despite the fact that the universities of Brazil are not well rated in the world higher education rankings, it is well rated and highly respected by the Latin America community (Top Universities, 2013). As mentioned earlier in this paper, the technological clusters are closely important to the Universities for its contribution for the improvement of the quality,
investments and visibility it lends to the Universities thus allowing the attraction of more partners, which in turn generates employment to young graduates.
The foreign language proficiency is not a strength point in Brazil. Researches place Brazil in 46th position among 54 countries, with the level “very low” in English proficiency (Exame, 2012). The lack of a foreign language proficiency is a barrier for the Brazilian workers and companies. Generally speaking, the foreigners’ workers and companies have to learn Portuguese in order to achieve their goals or they will always depend on the fewer bilinguals’ employees. This factor condition should be better explored and could receive more attention from companies and educational entities. It can be overtaken by persistent endeavour and commitment. Since 1998 the teaching of English is mandatory from the fifth year of primary school. It means that all students in Brazil should have English classes and most have it, however it seems not to be enough in terms of quality and/or rigour.
The Portuguese language is a competitive advantage when doing business with other Portuguese speaking countries and administrative region such as Portugal, Angola, Cape Verde, Guinea-Bissau, Mozambique, São Tomé and Príncipe, Macau and East Timor.
The Brazilian working law regulation has come into practice since 1943. A normal working week is of 44 hours/week, from Monday to Saturday, exchangeable to Monday to Friday. The benefits of an employee are approximately 30 days of paid vacation with a bonus of 1/3 of the monthly salary (after a full year of employment), plus a bonus called “13th salary” in the end of the year. There are other benefits for overtimes, weekend works, night workers, and others according to the industry or work conditions. The costs of hiring an employee are high. The charges vary from segment of company, but in general, it represents 66% of the salaries (Deloitte, 2010). The minimum salary referenced in October 2013 is 678 Brazilian Real (313 US dollars).
3.1.4 Demand Conditions
This part presents the customer needs and market demands of the nation.
The internal demand in Brazil is huge thanks to its large demographic situation.
After many social programs to reduce the poverty and income inequality, a new kind of consumer has appeared in this nation. Those who lived close to the poverty line, use the aid provided by the government for basic needs such as food, school supplies, personal hygiene and clothing for the children (The World Bank, 2010).
For other families, before the aid they used their meagre budget to buy items of basic necessities leaving them with no money left till the end of the month. However this has changed. Now they have extra money that gives them purchasing power allowing the purchase of goods that formerly they were not able to. They are called “the new middle-class”.
In 1992, the middle-class, also known as “C class”, was composed by 34,96% of the population. In 2009, it turned into 50,5% and in 2010 it corresponded to 52% of the population. Nowadays they hold 46,24% of the purchase power (Secretária de Assuntos Estratégicos, 2013) and in the president’s election of 2014 they will represent 57% of the electorate (InfoMoney, 2011).
The considered middle-classes are the families having a total income between 486 and 2.097 US dollars, which is considered a medium income.
To contextualize, the “D classes” are the families that the total income is between 350 and 486 US dollars; the “E classes” have a total income below 350 US dollars and the “classes AB” have a total income higher than 2.097 US dollars. These data are used as reference for researches and varies one to another institute (Fundação Getúlio Vargas, 2013).
The improvement of life quality and incomes of the families is not only because of the aid’s programs. The considerable changes introduced in the Brazilian economy, the control of inflation and investments in the local market has reflected in prices stabilization. Brazilians are travelling more to other countries, seeing others cultures and habits and they are becoming more demanding and sophisticated in their taste.