UNIVERSIDADE DA BEIRA INTERIOR
Engenharia
Effect of Crossflow Variation on Impacting Droplets
(versão corrigida após defesa)
Filipa Leal Pereira
Dissertação para obtenção do Grau de Mestre em
Engenharia Aeronáutica
(Ciclo de estudos integrado)
Orientador: Prof. Doutor André Resende Rodrigues da Silva
Acknowledgements
Firstly, I would like to thank my supervisor, Assistant Professor André Resende Rodrigues da Silva, for the opportunity given to develop the present work, for his guidance, dedication and knowledge sharing.
In addition, I would like to thank my colleagues and friends that worked by my side in AEROG. To Inês Ferrão, a special thanks for all the days invested in teaching me and guiding me through the laboratory. To Francisco Carvalho, for being the friend I need. To Daniel Rodrigues, Cátia Moura, Daniela Ribeiro, Emanuel Camacho and Leandro Magalhães for providing me good disposition during this past months of hard work.
To my friends, Elisa Duarte, Sílvia Silva, Flávio Rosa, Bárbara Martins, António Rodrigues, Pedro Nunes, Burcu Dilaver, Pedro Dente and Francisca Garcia for the friendship, support and unfor‐ gettable moments through this five year long journey. To Luís Romeiro for the help and amazing moments. You are my example.
I want and must thank my family, especially my parents, Marta and Ernesto, and godparents, Fernando and Maria, for always supporting me in this academic journey. I am eternally grateful for allowing me to follow my dream and for always walking by my side. My brother, Pedro Pereira, for making my life more colourful and happy. You will forever have someone on your corner to protect you and guide you through your life.
Last but not least, thank you with all my heart to Gabriel Carrolo for helping grow and shape the woman that I am today. Your advices, love, affection and happiness made this period of my life the best one yet. Thank you for your patience, support and for boosting my confidence not letting me give up. You will be always treasured.
Resumo
O fenómeno do impacto de gotas tem diversas aplicações na engenharia e processos industri‐ ais, como em arrefecimento, pintura e revestimentos por sprays. Em engenharia aeronáutica, impactos de gotas a alta velocidade podem causar erosão em turbinas e o impacto de gotas de combustível nas paredes de motores de combustão interna afeta a razão de evaporação de com‐ bustível e a distribuição de gotas. O resultado do impacto de gotas depende das propriedades do líquido, das características superfície de impacto e dos parâmetros cinemáticos.
O uso excessivo de combustíveis fósseis levou o homem a encontrar alternativas viáveis e mais ecológicas, de forma a reduzir emissões nocivas. Desta maneira, o estudo de combustíveis biológicos alternativos torna‐se indispensável de forma a compreender o seu comportamento quando aplicados no sector aeronáutico.
Embora estes fenómenos sejam alvo de diversos estudos, estudos envolvendo gotas de Jet A‐1 misturadas com NEXBTL são escassas. Assim sendo, um estudo fundamental da influência de um escoamento cruzado no impacto de gotas foi realizado.
Para estudar o comportamento da colisão de gotas em superfícies secas sob o efeito de um escoamento cruzado, foi utilizada uma instalação experimental. O impacto normal foi, tam‐ bém, estudado de forma a melhor compreender a influência da variação escoamento cruzado. Os estudos experimentais foram realizados com velocidades de crossflow de 7m.s−1,10m.s−1, 12m.s−1e 15m.s−1e com quatro fluídos: 100% Jet‐Fuel, 75% JF ‐ 25% HVO, 50% JF ‐ 50% HVO e H2O(água destilada). Tendo em consideração que a legislação atual para o sector aeronáutico
apenas permite uma percentagem mínima em volume de 50% Jet‐Fuel, deste modo não foram consideradas outras misturas.
Observou‐se que a transição não‐splash/splash para o impacto normal de uma gota difere do impacto sob a influência de um escoamento cruzado, onde as componentes da velocidade aparentam ter significância. Assim, os resultados experimentais foram comparados com as cor‐ relações empíricas propostas pela literatura. Foi também verificado que um aumento na veloci‐ dade tangencial no instante anterior ao impacto, ou seja, correspondendo a uma velocidade do escoamento cruzado maior aparenta reduzir a ocurrência das pequenas gotas secundárias.
Palavras‐chave
Impacto de gotas, Jet‐Fuel, Biofuel, Escoamento cruzado, Atomização secundária, Transição não‐splash/splash, Sprays.
Abstract
The phenomena of droplet impingement has several applications in engineering and industrial processes, such as spray cooling, spray painting and spray coating. For aeronautical engineering, high‐speed impacts can cause erosion in steam turbines and the impact of fuel sprays on a wall of internal combustion engines affects the rate of fuel evaporation and droplet distribution. The outcome of droplet impingement depends on the liquid and its properties, the impact surface and kinematic parameters.
The excessive use of fossil fuels led humans to find more ecological viable alternatives, in order to reduce harmful exhaust emissions of liquid‐fuel combustors. In this way, the study of bio‐ logical alternative fuels has proven to be imperative in order to understand its behaviour when employed in the aeronautical sector.
Although these phenomena are widely studied, researches concerning the impact of Jet A‐1 mixed with NEXBTL biofuel droplets influenced by a crossflow are scarce. Consequently, a fundamental study of the influence of crossflow variation on impacting droplets is performed. To study the droplet impingement behaviour on a smooth, dry aluminium surface, an experi‐ mental facility was used. Normal impact is studied in order to better understand the influence of the crossflow. The experiments are conducted with crossflow velocities of 7m.s−1,10m.s−1,
12m.s−1and 15m.s−1and four fluids: 100% Jet‐Fuel, 75% JF ‐ 25% HVO, 50% JF ‐ 50% HVO and
H2O(pure water) as reference. Considering that present legislation in the aeronautical sector
allows a minimum concentration of 50% Jet‐Fuel, no other mixtures are considered.
It was observed that the non‐splash/splash transition for normal impact differs from crossflow impact, where both velocity components have effect on impact outcome. Thus, the experimen‐ tal results were compared with empirical correlations proposed in the literature. It was also verified that an increase of tangential velocity, i.e, an increase in crossflow velocity, smoothed the extent of small secondary droplets.
Keywords
Droplet impact, Jet Fuel, Biofuel, Crossflow, Secondary atomization, Non‐splash/splash transi‐ tion, Sprays.
Contents
Contents ix
List of Figures xi
List of Tables xiii
1 Introduction 1
1.1 Motivation . . . 1
1.2 Objectives . . . 2
1.3 Work Structure . . . 2
2 Literature Review 3 2.1 Impingement Governing Parameters . . . 3
2.2 Droplet/Wall Interactions . . . 6 2.3 Effect of a Crossflow . . . 10 2.4 Deposition/Splash Transition . . . 11 3 Experimental Setup 15 3.1 Experimental Facility . . . 15 3.1.1 Wind tunnel . . . 16
3.1.2 Droplet Dispensing System . . . 17
3.1.3 Image Acquisition System . . . 18
3.1.4 Illumination System . . . 18
3.1.5 Impact Surface . . . 19
3.2 Methodology . . . 20
3.3 Fluid Properties . . . 20
3.4 Image Data Processing . . . 21
3.4.1 Pixel Sizing . . . 21
3.4.2 Droplet Diameter . . . 22
4 Results and Discussion 23
4.1 Phenomena Visualization . . . 23
4.1.1 Normal Impact . . . 23
4.1.2 Impact with Crossflow . . . 27
4.1.3 Crossflow Variation Study . . . 32
4.2 Splash‐Threshold . . . 37
4.2.1 Normal Impact . . . 37
4.2.2 Impact with Crossflow . . . 39
4.3 Summary . . . 41
5 Conclusions and Future Work 43 5.1 Conclusions . . . 43
5.2 Future Work . . . 44
Bibliography 45
List of Figures
Figure 2.1 Visual representations of impact angles: a) normal impact, b) impact an‐
gle with a crossflow effect adapted from [5]. . . 4
Figure 2.2 Definition of static contact angle: a) Non‐wettable system, b) Highly wet‐ table system [9]. . . 5
Figure 2.3 Illustration of parameters governing the impact of a liquid drop adapted from [15]. . . 6
Figure 2.4 Stick regime according to [17]. . . 7
Figure 2.5 Spread/deposition regime adapted from [18]. . . 7
Figure 2.6 Prompt splash regime adapted from [18]. . . 8
Figure 2.7 Corona splash adapted from [18]. . . 8
Figure 2.8 Rebound regime adapted from [19]. . . 8
Figure 2.9 Rebound regime: a) Complete rebound, b) Partial rebound adapted from [9]. . . 9
Figure 2.10 Receding breakup regime adapted from [20]. . . 9
Figure 2.11 Fingering regime adapted from ref. [18]. . . 10
Figure 2.12 Deformation of a droplet due to a crossflow [5, 29, 30]. . . 11
Figure 2.13 Impact with crossflow influence [36]. . . 11
Figure 3.1 Experimental facility. . . 15
Figure 3.2 Wind tunnel schematics with element placement [36]. . . 16
Figure 3.3 Nozzle exit of the contraction developed by ref. [40]. . . 16
Figure 3.4 Syringe pump. . . 17
Figure 3.5 Stainless steel needles. . . 17
Figure 3.6 High‐speed camera. . . 18
Figure 3.7 Illumination set: a) Power supply, b) LED panel. . . 19
Figure 3.8 Aluminium impact surface. . . 19
Figure 3.9 Reference: a) Snapshot acquired using the camera’s software, b) Refer‐ ence snapshot in binary outlining the contour. . . 21
Figure 3.10 Images for impact velocity : a) Background image, b) Droplet image 7 frames before impact, c) Droplet image prior to impact. . . 22
Figure 4.1 Normal impact adapted from [5]. . . 23
Figure 4.2 Spreading for 50% JF ‐ 50% HVO mixture (D0= 3.1mm, U = 1.7m.s−1). . 24
Figure 4.4 Prompt splash regime for 75% JF ‐ 25% HVO (D0= 3.1mm, U = 2.2m.s−1). 26
Figure 4.5 Droplet impingement behaviour under the influence of a crossflow and
fluid flow orientation adapted from [5]. . . 27
Figure 4.6 Impact: a) deformation on impact and b) azimuthal direction. . . 27
Figure 4.7 Spread regime development with crossflow effect for 50% JF ‐ 50% HVO
droplet (D0= 3.1mm, U = 1.7m.s−1). . . 28
Figure 4.8 Fingering regime development with crossflow effect for H2Odroplet (D0= 4.1mm,
U = 2.7m.s−1). . . 29
Figure 4.9 Prompt splash regime development with crossflow effect for 100% JF
droplet (D0= 3.0mm, U = 2.3m.s−1). . . 30
Figure 4.10 Corona splash regime development with crossflow effect for 75% JF ‐ 25% HVO droplet (D0= 3.1mm, U = 2.8m.s−1). . . 31
Figure 4.11 H2O droplet impingement with a crossflow velocity of: a) 7 m s−1, b)
10 m s−1, c) 15 m s−1. . . 32 Figure 4.12 100% JF droplet impingement with a crossflow velocity of: a) 7 m s−1and
b) 10 m s−1. . . 33 Figure 4.13 75% JF ‐ 25% HVO droplet impingement with a crossflow velocity of: a)
7 m s−1and b) 10 m s−1. . . 34 Figure 4.14 Outcomes of 75% JF ‐ 25% HVO droplet impingement with a crossflow
velocity of 12 m s−1. . . 35 Figure 4.15 50% JF ‐ 50% HVO droplet impingement with a crossflow velocity of: a)
7 m s−1and b) 10 m s−1. . . 36 Figure 4.16 Deposition/splash transition results for normal impact plotted against
proposed correlations. . . 39 Figure 4.17 Deposition/splash transition results for impact under the influence of
List of Tables
Table 2.1 Relation between the six outcomes and boundary conditions adapted from
[9]. . . 9
Table 2.2 Typical values of the coefficient A depending on the surface roughness adapted from [17]. . . 12
Table 3.1 Fluid properties adapted from [36]. . . 21
Table 3.2 Droplet diameters. . . 22
Table 4.1 Deposition/splash threshold for normal impact. . . 37
Table 4.2 Deposition/splash threshold for droplet impact under influence of a 7 m s−1 crossflow velocity. . . 40
Table 4.3 Absolute velocity for splash occurrence regarding the normal impact (NI) and impact with a crossflow (CI) of 7m.s−1. . . 41
Nomenclature
A, B Surface Roughness Coefficient
a, b, k Dependent Constants B Breakup Bo Bond Number Ca Capillary Number D Deposition D0 Droplet Diameter
Din Needle Inner Diameter
Dout Needle Outer Diameter
F r Froude Number g Gravitational Constant Kc Splashing Parameter La Laplace Number m Mass of substance Oh Ohnesorge Number
Ra Mean Roughness Surface
Re Reynolds Number
U Impact Velocity
Ucf Crossflow Velocity
Un Normal Velocity Component
Ut Tangential Velocity Component
V Volume of substance
We Weber number
Wec Critical Weber number
Greek Symbols
θ Incident Angle
θc Contact Angle
θstatic Static Contact angle
µ Dynamic viscosity
ρ Density
σ Surface tension
τ Non‐Dimensional Time
Subscripts
0 Related to drop ‐ initial
c Critical value
cf Related to Flow ‐ crossflow
in Inner diameter
out Outer diameter
n Normal velocity coordinate
Acronyms
ASTM American Society for Testing and Materials
CI Crossflow impact
CS Corona splash
fps Frames per second
HEFA Hydroprocessed Esters and Fatty Acids
HSDI High Speed Direct Injection
HVO Hydro‐processed Vegetable Oil
JF Jet Fuel
LED Light Emitting Diode
PS Prompt splash
NEXBTL Next Generation Biomass‐to‐Liquid
Chapter 1
Introduction
This first chapter describes the motivation and objectives underlying the development of this experimental study. The study of sprays and secondary atomization has numerous applications in engineering and industrial processes, such as engine combustion, icing studies, ink jet printing and atomization processes. However, the behaviour of droplets impinging onto dry surfaces in not fully understood. Therefore, a fundamental study of the different phenomena resulting of droplet impingement is important.
Since most of the studies are based on normal impacts and for water based mixtures and ethanol, the behaviour of jet‐fuel mixtures for similar conditions and for impacts under the influence of crossflow is different, thus being of paramount importance to be studied and understood.
1.1
Motivation
The desire to fly is intrinsic to man since we looked up to the sky and noticed the birds. Through history many tried, many failed and many succeeded, this was only possible due to the constant desire to advance and improve. Nowadays, the aeronautic sector has proven indispensable to society, in this way, the search for more efficient and ecological fuels is imperative. The dependence on fossil fuels led humanity to a difficult return point, forcing humans to adapt and find ways to reduce its use due to their connection to increasing pollution . The introduction of biofuel mixtures in aero‐engines could be a starting point.
Current legislation for the aeronautical sector allows the mixture of conventional jet fuel with HEFA (Hydroprocessed Esters and Fatty Acids) type alternative fuels. This legislation, ASTM D1655 and ASTM D7566 [1, 2], also imposes a minimum percentage in volume of 50% jet fuel. So, the present experimental work studies mixtures with a maximum of 50% biofuel. The biofuel chosen is NEXBTL, an Hydro‐processed Vegetable Oil (HVO) where animal biomass is not involved [3].
The phenomena of droplet impingement has many aplications, such as spray cooling, spray paint‐ ing, inkjet printing, pesticide spraying and engine combustion, where the secondary droplet size and distribution (secondary atomization) are taken in consideration.
Since the atomization of turbulent liquid jets injected into fast moving, subsonic gaseous cross‐ flows is an important application in gas turbines and ramjets, the impact of these fluids will be studied for two conditions: with and without presence of a crossflow, in a way to understand the different behaviour. Also, the experimental results will able the comprehension of the dif‐ ferences between biofuel and conventional Jet A‐1 in order to enable its use in aero‐engines combustors.
1.2
Objectives
Numerous studies were made in order to understand the droplet impingement phenomena. How‐ ever, researches contemplating the use of jet fuel and biofuel mixtures allied with the use of crossflow are scarce. Thereby, a proper understanding of droplet impingement mechanisms and dynamics is of importance. To achieve this, these objectives were outlined:
• Visualize the outcomes of droplet impingement for normal impact;
• Visualize the outcomes of droplet impingement for impact under the influence of a cross‐ flow velocity of 7m.s−1;
• Visualize the influence of crossflow velocity increase on droplet impact outcomes until the occurrence of breakup;
• Compare the results obtained for splashing threshold for normal impact and impact under the influence of a crossflow velocity of 7m.s−1;
• Compare the results obtained for the splashing threshold with empirical correlations pro‐ posed in the literature.
1.3
Work Structure
This dissertation is composed of five chapters, including the present one providing an overview of the work order.
The literature contextualization is portrayed in chapter 2 with all of the relevant non‐dimensional groups and their physical meaning explained. The various phenomena of droplet impingement are described and the influence of a crossflow is introduced.
Chapter 3 describes the experimental facility and all the components that enable the study of droplet impingement with and without crossflow. Fluid physical properties will also be exposed in this chapter.
Results and discussion can be found in Chapter 4. Firstly, the phenomena visualization results will be presented for normal impact, impact with crossflow and for the crossflow variation study. Following, the results for the threshold will be shown, where the empirical correlations found in the literature are plotted against the results obtained in this experimental work.
Chapter 2
Literature Review
The phenomena resultant from droplet impingement has many applications such as spray cool‐ ing, inkjet printing, pesticide spraying and engine combustion, where the secondary droplet size distribution after impact is taken into consideration.
The outcome of droplet impact on a solid surface depends on the properties of the liquid, the surface conditions and the kinematic parameters, i.e., velocity and momentum, etc. There‐ fore, there is the need to relate all of these aspects when analysing the impact. Whence, the impinging governing parameters, droplet/wall interactions, influence of a crossflow and depo‐ sition/splash transition are addressed in the following subsections.
2.1
Impingement Governing Parameters
As mentioned previously, the phenomena of droplet impingement are conditioned by parameters such as liquid properties (density, viscosity and surface tension) and surface conditions. The major non‐dimensional groups governing droplet impact that will be described below include the Weber, Reynolds, Ohnesorge and Bond number. Surface roughness and impact angle are also presented below.
Non‐dimensional Numbers
Weber number (We) represents a relation between the droplet kinetic energy and surface energy, where the viscous effects are neglected,
W e = ρU
2D 0
σ (2.1)
where U, [m.s−1], corresponds to the droplet impact velocity and D0, [mm], is the droplet
diameter. ρ, [kg.m−3], and σ, N.m−1, are the density and the surface tension of the fluid, respectively.
Reynolds number (Re) relates the inertial forces with the viscous forces,
Re = ρU D0
µ (2.2)
where, µ, [kg.(m.s)−1], is the dynamic viscosity of the fluid.
Ohnesorge number (Oh) describes the relation between capillarity and viscous forces.
Oh = √ µ ρσD0 = √ W e Re (2.3)
Capillary number (Ca) relates viscous forces and surface tension forces.
Ca = W e Re =
µ
σU (2.4)
Laplace number (La) establishes the relation between the surface tension and viscous forces on the liquid.
La = ρσD0 µ2 =
Re2
W e (2.5)
Bond number (Bo) is the relation between the body gravitational forces and surface tension forces.
Bo = ρgD
2 0
σ (2.6)
where g is the gravitational acceleration constant.
Froude number (Fr) describes the ratio between inertial and gravitational forces, not taking in consideration the viscous effects. This parameter shows if gravity can be neglected.
F r = U
2
gD0
=W e
Bo (2.7)
If Fr≥ 102, gravity effects can be neglected [4].
Impact Angle
The impact angle (θ) represents the angle between the absolute velocity vector of the impinging droplet and the impact surface, Figure 2.1.
(a) (b)
Figure 2.1: Visual representations of impact angles: a) normal impact, b) impact angle with a crossflow effect adapted from [5].
According to ref. [6], the outcome of an impinging droplet depends largely on the impact an‐ gle, which also influences the direction of the secondary droplets for smooth surfaces. Ref.
[7] reported that, if the impact angle is not normal to the impact surface, the tangential ve‐ locity component acts to destabilize the spreading liquid film, and hence enhancing droplet fragmentation following its impingement.
It is important to mention that impact angle differs from contact angle (θc). According to ref.
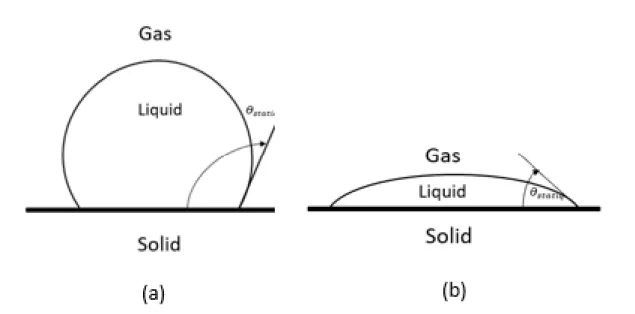
[8], the contact angle is the angle between the tangent to the droplet profile and the tangent to the surface at the junction point between the air, fluid and solid, as Figure 2.2 shows.
Figure 2.2: Definition of static contact angle: a) Non‐wettable system, b) Highly wettable sys‐ tem [9].
In order to understand the concept of contact angle, the wettability concept is explained. Wet‐ tability describes the ability of a liquid to spread on a solid surface. It is represented by the angle between the contour of the drop surface and the interface liquid/solid ‐ static contact angle (θstatic) ‐ this angle is measured when the droplet is standing on the surface. Contact
angles decrease with the increase of wettability.
Surface Roughness
The surface roughness is also an important parameter in droplet impingement dynamics and its normally characterized by its average height [10–13]. Ref. [11] observed that the surface roughness alters the impact angle of impinging droplets, consequently affecting the volume, number, and the size distribution of secondary droplets. For small droplets, this effect becomes more evident. For rough surfaces, the threshold for splash is lowered in comparison to smooth surfaces and the increase of roughness reduces the mass of splash [13, 14]. Ref. [13] reported that the outcome of the impingement not only depends on the kinematic fluid parameters of primary droplets, but also depends on the ratio of the surface roughness compared to the droplet diameter. Therefore, they noticed that the splash phenomena depends on the kinetic energy of the incident droplets, which in term, is independent of the surface properties. If the impact has high kinetic energy and enough momentum normal to the surface to overcome the surface tension of the liquid, splash will appear. Otherwise, if there is low kinetic energy and not enough momentum normal to the surface, the droplet deposits on the surface [11].
2.2
Droplet/Wall Interactions
The behaviour of droplets impinging on dry surfaces is not fully understood. As mentioned above, it depends on a variety of parameters such as the properties of the liquid, the characteristics of the impact surface and exterior influences (crossflow and kinematic parameters).
Considering a droplet impinging on a solid surface, a drop may be spherical or elliptical at the momentum of impact, it can be perpendicular or oblique, in air or vacuum. The liquid may be Newtonian or non‐Newtonian, and the surface can be hard or soft, rough or smooth, chemically homogeneous or heterogeneous, porous flat or curved and dry or wet [14], Figure 2.3.
Figure 2.3: Illustration of parameters governing the impact of a liquid drop adapted from [15].
Ref. [16] was one of the firsts to try to understand the impact phenomena but due to tech‐ nological difficulties was not able to fully advance his study. Ref. [17] identified four main outcomes: stick, rebound, spread and splash. Posteriorly, in their experimental work, ref. [9]
identified six possible outcomes for droplet impact on dry surfaces: spread/deposition, prompt splash, corona splash, receding breakup, partial rebound and complete rebound.
Stick
Stick is when the droplet adheres to the impact wall in nearly spherical form Figure 2.4. This occurs when the impact energy is very low and there is no occurrence of secondary atomization [17].
Figure 2.4: Stick regime according to [17].
Spread/Deposition
Spread occurs when the droplet impacts with a moderate velocity, without forming secondary droplets, onto a dry or wetted wall and spreads out to form a wall film for a dry wall, or merges with a pre‐existing liquid film for a wetted wall [17].
Deposition refers to an impact in which the droplet spreads out, without forming secondary at‐ omization, and forms a lamella with a visible outer rim. When the lamella reaches the maximum spread diameter it recoils and sticks on the surface [9], Figure 2.5.
Figure 2.5: Spread/deposition regime adapted from [18].
Splash
Splash occurs when, following the collision of a droplet with a surface at very high impact energy, jets develop on the periphery of the rim. The jets become unstable and breaks into
many fragments (secondary droplets) [17].
Some authors divided this phenomenon in two: prompt and corona splash. Prompt splash occurs for high Weber and Reynolds numbers and the impact generates small droplets that are ejected from the impact region, Figure 2.6.
Figure 2.6: Prompt splash regime adapted from [18].
Corona splash, also referred as crown splash, is observed when a drop impacts with sufficient velocity so the outer rim formed by the lamella has enough energy that elevates and creates a crown‐like shape. This corona later disintegrates, producing secondary atomization, Figure 2.7.
Figure 2.7: Corona splash adapted from [18].
Rebound and Partial Rebound
When the impinging droplet as enough kinetic energy it will bounce off the wall after impact. This is called rebound, Figure 2.8.
Figure 2.8: Rebound regime adapted from [19].
According to ref. [9], rebound and partial rebound, being dependent on the contact angle and maximum spreading ratio, only occur when a receding phase is observed. For high energy impacts, during the receding phase, not all energy is dissipated and if that energy reaches the impact point the fluid will elevate, Figure 2.9. One of the differences between rebound and partial rebound is found in the dynamic contact angle. For low values a partial rebound occurs and for high values a complete rebound occurs.
(a)
(b)
Figure 2.9: Rebound regime: a) Complete rebound, b) Partial rebound adapted from [9].
Receding Breakup
Receding breakup occurs when the lamella recedes after reaching the maximum spreading ratio and the dynamic contact angle reduces. If it reaches zero, some droplets are left behind by the receding lamella, Figure 2.10.
Figure 2.10: Receding breakup regime adapted from [20].
The resultant phenomena of droplet impingement depends on the combination of several con‐ ditions, such as the impact velocity, droplet diameter and viscosity. Ref. [9] associated each phenomena with boundary conditions and established the relation in Table 2.1.
Table 2.1: Relation between the six outcomes and boundary conditions adapted from [9]. An increase of Deposition Prompt splash Crown splash Complete rebound Partial rebound Receding breakup
U0 ↓ ↑ ↑ ↑ ↑
D0 ↓ ↑
σ ↓ ↓ ↑ ↑ ↑
µ ↑ ↓ ↓ ↓
θstatic ↑ ↑ ↑
According to ref. [9], an increase of droplets velocity results in a decrease of deposition occur‐ rence and an increase of prompt splash, crown splash, partial rebound and receding breakup occurrence. An increase of droplet initial diameter results in a decrease of deposition occur‐ rence, consequently, the occurrence of prompt splash is increased. For the surface tension, an increase translates to a decrease of splash phenomena occurrence and an increase of rebound and receding breakup phenomena. Regarding the kinematic viscosity, due to its relation with
the velocity parameter, results in a decrease of deposition occurrence and an increase of splash phenomena occurrence. As already mention in the literature, an increase of the static contact angle results in an increase of rebound and receding breakup phenomena.
Fingering is also observed in droplet impingement. The axisymmetric patterns of drop evolution during the kinematic and spreading phases are sometimes perturbed by azimuthal disturbances (e.g. capillary), whose growth results in finger‐like shapes at the rim of a spreading drop on a dry wall and is reported by ref. [14], Figure 2.11. Ref. [21] suggested that Rayleigh‐Taylor‐type instability, i.e., an instability on the interface of two fluids with different densities where the fluid of less density pushes the one with the higher density, leading to fingering could be due to air entrapment under the oncoming drop.
Figure 2.11: Fingering regime adapted from ref. [18].
2.3
Effect of a Crossflow
Injection of a liquid jet in a gaseous crossflow is one of the most efficient spray generation techniques when rapid mixing is desired [22, 23]. Superior mixing properties of this flowfield
makes it attractive for power generation and aeronautic propulsion systems, such as low NOx
gas turbine, High Speed Direct Injection (HSDI) diesel engines, and aircraft engine’s afterburner [24, 25]. Among spray characteristics of a liquid jet in a gaseous crossflow, the investigation of droplets’ size and velocity distribution is of a great importance as they establish the subsequent features of fuel oxidant mixing quality, such as droplets’ spatial distribution, vaporization, mix‐ ing rate and consequently the efficiency of liquid fuel combustion [26].
When a droplet is affected by a crossflow, it may deform and be oriented respecting the applied flow. This effect can be attributed to the aerodynamic forces exerted by the gas flow. This flow will also apply additional force to the drop which can vary the outcome of impingement [27]. Furthermore, upon entering the boundary layer at the wall, additional deforming forces are in‐ troduced to the droplet which could decelerate and deform the drop slightly before impact [15]. The deformation is caused by an unequal static pressure distribution over the droplet surface, i.e. when a droplet is exposed to a uniform steady gas flow, the velocity of gas has its maxi‐ mum at the sides of the drop and its minimum at the front and back stagnation points. This, in turn, will cause the droplet to deform from its initial spherical shape into an oblate spheroid, expanding in the radial direction normal to the air flow while decreasing its dimension in the streamwise direction. After reaching the oblate spheroid shape, shear forces and the inner flow inside the droplet cause the side to flatten or even indent, resulting in a spherical cap shape [28]. This deformation can be seen in Figure 2.12.
Figure 2.12: Deformation of a droplet due to a crossflow [5, 29, 30].
Several researches were developed in order to understand the effect of the crossflow. The influence on the drop diameter, secondary atomization, velocity of impinging sprays and others are study in ref. [31–34], Figure 2.13. The comparative study between impact with crossflow influence and oblique impact was also preformed previously in order to better understand the droplet deformation influence on impact outcome [35].
Figure 2.13: Impact with crossflow influence [36].
2.4
Deposition/Splash Transition
The outcome of a droplet impinging on a wall depends on a number of conditions. The phenom‐ ena of splash is one of the most required ones and many researchers have focused in the study of this outcome. To properly establish the transition criteria between impingement regimes a
number of empirical correlations have been developed. The criteria presented below only refers to normal impact and/or only considered the normal component of velocity.
Ref. [10] present the splashing parameter (Kc), a correlation which takes the impact velocity
and the size of the impacting droplet into consideration on the dynamics of impact, allowing the determination of splash occurrence. It is represented as,
Kc= B.Oha.W eb (2.8)
where a and b depend on experimental conditions. This relation dictates that the transition between the different phenomena occurs when the dimensionless parameters become critical. Ref. [10] includes the effect of the surface roughness with the mean roughness amplitude and observed that rough surfaces exhibit a lower value of Kc, and consequently more splash.
Ref. [17] include the effect of surface roughness by varying the fitting parameters of the correla‐ tion, developing criteria for dry and wetted walls depending on the Weber number and surface roughness. For dry surfaces, the transition equation is based on ref. [10] experiment. The boundary limit is represented below,
W ec = A.La−0.18 (2.9)
where the A coefficient depends on the mean surface roughness, Ra. Table 2.2 shows the relation between A and Ra.
Table 2.2: Typical values of the coefficient A depending on the surface roughness adapted from [17]. Ra [µm] A 0.05 5264 0.14 4534 0.84 2634 3.1 2056 12 1322
Ref. [11] present a model using a combination between the Ohnesorge and Reynolds numbers, not taking in consideration the surface roughness. In this splashing threshold, only the normal impact velocity is considered. For the impact surface used to produce the data, two discs were considered, one with smooth surface and the other with rough surface.
Kc= Oh.Re1.25= 57.7 (2.10)
Their experiment shows that deposition transitions to splash when Kc = 57.7, meaning that,
above this value splash occurs and below deposition is observed.
Ref. [37] developed the last criteria used in this dissertation. For the development of their study to determine the empirical correlation for the non‐splash/splash boundary. it was considered
an aluminium disk with a surface roughness of 0.01 µm.
Kc= Oh.Re0.609 = 0.85 (2.11)
This correlation fits well for high Reynolds numbers. However, when viscous forces and wetta‐ bility effects become more significant does not fit well.
Chapter 3
Experimental Setup
This chapter is focused on the experimental setup. Firstly, the experimental facility is intro‐ duced with a brief description of the characteristics of the most important components. Sec‐ ondly, the methodology is presented in order to understand the process used to obtain the exper‐ imental results in this dissertation. The physical properties that govern the dynamic behaviour of a impacting droplet is outlined and described in the fourth section. Finally, a description of the image data processing and analysis is presented.
3.1
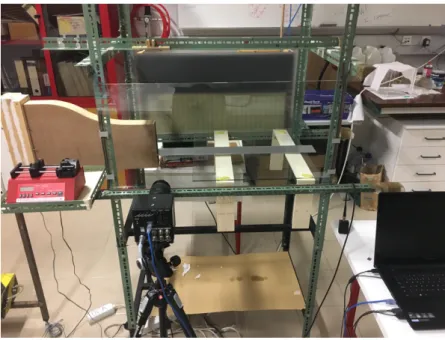
Experimental Facility
To achieve the necessary conditions for the present work an experimental facility is used, pre‐ viously designed by refs. [36, 38]. The experimental arrangement is composed of an impact surface, a wind tunnel, a system for image acquisition, a droplet dispensing system and a LED illumination set. During the experiments, the temperature of the air and humidity of the labo‐ ratory were kept constant (temperature at 22◦± 1◦and humidity at 50% ).
The droplets are generated by a droplet dispensing system that is composed of a syringe pump, and a needle attached with the help of a circular tube. A computer is also used to control this system which releases the fluid with a specific pumping rate. A structure is used to support all of the components and will enable the needle height variation. This structure is visible in Figure 3.1.
3.1.1
Wind tunnel
To study the droplet impact onto a surface with the influence of a crossflow, the knowledge and use of a wind tunnel is indispensable. This wind tunnel is constituted of a diffuser, a setting chamber and a contraction. The diffuser is used to decelerate the flow and was designed with the following specifications: 335 mm of length and an angle of 48.24◦.
According to [39], the setting chamber consists of honeycomb and screens as seen in Figure 3.2. The honeycombs are effective to remove swirl and lateral mean velocity variations, providing that the flow yaw angles are lower than 10◦. The screen allows a more uniform velocity profile of the flow and reduces the boundary layer thickness, giving the flow an increased ability to withstand a pressure gradient.
Figure 3.2: Wind tunnel schematics with element placement [36].
The spacing of the screens must be enough for static pressure to fully recover from a perturba‐ tion before reaching the next one, and minimum spacing should be the magnitude of the eddy containing the maximum energy. Contrary to the diffuser, the contraction is used to accelerate the flow, allowing the placement of the screens and honeycombs in a low‐speed area to reduce pressure losses. The length of the contraction is important because, if it is big enough, it will avoid separation but, consequently, will increase the boundary layer thickness. Designed by ref. [40], the exit nozzle has 200× 40 mm, Figure 3.3.
3.1.2
Droplet Dispensing System
The droplet generation is done using a NE‐1000 Single Syringe Pump, Figure 3.4. This system has a range of 1.459 µl/h, for a 1 mL syringe, to 127.2 ml min−1for a 60 mL syringe. In this study, 50 mLsyringes with a pumping rate of 0.5 mL min−1 are used.
The droplet is originated at the tip of the needle and detaches when gravity exceeds the surface tension forces, allowing a drop generation with a negligible initial velocity. The pump rate is remotely operated by a computer software, making it more efficient and practical.
Figure 3.4: Syringe pump.
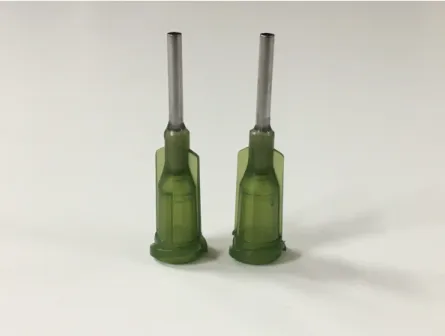
A stainless steel needle is attached to the syringe through an appropriate tube so the pump can be in a static stable mount, reducing unwanted vibrations. The needle has an inner diameter of Din= 1.50 mm. To avoid contamination, different needles are used for each fluid, Figure 3.5.
3.1.3
Image Acquisition System
The camera used in this dissertation, as shown in Figure 3.6, is a Photron FASTCAM mini UX50, with 1.3 megapixel image resolution at frame rates from 2000 fps up to 160 000 fps at reduced image resolution. This is a high‐speed digital camera that allows us to acquire images with an acceptable accuracy and quality. A Macro Lens Tokina AT‐X M100 AF PRO D was attached to the camera with a minimum focus distance of 300 mm, a focal length of 100 mm, a 1:1 macro ratio and a filter size of 55 mm.
Figure 3.6: High‐speed camera.
For the present study, the characteristics of image capture are altered using the camera’s com‐ puter software. The frame rate was set at 4000 fps, 8000 fps and 10 000 fps, corresponding to a resolution of 1280x512, 296x1280 and 240x1280 respectively. The shutter (exposure time) is set at 1/20 000 s, 1/25 000 s and 1/25 600 s.
3.1.4
Illumination System
For a clear visualization of the phenomena, there is a need of providing a good illumination system. In the experiments it is used a 96W LED ribbon attached to a wooden panel connected to a power supply. This converts alternated into direct current eliminating the light flickering, obtaining a more efficient and uniform illumination, Figure 3.7. To improve the visualization of the images, the room is kept completely dark with only the LED switched on during the image acquisition. For a uniform illumination, a diffusion glass was placed between the LED lighting and the impact surface. It is important to mention that this illumination is parallel to the droplet trajectory plane.
(a) (b)
Figure 3.7: Illumination set: a) Power supply, b) LED panel.
3.1.5
Impact Surface
Several factors constrain the single droplet impingement, one of them being the impact surface and its characteristics. As described in [36], the surface is a smooth aluminium plate with 700x80mm, as seen in the Figure 3.8.
Figure 3.8: Aluminium impact surface.
While performing the tests with the crossflow, the aluminium plate is placed across the exit nozzle and equidistant to the two glasses. The plate is placed 70mm above the lower boundary of the exit nozzle to enable a stable crossflow.
Knowing the importance of surface roughness for the development of the phenomena, a measure of the plate roughness is made using a roughness tester, more concretely a Hommel Tester T1000. Three tests were performed analysing a 4.8 mm length section. Ref. [36] impact surface presents a surface roughness of 0.19 µm previously measured by ref. [5].
Is important to mention that, between tests, the surface is thoroughly cleaned in order to maintain the properties and not condition results.
3.2
Methodology
When performing any measurement or experimental test, a detailed plan of the methodology is required in order to minimize waste of fuel and errors. This section is devoted to the method‐ ology followed in this work. The present work presents two different phases.
The first phase is related to the study of normal impact and impact with a crossflow velocity of 7 m s−1. This phase begins ensuring that the high‐speed camera is kept parallel to the droplets trajectory following the definition of a needle hight and the observation of the resulting phe‐ nomenon and the determination of the impact velocity. Finally the injection needle is then varied in order to found the transition between non‐splash and splash.
The second phase refers to the crossflow velocity variation study and starts with the calibration of the wind tunnel so to ensure the correct flow velocity. Once the confirmation is made for the occurrence of splash and respective impact velocity for a crossflow velocity of 7 m s−1the last is gradually increased in a way to verify its influence on droplet impact outcome. It is important to mention that in this last phase only the crossflow velocity is varied and not the injection needle hight.
3.3
Fluid Properties
In this dissertation, four fluids were considered: 100 % JF, 75 % JF ‐ 25 % HVO, 50 % JF ‐ 50 %
HVO and H2O, where HVO is the NEXBTL Hidro‐processed Vegetable Oil and the jet fuel is Jet
A‐1. The use of water is important because it is a reference fluid and its properties are well reported in the literature. However, the main fluid properties (100 % JF and mixtures) are not well established and must be measured before the experiments. The main properties (density, surface tension and viscosity) are presented.
As the current legislation allows a maximum of 50 % in volume for alternative fuels, only the mixtures stated above are considered [2].
Properties
Density, ρ, is defined as the ratio between mass and volume of an homogeneous solution at a specific temperature [41]. Being, in equation form,
ρ =m
V (3.1)
where m, [kg], is the mass and V, [m3], the volume of the substance to be measured.
Surface tension, σ, is given by the specific energy of liquid surface at the interface of another fluid. Regularly, values for surface tension are given when the surface of the liquid is in contact with the air [41].
The viscosity, µ, is defined as a measure of the fluids internal resistance to motion caused by cohesive forces among the fluid molecules [41].
The values for the fluid physical properties used in this experimental work are listed in the Table 3.1.
Table 3.1: Fluid properties adapted from [36].
100 %JF 75 %JF‐25 %HVO 50 %JF‐50 %HVO H2O
ρ [kg/m3] 798 795 792 1000
σ [mN/m] 25.4 25.5 24.6 72.0
µ [mP a.s] 1.12 1.44 1.79 1.0
As it can be seen, the density is higher for the water and lower for 100 %JF, decreasing in the mixtures with the increase of HVO percentage. Regarding the surface tension, the value for 100 %JF and mixtures are similar but triples in value for the water. In terms of viscosity, 100 %JF and water present similar values and, for the mixtures, the value increases with HVO percentage increase.
3.4
Image Data Processing
To study this phenomena it is crucial the knowledge of droplet diameters, impact velocities, and dimensionless numbers. Therefore, image data processing is used to acquire this information with the aid of ®MATLAB software, using [5] algorithm adapted from the work of [38]. The adopted methodology is specified in this section.
3.4.1
Pixel Sizing
All the data is recovered in pixels since all the experimental footage is retrieved through a high‐speed digital camera. The measure of the pixel is made using a reference, Figure 3.9. This sizing is made using a correspondence between the number of pixels in the image and the size of the reference in millimetres. In this work, two references are used, two needles with a exterior
diameter of Dout=1.27 mmand Dout=0.79 mm.
(a) (b)
Figure 3.9: Reference: a) Snapshot acquired using the camera’s software, b) Reference snapshot in binary outlining the contour.
With the aid of a Matlab®algorithm, the image is read by an ”inhouse” built code that outlines the needles out contours and measures the number of pixels. Considering approximately fifteen lines of the image, the algorithm counts the number of pixels existent between the boundaries of the needle.
According to ref. [41], the measurements of a length in digital image with grey values associated with the pixel positions can only be determined with an accuracy of±0.5pixel.
3.4.2
Droplet Diameter
Previously determined in the work of [38], the diameters of the droplets used in this dissertation are presented in the Table 3.2.
Table 3.2: Droplet diameters.
100 %JF 75 %JF‐25 %HVO 50 %JF‐50 %HVO H2O
D [mm] 3.0 3.1 3.1 4.1
3.4.3
Impact Velocity Determination
The impact velocity of a droplet is crucial for the determination of the dimensionless numbers. For this, three images are considered, the background, the image of the droplet in the moment before impact and one 7 frames before impact, Figure 3.10. This allows the determination of the position of the droplet centroid, making possible an approximation of the general trajectory of the droplet.
The images are retrieved at 4000 fps, 8000 fps and 10 000 fps , meaning a time‐step of 1.75ms,
0.875msand 0.7ms, respectively. Knowing the time and distance travelled between images, the
velocity is calculated.
(a) (b) (c)
Figure 3.10: Images for impact velocity : a) Background image, b) Droplet image 7 frames before impact, c) Droplet image prior to impact.
For the first phase two frame rates were used. For the same impact condition it was verified that the impact velocity was 1.69 m s−1 and 1.71 m s−1 for 4000 fps and 8000 fps respectively, presenting a difference of 0.02 m s−1. For the second phase it was used the 8000 fps and 10 000 fps frame rates and it was verified a impact velocity of 2.3 m s−1 and 2.28 m s−1 respectively.
Chapter 4
Results and Discussion
This chapter details the results obtained in the experimental study and is divided in three sec‐ tions: phenomena visualization, splash threshold and summary, where the results are presented and discussed.
Firstly, the visualization and development of each regime for normal impact and impact un‐ der the influence of crossflow are listed. The study of the variation crossflow velocities is, then, presented in order to understand the influence of each velocity component (normal and tangential) on the phenomena outcome.
Secondly, the threshold is presented for normal impact and crossflow impact. Following the com‐ parison of the experimental results with empirical correlations developed by other researchers. Finally, the most important conclusions are briefly presented in a summary
4.1
Phenomena Visualization
The following section is divided in three subsections: normal impact, impact under the influence of crossflow velocity of 7 m s−1 and crossflow velocity variation study.
In the case of the drop impact on a surface, two stages can be recognized. Firstly, after coming into contact with the surface, the drop moves vertically down and the liquid is being radially spread over the surface until it reaches the maximum diameter. Secondly, after the lamella reaches its maximum spreading, the lamella contact line either recedes or sticks to the surface [42].
4.1.1
Normal Impact
In this experimental work, three regimes are found for normal impact: deposition, fingering and prompt splash. The results are presented based on the impact energy necessary to produce such phenomena. A normal impact refers to a droplet impingement perpendicular to a stationary surface as represented in Figure 4.1.
In Figure 4.2, there is a sequence of images which shows deposition for the 50% JF ‐ 50% HVO mixture. This occurs when the droplet impacts on a surface with moderate velocity and spreads out to form a film wall. Before impact the droplet is spherical, as seen in the instant τ =−0.07. The impact moment corresponds to τ = 0 and in the following frame, which corresponds to τ = 0.07, splash is not observed, i.e., no secondary atomization occurred. After impingement the lamella starts to spread evenly on both sides. When reaching the maximum spread diameter it recoils and sticks to the wall.
In Figure 4.3, the fingering phenomena is presented for H2O. Fingering appears when the outer
rim of the lamella suffers disturbances during the spreading phase creating finger‐like shapes. Similar to the spread regime, before impact the droplet is spherical. Following the moment of impact, no secondary atomization occurs, τ = 0.07, and the lamella starts to spread radially allowing the initial visualization of fingering, τ = 1.50. When reaching the maximum spread diameter, one is able to observe the finger structures’ complete formation (τ = 3.55), later originating receding and stick events.
Prompt splash regime for 75% JF ‐ 25% HVO droplet is displayed in Figure 4.4. Splash occurs for high Reynolds numbers and is characterized by the formation of smaller droplets on the periphery of the rim. Similar to the previous case, the droplet is spherical before impact. After the impingement (τ = 0) prompt splash occurs at upstream and downstream, τ = 0.09. On both instants, it is possible to observe the secondary droplets being ejected from the rim while the spreading phase is maintained.
4.1.2
Impact with Crossflow
All the tests considered for the study present in this section were performed with a crossflow velocity of Ucf = 7 ms−1and a left to right flow direction. The droplet suffers a certain defor‐
mation due to the influence of crossflow which conditions the impact, that translates into an impingement where the droplet will impact with normal and tangential impact velocity. This will create a certain angle defined as the incident angle (θ). The incident angle represents the angle between the absolute impact velocity and the surface. Figure 4.5 displays a representa‐ tion of the droplet behaviour under the influence of the crossflow and the orientation of the fluid flow. Figure 4.6a displays the deformation upon impact and Figure 4.6b represents the azimuthal direction on a impinging droplet.
Figure 4.5: Droplet impingement behaviour under the influence of a crossflow and fluid flow orientation adapted from [5].
(a) (b)
Figure 4.6: Impact: a) deformation on impact and b) azimuthal direction.
A droplet of 50% JF ‐ 50% HVO impinging in a smooth dry wall under the influence of crossflow is displayed in Figure 4.7 representing the spread phenomena. Spreading of a drop on a surface influenced by a crossflow is due to two facts: first, drop’s initial kinetic energy; second, mo‐ mentum transfer from the surface to the lamella. The former leads to lamella expansion around the liquid body of the drop and the latter stretches the lamella in the direction of the flow. Before impact the droplet is deformed due to the crossflow. After the impact, the droplet spreads without secondary atomization creating a film wall. When the maximum spread ratio is attained the film wall starts to slide in the flow direction.
Figure 4.7: Spread regime development with crossflow effect for 50% JF ‐ 50% HVO droplet (D0= 3.1mm, U = 1.7m.s−1).
Figure 4.8 presents the development of fingering for a H2Odroplet impinging with crossflow
effect. For the same crossflow velocity, due to its’ greater surface tension, an H2Odrop does
at τ = 0 the droplet spreads and starts to develop fingering in the outer rim (τ = 0.46). Similar to the case mentioned above, once the maximum spread ratio is reached (τ = 2.44), the fluid slides in the direction of the flow.
Figure 4.8: Fingering regime development with crossflow effect for H2Odroplet (D0= 4.1mm,
U = 2.7m.s−1).
Figure 4.9 displays the prompt splash regime for an 100% JF droplet. As can be observed the droplet is deformed before impact (τ =−0.07). In instant τ = 0.09, it is possible to notice that
prompt splash occurs on the left side of the droplet. One is able to perceive that the ocurrence of splash is greater on the left side than on the right side (τ = 0.19), this phenomenon will be presented in the following section. As the lamella spreads, it is possible to observe the development of the splash as the secondary droplets are ejected from the outer rim of the lamella. When reaching the maximum spread ratio (τ = 2.20), it slides in the direction of the flow.
Figure 4.9: Prompt splash regime development with crossflow effect for 100% JF droplet (D0= 3.0mm, U = 2.3m.s−1).
The development of the corona splash regime for a 75% JF ‐ 25% HVO droplet is displayed in Figure 4.10. Before impact the droplet is slightly deformed. At the moment of impact (τ = 0) is possible to notice secondary atomization. Crown starts to rise, and tinny droplets are ejected in the periphery (τ = 0.12), when the lamella reaches a certain thickness, the crown is ruptured (τ = 0.23), and secondary droplets are ejected as the lamella spreads (τ = 1.39).
Figure 4.10: Corona splash regime development with crossflow effect for 75% JF ‐ 25% HVO droplet (D0= 3.1mm, U = 2.8m.s−1).
4.1.3
Crossflow Variation Study
All the tests considered for the study presented in this section were performed with a crossflow velocity, Ucf, of 7 m s−1, 10 m s−1, 12 m s−1 and 15 m s−1, and a left to right flow direction. For
this study, the normal velocity of impingement was kept constant for each fluid, being this velocity, the one where splash first occurred for Ucf= 7m.s−1 and only the crossflow velocity
was increased.
4.1.3.1 H2O(water) impingement
Figure 4.11 displays the impingement for a H2O droplet with an influencing crossflow of a)
7m.s−1, b)10m.s−1and c) 15m.s−1.
(a) (b) (c)
Figure 4.11: H2Odroplet impingement with a crossflow velocity of: a) 7 m s−1, b) 10 m s−1, c)
15 m s−1.
One is able to perceive that the initial deformation is different for each velocity, having for the first two velocities an elongated deformation and for the last a transversal deformation
creating a bean‐like shape. This may occur due to the fact that this last velocity is near the breakup regime velocity. In Figure 4.11a, at τ = 0.07, is possible to observe prompt splash on the left side (upstream). Here, tiny droplets are generated at the contact line of the lamella while it spreads. However, when the crossflow velocity is increased, Figure 4.11b, the small droplets are smoothed by the flow and no secondary atomization occurs (τ = 0.07), the lamella spreads asymmetrically and fingering is observed. The droplet, displayed in Figure 4.11c, having a transversal deformation, when it impacts the surface prompt splash occurs on the right side (downstream), τ = 0.07. The small droplets move upward and on the direction of the flow.
4.1.3.2 100%JF impingement
Figure 4.12 displays the impingement for a 100% JF droplet with an influencing crossflow of a) 7m.s−1and b )10m.s−1.
(a) (b)
Figure 4.12: 100% JF droplet impingement with a crossflow velocity of: a) 7 m s−1 and b)
Similar to the case stated before, in Figure 4.12a is displayed the development of impingement of a droplet of 100% JF. Here, after the moment of impact, it is possible to notice the development of prompt splash downstream, τ = 0.07. These tiny droplets build up while the lamella spreads, moving in the direction of the flow, τ = 1.52. Figure 4.12b displays the development of a droplet of the same fluid but influenced by Ucf= 10m.s−1. Due to the shear forces and internal flow of
the droplet, this droplet is deformed in a way that the side is flatten resulting in a cap shape geometry. The increasing of crossflow velocity works in way that smooths the small droplets presented on the case before and no secondary atomization is observed, τ = 0.09.
4.1.3.3 75%JF ‐ 25% HVO impingement
Figure 4.13 displays the impingement for a 75% JF ‐ 25% HVO droplet with an influencing cross‐ flow of a) 7m.s−1and b) 10m.s−1.
(a) (b)
Figure 4.13: 75% JF ‐ 25% HVO droplet impingement with a crossflow velocity of: a) 7 m s−1and b) 10 m s−1.
The development of a 75% JF ‐ 25% HVO droplet impinging on a surface with the influence of a crossflow with Ucf = 7m.s−1 is displayed in Figure 4.13a. As already stated in section 4.1.2,
when the drop impacts the surface, asymmetric corona splash occurs, τ = 0.12. The lamella lifts off around the drop contact line in an azimuthally asymmetric form, i.e., it gradually decreases in the azimuthal direction along the lamella contact line from points φ = 0◦ to φ = 180◦. Figure 4.13b displays the development of the droplet influenced by a crossflow of Ucf = 10m.s−1.
The increasing of tangential velocity smooths the secondary droplets upstream and prompt‐ corona splash occurs, τ = 0.17, i.e., detachment of tiny droplets from the advancing contact line at upstream and corona splashing at downstream.
A crossflow velocity of Ucf = 12m.s−1 was also tested for this fuel mixture. However, due to
the proximity of this velocity to the breakup regime, two outcomes are observed, Figure 4.14.
(a) (b)
Figure 4.14: Outcomes of 75% JF ‐ 25% HVO droplet impingement with a crossflow velocity of 12 m s−1.
Two deformation shapes were observed: for the first , the outcome is prompt splash downstream
τ = 0.17, Figure 4.14a. The increase of crossflow velocity will act so that the flow decreases the occurrence secondary dropltes. However, when the deformation of the droplet is transversal, Figure 4.14b, crown splash is observed, τ = 0.11.
4.1.3.4 50%JF ‐ 50% HVO impingement
Figure 4.15 displays the impingement for a 50% JF ‐ 50% HVO droplet with an influencing cross‐ flow of a) 7m.s−1and b) 10m.s−1.
(a) (b)
Figure 4.15: 50% JF ‐ 50% HVO droplet impingement with a crossflow velocity of: a) 7 m s−1and b) 10 m s−1.
Figure 4.15a displays the development of impingement of a droplet of 50% JF ‐ 50% HVO under the influence of a crossflow of Ucf= 7m.s−1. Here, after the moment of impact, it is possible
to notice the development of prompt splash downstream, τ = 0.16. This tiny droplets build up while the lamella spreads, moving in the direction of the flow, τ = 1.03.
When the crossflow velocity is increased to Ucf = 10m.s−1, no secondary atomization occurs,
τ = 0.17. Similar to the case stated in section 4.1.3.2, the flow acts to smooth the small droplets, suppressing the prompt splash.
4.2
Splash‐Threshold
As described in the bibliographic contextualization, several criteria were presented in order to establish the transition between deposition and splash regimes. In this chapter are presented the results obtained for each impact condition.
The first subsection is devoted to the normal impact and the second is dedicated to the crossflow impact. The objective of this study is to verify the experimental results with the empirical correlations.
4.2.1
Normal Impact
The transition between deposition and splash is presented, in this subsection, for the normal impact and for each fluid studied. The drops’ absolute velocity is increased by increasing the impact height (needle to surface height). Table 4.1 represents the parameters inherent for each fluid deposition/splash transition such as impact velocity, droplet diameter and non‐dimensional numbers.
Table 4.1: Deposition/splash threshold for normal impact.
100%JF 75%JF ‐ 25% HVO 50%JF ‐ 50% HVO H2O
Regime Deposition Splash Deposition Splash Deposition Splash Deposition Splash
D0[mm] 3.0 3.1 3.1 4.1 U0[m.s−1] 1.7 1.9 1.9 2.2 1.7 1.8 2.2 2.4 We 262 328 337 478 293 331 286 340 Re 3563 3987 3198 3808 2349 2496 9190 10018 Oh.103 4.5 5.7 7.3 1.8 La 48475 30307 18850 298480 Ca 0.07 0.08 0.11 0.13 0.12 0.13 0.03 0.03 Bo 2.8 2.9 3.0 2.3 Fr 94 118 115 163 97 109 125 149
The dynamic behaviour of a droplet impinging onto a surface is mainly dependent on the physical properties of the fluid. Once droplet diameter between the mixtures differs due to surface tension, a greater surface tension means a greater diameter for the same injection needle. The droplet initial diameter has a direct influence on the impact velocity needed for the oc‐
currence of splash. As expected, H2Orequires a higher velocity for the transition between
deposition and splash. Although the jet fuel mixtures present the same diameter, their surface tension diverges enough to alter the transition velocity. Therefore, 75% JF ‐ 25% HVO transition velocity is higher than 100% JF, in its turn is higher than 50% JF ‐ 50%HVO.
As referred above, three criteria are used to verify the experimental results. According to ref. [17], for a dry surface, the splash threshold takes’ into consideration the A coefficient, which depends on the surface roughness (Ra). Using a equation developed by ref. [5] that interpolates the data provided in table 2.2 to obtain the correct value for A (approximately A = 4193 for Ra = 0.19 µm. Therefore, the criteria translates into:
W ec= 4193.La−0.18 (4.1)
In order to compare the results with other criteria, ref. [5] transformed the Weber and Laplace numbers in to Reynolds and Ohnesorge numbers respectively. The equation is presented as:
Oh.Re1.218= A0.6097 (4.2)
Two more criteria were used to verify the experimental results with the empirical correlation, [11, 37]. The equations regarding these thresholds are presented in section 2.4 and only depend on Reynolds and Ohnesorge numbers.
Ref. [11] proposed a splashing threshold based on the correlation presented below. In their experiments, the authors used a rotation disk in order to create the air boundary layer.
Kc= Oh.Re1.25= 57.7 (4.3)
Ref. [37] determined an empirical correlation for the deposition/splash transition using Oh and Re numbers, presented as:
Kc= Oh.Re0.609= 0.85 (4.4)
In Figure 4.16 is displayed the experimental results obtained for the deposition/splash transi‐ tion for normal impact compared to the empirical correlations proposed by refs. [11, 17, 37]. Each fluid has a different symbol, and when the symbol is filled, splash occurs. Regarding the mixtures, it is possible to notice that the transition between non‐splash/splash fits well for the
correlation proposed by [37]. However, both 100% JF and H2Oare plotted in the deposition
proposed by ref. [11], all of the present experimental results are found in the splash region proposed by the authors. One of the reasons for this to happen is the fact that, in their experi‐ ments a rotating disk is used which will alter the conditions of impact. Consequently, the drops will impact the surface with a certain angle.
Both the criteria proposed by refs. [17, 37] provide a great adjustment for all the fluids, since all the results seem to follow a similar tendency. Ref. [37] used an aluminium disk with a mean surface roughness of less than 10 nm, which could explain the proximity of the experimental results with their correlation.
0 0.2 0.4 0.6 0.8 1 1.2 1.4 1.6 1.8 2
Re
×104 0 0.001 0.002 0.003 0.004 0.005 0.006 0.007 0.008 0.009 0.01O
h
100% JF (No Splash) 100% JF (Splash)75% JF - 25% HVO (No Splash) 75% JF - 25% HVO (Splash) 50% JF - 50% HVO (No Splash) 50% JF - 50% HVO (Splash) H
2O (No Splash)
H
2O (Splash)
Bai and Gosman (1995) Mundo et al. (1995) Vander Wal et al.(2005)
Figure 4.16: Deposition/splash transition results for normal impact plotted against proposed correlations.
4.2.2
Impact with Crossflow
As previously mentioned in the literature, the crossflow may deform the droplet, creating an impact angle (θ) defined as the angle formed between the impact surface and the absolute velocity of the droplet. The following results will present three types of velocity, which are the absolute velocity (U), normal velocity (Un) and tangential velocity (Ut). Table 4.2 displays the
droplets’ diameter, impact velocity components and the non‐dimensional numbers regarding the impact with a crossflow velocity of 7 m s−1.
Once the transition is found for normal impact, and droplet velocity is defined, the crossflow is used to verify the permanence of splash condition. As seen in the experimental results once this crossflow is employed, splash condition is no longer verified for the same impact velocity. Therefore, drop hight release is increased to find the non‐splash/splash transition for impact with crossflow. Results show that the impact angle is higher for H2Oand lower for 100% JF.
Within the other two mixtures, the impact angle is higher for 50% JF ‐ 50% HVO than for 75% JF ‐ 25% HVO. It is suggested that an increase of normal velocity will decrease the effect of the crossflow. This was verified for all fluids except for 75% JF ‐ 25% HVO that has a minimal difference. This may occur due to systematic errors from centroid determination and image acquisition, as the difference of tangential velocity is also very small for all of the other fluids.
Table 4.2: Deposition/splash threshold for droplet impact under influence of a 7 m s−1crossflow velocity.
100%JF 75%JF ‐ 25% HVO 50%JF ‐ 50% HVO H2O
Regime Deposition Splash Deposition Splash Deposition Splash Deposition Splash
D0[mm] 3.0 3.1 3.1 4.1 U0[m.s−1] 2.2 2.3 2.6 2.8 1.9 2.0 2.8 2.9 Ut[m.s−1] 1.0 0.9 0.8 0.8 0.5 0.4 0.4 0.3 Un[m.s−1] 2.0 2.1 2.5 2.7 1.8 1.9 2.8 2.9 θ[◦] 65 73 76 83 We 456 498 738 795 356 388 456 468 Re 4703 4915 4729 4909 2599 2704 11663 11813 Oh.103 4.5 5.7 7.3 1.8 La 48475 30307 18850 298480 Ca 0.1 0.1 0.14 0.16 0.14 0.14 0.04 0.04 Bo 2.8 2.9 3.0 2.3 Fr 165 180 216 271 117 128 201 207
Figure 4.17 presents the experimental data obtained for the deposition/splash transition for an impact with a crossflow velocity of 7 m s−1 plotted against the correlations proposed by refs. [11, 17, 37]. 0 0.2 0.4 0.6 0.8 1 1.2 1.4 1.6 1.8 2
Re
×104 0 0.001 0.002 0.003 0.004 0.005 0.006 0.007 0.008 0.009 0.01O
h
100% JF (No Splash) 100% JF (Splash)75% JF - 25% HVO (No Splash) 75% JF - 25% HVO (Splash) 50% JF - 50% HVO (No Splash) 50% JF - 50% HVO (Splash) H
2O (No Splash)
H
2O (Splash)
Bai and Gosman (1995) Mundo et al. (1995) Vander Wal et al.(2005)
Figure 4.17: Deposition/splash transition results for impact under the influence of 7 m s−1cross‐ flow velocity plotted against proposed correlations.
![Figure 2.1: Visual representations of impact angles: a) normal impact, b) impact angle with a crossflow effect adapted from [5].](https://thumb-eu.123doks.com/thumbv2/123dok_br/18206025.876358/22.892.115.738.778.1037/figure-visual-representations-impact-angles-normal-crossflow-adapted.webp)
![Figure 2.3: Illustration of parameters governing the impact of a liquid drop adapted from [15].](https://thumb-eu.123doks.com/thumbv2/123dok_br/18206025.876358/24.892.109.746.343.1013/figure-illustration-parameters-governing-impact-liquid-drop-adapted.webp)
![Figure 2.5: Spread/deposition regime adapted from [18].](https://thumb-eu.123doks.com/thumbv2/123dok_br/18206025.876358/25.892.308.627.711.1008/figure-spread-deposition-regime-adapted-from.webp)
![Table 2.1: Relation between the six outcomes and boundary conditions adapted from [9].](https://thumb-eu.123doks.com/thumbv2/123dok_br/18206025.876358/27.892.147.787.901.995/table-relation-outcomes-boundary-conditions-adapted.webp)
![Figure 2.13: Impact with crossflow influence [36].](https://thumb-eu.123doks.com/thumbv2/123dok_br/18206025.876358/29.892.241.696.511.958/figure-impact-with-crossflow-influence.webp)
![Figure 3.2: Wind tunnel schematics with element placement [36].](https://thumb-eu.123doks.com/thumbv2/123dok_br/18206025.876358/34.892.207.650.371.625/figure-wind-tunnel-schematics-element-placement.webp)