ISSN 0104-6632 Printed in Brazil
www.abeq.org.br/bjche
Vol. 24, No. 01, pp. 29 - 36, January - March, 2007
Brazilian Journal
of Chemical
Engineering
A STUDY OF PROCESS VARIABLES FOR
THE PHOTOCATALYTIC DEGRADATION
OF RHODAMINE B
E. T. Soares
1, M. A. Lansarin
1*and C. C. Moro
21
Chemical Engineering Department, Universidade Federal do Rio Grande do Sul, Phone: +(55) (51) 3316-3952, Fax: +(55) (51) 3316-3277, Engenheiro Luiz Englert s/n.,
CEP 90040-040, Porto Alegre - RS, Brazil. E-mail: [email protected], E-mail: [email protected].
2
Solids and Surface Laboratory. IQ/UFRGS. Cx P. 15003. Phone +(55) (51) 3316-7219CEP: 91501-970, Porto Alegre - RS, Brazil.,
E-mail: [email protected].
(Received: March 28, 2005 ; Accepted: November 23, 2006)
Abstract - The photoactivated degradation reaction of rhodamine B (RB) was studied using P-25 TiO2 (Degussa) as catalyst. Three process variables – temperature, initial pH, and catalyst concentration – were evaluated. Temperature had a slight effect on reaction rate; however, the combined effect of pH and catalyst concentration was greater. pH affected the catalyst particle’s adsorption of RB, altering the reaction rate. The concentration of the catalyst was significant only up to 0,65 g L-1. The effect of temperature was studied at optimum pH and 50ºC was found to be the optimum operational temperature. The effect of the presence of a surfactant (sodium dodecylsulfate, SDS) and ionic contaminants (Cl- and SO4--) in the reaction system was also studied. The surfactant improved the catalyst’s adsorption of RB by more than 80%, increasing the degradation reaction rate as well. The ionic contaminants reduced the reaction rate.
Keywords: Photocatalysis; Photocatalytic degradation; Dyes; Rhodamine B; TiO2.
INTRODUCTION
The contamination of water supplies by organic molecules is an increasing problem mainly because many of these molecules are not readily degraded by conventional methods for the treatment of effluents (Matthews, 1991; Gogate and Pandit, 2004). This problem has increased with the development of the textile industry because many of the pollutants are dyes used by them. Besides causing visual pollution, this kind of pollutant has high levels of toxicity, nonbiodegradability and resistance to destruction (Wu and Zhang, 2004).
Rhodamine B (RB, C28H31N2O3Cl) is one of the
most important dyes of the xanthene group and is used in many industrial processes, such as paper dyeing and the production of dye laser (Ma and Yao, 1998).
The main technologies available for the treatment of dyes involve the transfer of the pollutant from a liquid phase to another phase, concentrating the dye on an adsorbent, for example, so that it can later be discarded in a landfill or incinerated. This phase exchange is not an ideal remedy; destructive oxidation treatments provide more permanent solutions (Matthews, 1991). An alternative for the removal of dyes is photocatalytic degradation. This kind of process enables the complete destruction of the pollutant and has been studied thoroughly during the past 20 years, especially for liquid and gaseous effluents (Liqiang et al., 2003).
enhances the rate of free radical generation, and hence the rate of degradation. When a catalyst is illuminated by a photon with a wavelength longer than the difference between its valence band and its
conduction band, an electron is promoted (
e
−CB),creating an electron-hole pair. This hole (
h
+VB) has apositive charge and reacts with the adsorbed water molecules on the surface of the solid, producing the radical OHº, which has great potential oxidization of organic molecules. The simplified mechanism is shown in equations 1, 2, 3, and 4 (Ma and Yao, 1998; Almquist and Biswas, 2001; Gogate and Pandit, 2004).
2 VB CB
+ TiO +→h+ +e−
h ν ν ν ν
(1)
-CB 2 2
e− + O → O (2)
0
VB 2 ads ads ads
h+ + H O →H +H+ (3)
0
ads 2 ads
H + RB → Products + H O (4)
In the above equations, “hν” represents the
photon that initiates the reaction and the subscript
"ads" indicates that molecules are adsorbed on TiO2.
Once the reaction has begun, the molecules generated by the oxidation of the RB (products) can
be adsorbed on the TiO2 and oxidized again, due to
the constant formation of OH° during the irradiation period (Ma and Yao, 1998; Almquist and Biswas, 2001; Gogate and Pandit, 2004).
Published studies have dealt with the degradation
of RB using TiO2 films (Ma and Yao, 1998, 1999;
Ma et al., 2001; Wu and Zag, 2004) using
sand-supported TiO2 (Matthews, 1991) and ZnO as
catalyst (Yu et al., 2004). However, no study was found that evaluated the effect of process variables,
such as temperature, pH, and TiO2 concentration, on
the velocity of degradation of the RB. This effect is the main objective of the present paper.
The catalyst used was Degussa P-25, considered
to be the most efficient in photoactivated reactions (Hermann, 1999; Gogate and Pandit, 2004).
EXPERIMENTAL
The catalyst used was P-25 titanium dioxide
(TiO2) with a 30 nm mean particle size and a BET
surface area of 50 m2 g-1, supplied by Degussa. The
UV radiation source was a black light lamp, capable of emitting UV radiation within the range of 320 to 400 nm with the maximum peak at 352 nm, which is the best range for the catalyst (Hermann, 1999). The greatest advantage to using a black light lamp is that they are considered cold lamps, i.e., they emit very little radiation in the infrared range, resulting in slight heating of the solution.
The rhodamine B was obtained from Grupo
Química. A solution of 0.01 mol L-1 NaOH was
prepared to adjust the pH of the system. The surfactants SDS, sodium chlorate, and sodium sulfate were PA grade. The entire water supply used had been previously distillated and deionized.
A solution of 800 mL RB – with a 20 mg L-1 (4.2
105 mol L-1) concentration and the P-25 catalyst – was
irradiated (3.8 mW cm-2) in a glass reactor. The reactor
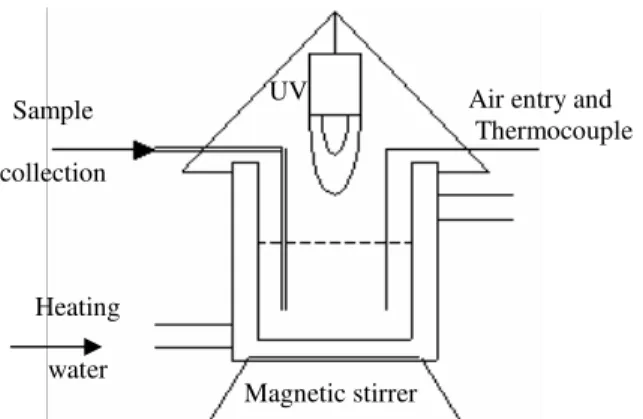
was open to the atmosphere, was jacketed and had the following internal dimensions: 10 cm in diameter and 13 cm in height. The reaction system temperature was monitored with a thermocouple and kept constant by a thermostatic bath. Magnetic stirring was used to maintain homogeneity and air was inserted at the bottom of the reactor by an air compressor.
The radiation source was placed 2 cm above the solution level. All compounds were fixated in a way that their relative positions were not altered from one experiment to the next. The top part of the reactor, open to the atmosphere, was protected by aluminum foil, as were the sides and the bottom of the reactor in order to guarantee maximum use of the radiation and to prevent the effects of external radiation. Samples were collected with the help of a syringe. An illustration of the reactor can be seen in Figure 1.
Figure 1: Schematic diagram of the photocatalytic reactor. Sample
collection
Heating
water
Magnetic stirrer
UV Air entry and
Preliminary Tests and Analysis Methodology
The reaction was monitored by the discoloration of the reaction system, using a Carry-300 spectrophotometer. The first step was to perform a scan from 200 to 800 nm with the objective of choosing the wavelength that had the highest absorbency of a RB solution. The wavelength chosen was 553 nm. In order to determine the concentration of the remaining dye a correlation curve was made by measuring the absorbency of RB solutions with
known concentrations. A 0.993 correlation
coefficient was found for the relation between absorbency and concentration.
The method chosen to separate the catalyst from the samples collected was centrifugation. Filtering of the samples was not an option due to the filter’s adsorption of the dye, increasing the error. To assure that the catalyst would not interfere with the measurements, tests were carried out where the duration of centrifugation was gradually increased until the absorbency of the centrifuged solution was the same or lower than that of the solution without the addition of a catalyst.
Another important test carried out was the
analysis of the adsorption of rhodamine by titanium dioxide. It was observed, through experiments conducted without the use of light – dark experiments – that after one hour the adsorbed amount reached a constant value. Based on this, the reaction system was maintained in the dark and under constant stirring with a magnetic stirrer for one hour to improve contact between RB molecules and
TiO2 particles. This phase, prior to activation of the
radiation source, is important to assure that when the reaction begins, the variation in dye concentration due to degradation is not mistaken for the variation due to adsorption. Degradation tests carried out
without TiO2 did not demonstrate meaningful
degradation, supporting the photocatalytic
characteristic of the RB degradation.
Study of Significant Parameters
With the objective of conducting an initial evaluation of three important parameters of
photocatalysis (Gogate and Pandit, 2004),
temperature, pH, and catalyst concentration, an
experimental factorial (23) planning shown in Table
1 was employed.
Table 1: Configuration adopted for the factorial planning.
Variable Symbol - +
Temperature (ºC) X1 40 50
pH X2 6 8
Catalyst concentration (g L-1) X3 0.2 0.3
Besides the variables of the operation, the possible effect of chemical species on the adsorption of RB and, consequently, on the reaction rate was investigated. The chemicals studied were an ionic surfactant, sodium
dodecylsulfate (CH3(CH2)11OSO3Na, SDS), and two
inorganic salts, NaCl and Na2SO4.
According to the literature (Zhao et al., 1998), the surfactant was expected to increase the catalyst’s adsorption of RB. Experiments were therefore carried out to evaluate how the increase in adsorption affects the reaction rate of RB degradation. The radiation source used was UV light, complementing the work of Zhao, where visible light was used.
The Cl- and SO4
ions reduce the catalyst’s adsorption of the dye (Gogate and Pandit, 2004). Furthermore, these ions can react with the OH° radicals and absorb UV radiation, which also reduces the reaction rate.
The response variable chosen to analyze the
effect of the alteration of each process variable was the apparent velocity of the reaction (k) assuming a first-order reaction. The value for k was calculated based on research presented by Ma and Yao (1999), assuming the reaction obeys pseudo-first-order kinetics. The degradation rate is shown in Equations 5 and 6, where "C" represents the dye concentration and "t" the time.
-dC / dt = k C (5)
0
ln (C /C) = k t (6)
Beer’s law says that ln(C0/C) equals ln(A0/A),
where A0 is the solution absorbency at time zero and
A is the solution absorbency at a time t, after turning on the lamp. Based on this relation, graphs showing
ln(A0/A) versus time were made, where k was
of the pseudo-first-order approximation can be verified by the correlation coefficient.
RESULTS AND DISCUSSION
Factorial Planning
The values obtained for k in each experiment are shown in Table 2, along with the mean of the deviations in relation to the mean of each repetition.
Based on the values obtained for k and the mean deviation observed, the effects were evaluated. The analysis of these seven effects – of the first, second, and third order – was done by analysis of variance (ANOVA: Analysis of Variance), through routine
calculations implemented with Matlab software.
Of the effects studied, only two can be considered significant: temperature and the interaction between pH and catalyst concentration. Mathematically, this implies that the means of the groups that make up the
two levels of these effects can be considered significantly different.
The significance of this second-order effect can be explained by the effect of pH on RB adsorption by the catalyst. At a pH of 8 the absorbency is higher, and because of this, the effect of catalyst concentration is felt more at this pH than at pH 6.
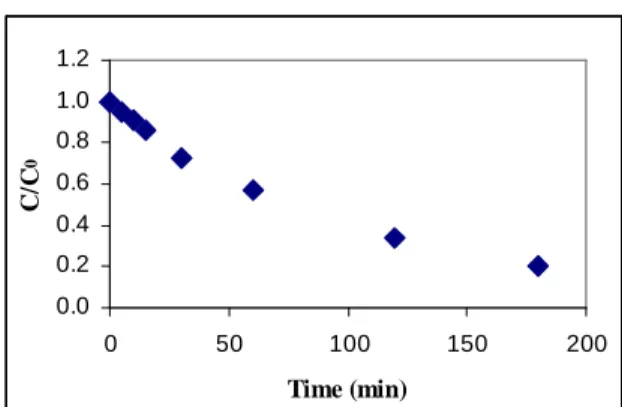
In Figure 2 the variation in RB concentration during the degradation reaction is shown for experiment 8 of the experimental planning, which had the highest degradation apparent velocity.
For a reaction time of three hours, the initial
concentration measured was 16.94 mg L-1 and the
final concentration was 3.4 mg L-1. This variation in
concentration, 13.54 mg L-1 in 3 hours, corresponds
to a degradation of approximately 80%.
Linearization of the curve in Figure 2 is shown in Figure 3, where ln(A0/A) is related to reaction time.
This graph demonstrates that the degradation reaction corroborates the pseudo-first- order kinetics, since the correlation coefficient of the tendency line was 0.99931.
Table 2: Results of the factorial planning.
Exp. X1 X2 X3 Mean k (min-1103) Deviation %
1 - - - 8.51 2.99
2 + - - 9.40 2.71
3 - + - 7.95 1.16
4 + + - 8.29 4.20
5 - - + 8.48 2.30
6 + - + 9.23 1.00
7 - + + 9.56 5.68
8 + + + 9.68 5.66
Mean value of the deviation 3.21
0.0 0.2 0.4 0.6 0.8 1.0 1.2
0 50 100 150 200
Time (min)
C
/C
0
Figure 2: Variation in RB concentration with time. (T = 50ºC, pH = 8,
R2 = 0.99931
0.0 0.5 1.0 1.5 2.0
0 50 100 150 200
Time (min)
L
n
(
A
0
/
A
)
Figure 3: Linearization of the curve in Figure 2. (T = 50ºC, pH = 8,
and catalyst concentration = 0.3 g L-1).
Effect of pH
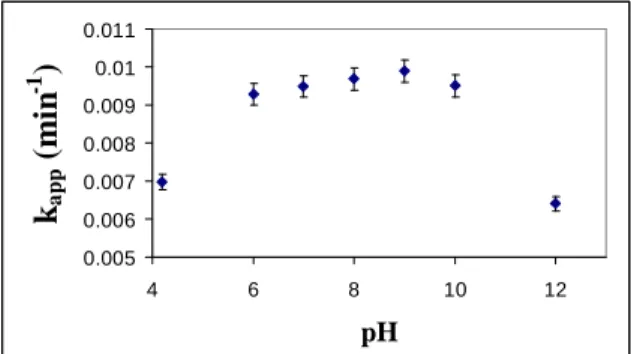
Since the experimental planning showed that for a variation in pH from 6 to 8, the reaction rate was not significantly affected, five more tests were carried out for pH 4.3 (natural pH of the solution), 6, 7, 9, 10, and 12. In Figure 4, the values for the apparent velocity of the reaction are shown as a function of the initial pH of the system.
The variation in pH within the range of 6 to 10 does not significantly affect the degradation rate of the rhodamine. This result confirms what was observed through the experimental planning. When the initial pH falls outside this range, either above or below, an average reduction of the reaction rate of approximately 28% can be seen. This value is higher
than that of the experimental error, which was 3.2%. This result differs from that presented by Yu et al. (2004), where the catalyst used was ZnO. In this study, an optimum range of 6 to 7 was obtained for the pH, with a low velocity for values of pH that were more acid than 6 or more basic than 7. The difference between results can be attributed to the different type of catalyst used. This observation is sustained by the work presented by Gogate and Pandit (2004), where the authors suggest that experiments should be carried out to obtain the effect of the variation in pH for each substratum-catalyst pair.
With the intention of maximizing the catalyst adsorption of the substratum, a pH of 8 was chosen for the experiments to analyze the effect of temperature.
0.005 0.006 0.007 0.008 0.009 0.01 0.011
4 6 8 10 12
pH
ka
p
p
(
m
in
-1 )
Figure 4: Variation in apparent rate of reaction with initial pH.
(T = 50ºC; catalyst concentration = 0.3 g L-1).
Effect of Catalyst Concentration
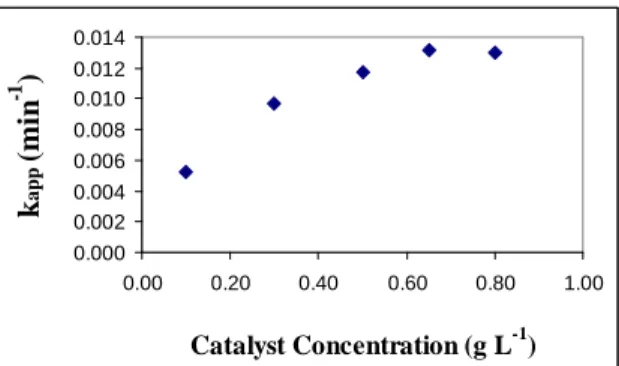
The effect of catalyst concentration can be seen in Figure 5, which contains the values of apparent reaction ratefor different concentrations of catalyst in g L-1.
In analyzing Figure 5, it can be seen that the
apparent reaction rate increases with the increase in
catalyst concentration up to a concentration of 0.65
g L-1, which corresponds to an apparent velocity of
13.55 10-3 min-1. Beyond this value the rate tends to
stabilize and the there is a smaller alteration with the
increase in catalyst concentration.
0.000 0.002 0.004 0.006 0.008 0.010 0.012 0.014
0.00 0.20 0.40 0.60 0.80 1.00
Catalyst Concentration (g L-1)
k
a
p
p
(
m
in
-1 )
Figure 5: Variation in apparent reaction rate with catalyst concentration. (T = 50ºC; pH = 8).
Effect of Temperature
The effect of temperature on the apparent velocity of the reaction is shown in Figure 6. It can be observed that the optimum range of operational temperatures is from 40 to 50ºC, corroborating what was observed through the experimental planning, where the increase from 40 to 50ºC did not significantly affect the reaction rate.
The fact that a photocatalytic reaction has a point or
an optimum range of operation between 20 and 80°C is
mentioned by Hermann (1999) as well as by Gogate and Pandit (2004). When working at a low temperature, the desorption of the products formed limits the reaction because it is slower than the degradation on the surface and the adsorption of the reactants. On the other hand, at a higher temperature, the limiting stage
becomes the adsorption of the dye on the TiO2.
The previously mentioned authors foresee an optimum range of temperature with a small effect on reaction rate, as long as the experiment is carried out near the middle of the range of 20 to 80ºC.
0.002 0.004 0.006 0.008 0.01 0.012
20 30 40 50 60 70 Temperature (oC)
ka
p
p
(
m
in
-1 )
Figure 6: Variation in apparent reaction rate with operational temperature.
(pH = 8; catalyst concentration = 0.3 g L-1).
Effect of Surfactant
In Table 3 how SDS concentration affects the catalyst’s adsorption of the RB is shown. In all three cases (without SDS, with SDS at 0.12 mM, and at 0.24 mM), catalyst concentration and dark time adsorption were the same. The quantity adsorbed, however, increased slightly with SDS concentration.
An increase of almost 88% in the catalyst’s adsorption of RB can be observed when comparing the experiment without SDS to the experiment with 0.12 mM of SDS. When the concentration of SDS is
doubled, the increase is approximately 80%. When surfactant concentration is increased, the apparent reaction rate also increases as can be seen in Table 3. These results confirm those presented by Zhao and coworkers (1998), where similar behavior was observed for adsorption with dodecylbenzenesulfonate, DBS, which is from the same class as SDS.
This behavior can be explained by the fact that Zhao et al. (1998) used another radiation source, visible light, which is a different mechanism. Visible light is preferentially absorbed by the dye, which needs to be adsorbed by the catalyst in order to inject the electrons to begin the photocatalytic reaction. This activation mechanism is known as photo-assisted (Serpone and Emeline, 2002) and is strongly dependent on the dye adsorption.
In this study, UV radiation was used, since it is efficiently absorbed by the catalyst, thus having a smaller effect on dye adsorption.
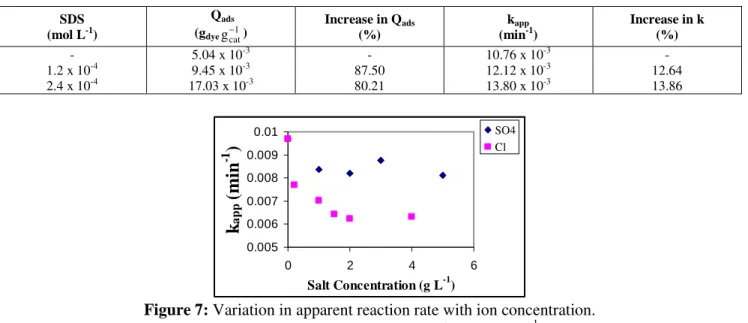
The Effect of Ionic Species
The results on the effect of the Cl- and SO4
--
ions are presented in Figure 7. It is shown that both ions significantly affect the degradation rate.
Cl- was the ion that had the most negative effect,
causing a rate reduction of 30% with a salt
concentration of 1 g L-1. With the same concentration
of SO4
-, a reduction of 14% was observed. These
results are compatible with the work presented by
Gogate and Pandit (2004), i.e., that the Cl- ion is
more harmful to the reaction than the SO4
ion.
Table 3: Comparison between the effects of SDS concentration on dye adsorption (Qads) and on apparent reaction rate (kapp).
0.005 0.006 0.007 0.008 0.009 0.01
0 2 4 6
Salt Concentration (g L-1)
k
app
(
m
in
-1
)
SO4 Cl
Figure 7: Variation in apparent reaction rate with ion concentration.
(pH = 8; T = 50ºC; catalyst concentration = 0.3 g L-1).
CONCLUSIONS
Process variables, such as operation temperature, initial pH, and catalyst concentration significantly affect the photoactivated process. These processes were efficient in the degradation of RB, a dye of industrial importance. For the configuration used, the optimum ranges of temperature (40-50ºC), pH (6-10), and
catalyst concentration (0.65 g L-1) were determined.
The temperature was the variable with the smallest effect, especially for values near 50ºC. This temperature corresponds to exactly half the range between 20 and 80ºC, which is considered to be the range where photocatalysis is applicable.
The effect with sodium dodecylsulfate (SDS) acting as surfactant was also evaluated. The surfactant was able to increase adsorption of the dye on the catalyst without a comparable increase in reaction rate.
Finally, the effect of Cl- and SO4 --
ions on the reaction rate was observed. These contaminants, which are very common in industrial effluents, had a negative
effect on the reaction rate, with the Cl- harmful.
ACKNOWLEDGEMENTS
Special thanks are extended to CAPES for their financial support and to Degussa for supplying the catalyst.
NOMENCLATURE
A Solution absorbency (-)
C Dye concentration (mg L-1)
−
CB
e
Electron with a negative chargecreated in the catalyst particle
(-)
SDS (mol L-1)
Qads
(gdyegcat−1)
Increase in Qads
(%)
kapp
(min-1)
Increase in k (%)
- 5.04 x 10⁻³ - 10.76 x 10⁻³ -
1.2 x 10⁻⁴ 9.45 x 10⁻³ 87.50 12.12 x 10⁻³ 12.64
+
VB
h
Hole with a positive chargecreated in the catalyst particle
(-)
hv Photon that initiates the
reaction
(-)
k Apparent velocity of the
reaction
(min-1)
t Time (min)
Subscripts
0 Indicates the beginning of the reaction, the
moment when the lamp is turned on;
ads Indicates that the species has been adsorbed
on the catalyst surface;
CB Indicates that the species is in the conduction
band of the TiO2;
VB Indicates that the species is in the valence
band of the TiO2.
REFERENCES
Almquist, C.B. and Biswas, P., A mechanistic approach to modeling the effect of dissolved oxygen in photo-oxidation reactions on titanium
dioxide in aqueous systems, Chemical
Engineering Science, 56, No. 11, 3421 (2001). Gogate, P.R. and Pandit, A.B., A review of
imperative technologies for wastewater treatment I: Oxidation technologies at ambient conditions, Advances in Environmental Research, 8, No. 3-4, 501 (2004).
Hermann, J., Heterogeneous photocatalysis:
Fundamentals and applications to the removal of various types of aqueous pollutants, Catalysis Today, 53, No. 1, 115 (1999).
Liqiang, J., Xiaojun, S., Jing, S., Weimin, C., Zili, X., Yaoguo, D. and Honggang, F., Review of surface photo-voltage spectra of nano-sized semiconductor and its applications in heterogeneous photocatalysis,
Solar Energy Materials and Solar Cells, 79, No. 2, 133 (2003).
Ma, Y. and Yao, J., Photodegradation of rhodamine
B catalyzed by TiO2 thin films, Journal of
Photochemistry and Photobiology A: Chemistry, 116, No. 2, 167 (1998).
Ma, Y. and Yao, J., Comparison of photodegradative rate of Rhodamine B assisted by two kinds of
TiO2 films, Chemosphere, 38, No. 10, 2407
(1999).
Ma, Y., Qiu, J., Cao, Y., Guan, Z. and Yao, J.,
Photocatalytic activity of TiO2 films grown on
different substrates. Chemosphere, 44, No. 5, 1087 (2001).
Matthews, R.W., Photooxidative degradation of coloured organics in water using supported
catalysts: TiO2 on sand, Water Research, 25, No.
10, 1169 (1991).
Serpone, N. and Emeline, A.V., Suggested terms and definitions in photocatalysis and radiocatalysis, International Journal of Photoenergy, 4, 91 (2002).
Wu, J. and Zhang, T., Photodegradation of rhodamine B in water assisted by titania films prepared through a novel procedure. Journal of Photochemistry and Photobiology A: Chemistry, 162, No. 1, 171 (2004).
Yu, D., Cai, R. and Liu, Z., Studies on the
photodegradation of rhodamine dyes on
nanometer-sized zinc oxide, Spectrochimica ACTA Part A: Molecular and Biomolecular Spectroscopy, 60, No. 7, 1617 (2004).