Lipoprotein (a) is Associated with Basal Insulin Levels in Patients
with Type 2
Diabetes Mellitus
Syed Shahid Habib, Muhammad Aslam, Syed Fayaz Ahmad Shah, Abdul Khaliq Naveed
King Khalid University Hospital, King Saud University, Riyadh, Saudi Arabia1; Army Medical College, Rawalpindi, Pakistan2Summary
Background: It has not been clearly established whether insulin resistance/deficiency leads directly to atherogenesis or through its association with other risk factors such as Lipoprotein(a) [Lp(a)].
Objective: This project aimed at studying the association between basal Insulin, Lipids and Lipoprotein(a) levels in Patients with Type 2 diabetes mellitus.
Methods: Fasting blood samples were analyzed for Insulin, Lipoprotein(a), total cholesterol (TC), triglycerides (TG), low density lipoprotein cholesterol (LDL-C), high density lipoprotein cholesterol (HDL-C), glucose and glycosylated hemoglobin (HbAc) levels in 60 patients with type 2 diabetes mellitus (DM) and 28 healthy subjects. We divided
patients into two groups based on basal insulin levels: ≥ 10 µIU/ml and < 10 µIU/ml.
Results: Insulin levels were higher in diabetic versus control individuals [p < 0.05]. TC (p< 0.0), LDL-C (p< 0.05), TC/ HDL ratio (p< 0.0) and TG levels (p< 0.05) were higher and HDL- C levels were significantly lower (p < 0.00) in both diabetic groups as compared to control. Lp(a) levels were significantly higher in both diabetic groups, when compared
to the control group. Lp(a) levels were significantly lower in diabetics with basal insulin ≥ 10 µIU/ml when compared to those with basal insulin < 10 µIU/ml (p < 0.05). Regression analysis revealed a significant relationship of Lp(a) with
insulin levels (r = 0.262, p < 0.05) and Insulin Glucose ratio (r = 0.257, p < 0.05).
Conclusion: Lp(a) levels correlate inversely with insulin levels in type 2 diabetic patients. Lp(a) may be one of the cardiovascular risk factor in type 2 diabetic patients with longer duration of dm. (Arq Bras Cardiol 2009;93():25-30)
Key words:Diabetes mellitus; dyslipidemias; lipoprotein (a), insulin.
Mailing address: Syed Shahid Habib •
King Saud University, 11461, Riyadh, Saudi Arabia E-mail: [email protected]
Manuscript received December 08, 2007; reviewed manuscript received February 08, 2008; accepted March 03, 2008.
Introduction
Among the most common chronic disorders of modern times, diabetes mellitus (dm) remains unique because of its multisystem ramifications. The combination of hypertension, dyslipidemia, insulin resistance, hyperinsulinemia, glucose intolerance and obesity, particularly central obesity, has been termed “metabolic syndrome”1,2, which is a powerful
determinant of type 2 DM and cardiovascular disease3.
Patients with type 2 DM have defects in insulin secretion in response to a glucose load and resistance to insulin action4,5.
Three phases can be recognized in the pathogenesis of type 2 dm4,6,7. In the first phase, plasma glucose remains normal
despite insulin resistance because insulin levels are elevated. In the second phase, insulin resistance worsens despite elevated insulin concentration and glucose intolerance manifests as postprandial hyperglycemia. In the third phase, insulin secretion decreases, with progressive loss of beta cells8.
Plasma insulin concentrations aredetermined by both insulin resistance and insulin secretion.
Insulin resistance best correlates with metabolic abnormalities and is linked to the development of cardiovascular disease in patients with type 2 diabetes9.
Hyperinsulinemia and insulin resistance have been associated with coronary artery disease (CAD), type 2 DM, dyslipidemia and hypertension. Insulin resistance has been proposed as an independent risk factor for cad10.
Lp(a) has been reported to be an independent risk factor for premature CAD and other thromboembolic disorders11.
Many studies have reported that Lp(a) is elevated in type 2 DM. Moreover, the frequency of high risk levels has been reported to be much higher in type 2 diabetics12,13.
The present study aimed at studying the association between basal insulin levels, lipids and lipoprotein(a) concentrations in patients with type 2 diabetes mellitus.
Methods
with type 2 DM were selected as per selection criteria and 28 non-diabetic, age and sex-matched healthy individuals were selected for the control group.
The patients participating in the study were diagnosed as having type 2 DM; thirty-two patients were males and twenty-eight were females. Their htwenty-eight was measured in centimeters with patients barefoot and weight was measured in kilograms with patients wearing light clothes.
Clinical information, date of the diagnosis and medical history were obtained through the review of medical files and patients’ interviews. All patients presented stable metabolic conditions. Patients presenting any disease that could affect their metabolic status and the parameters studied such as nephrotic syndrome, acute or chronic renal failure, thyroid disorders, acute infections, stroke, diabetic ketoacidosis and nonketotic hyperosmolar syndrome were excluded11,14. The
patients with history of familial hypercholesterolemia or acute myocardial infarction were also excluded from the study15,16.
The history of medication was recorded and the patients taking insulin, lipid lowering agents, oral contraceptives and steroids were also excluded17,18.
We grouped diabetic subjects based on fasting (basal)
insulin concentrations in two groups: insulin levels ≥ 10 µiu/ml and insulin levels < 10 µiu/ml groups7,19,20.
The subjects included in the control group were age and sex matched healthy individuals selected from the staff members of afip (armed forces institute of pathology) and army medical college. They did not present any acute infection or any metabolic or psychological disorder and had no family history of hypercholesterolemia or dm. Their lipid profiles and fasting blood glucose levels were measured, showing they had
normal lipid profiles and fasting plasma glucose (fpg) levels <
6.1 Mmol/l (110 mg/dl).
Fasting blood samples were taken from the antecubital vein and the serum was separated, separated in aliquots and then frozen at –70 oc. Glucose was measured through the
GOD–PAP (glucose oxidase phenyl ampyrone) method, an enzymatic colorimetric method with a supplied kit (linear chemicals, barcelona, spain). Total cholesterol was measured by CHOD-PAP (cholesterol oxidase phenol ampyrone), an enzymatic colorimetric kit (linear chemicals). GPO-PAP (glycerol phosphate oxidase), an enzymatic colorimetric kit was used for serum triglycerides measurement (linear chemicals). The CHOD–PAP method was used for HDL-c and LDL-c measurement (merck systems, san antonio, TX, USA). Serum Lp(a) levels were measured immunochemically using a sandwich ELISA method with a mouse monoclonal anti-Apo(a) antibody as the solid phase antibody and a sheep anti-apo B-100 polyclonal antibody (antibody against B-100) as the detection antibody. The antibodies used in this assay identify all known isoforms of Apo(a). There was no cross-reactivity with plasminogen and LDL. The kits used were supplied by innogenetics biotechnology for health care, gent, belgium. Ion exchange resin separation method was used for estimation of glycosylated hemoglobin (stanbio glycohemoglobin, boerne, TX, USA) for which ethylenediaminetetraacetic acid (EDTA)-added whole blood was used. Insulin was measured by a chemiluminescence method, which is a sandwich assay. The
kit was supplied by diagnostic products corporation, usa and instrument used was immulite 2000. The immulite system utilizes assay-specific antibody-coated plastic beads as the solid phase, in a specifically designed test unit. The test unit serves as the reaction vessel for the immune reaction, incubation, washing and signal development. Light emission from the chemiluminescent substrate, which reacts with the enzyme conjugate bound to the bead, is proportional to the amount of analyte originally present in the sample. However, c-peptide levels were not measured in this study.
Statistical analysis
The data were analyzed by the computer software program “statistical package for social sciences” (spss version 10). Data were expressed as means and standard error of the mean (sem). The tests applied for statistical analysis were ANOVA
and bonferroni (multiple comparisons). A value of p ≤ 0.05
Was considered statistically significant. Spearman’s correlation coefficients were also determined between basal insulin levels, insulin glucose ratio and clinical characteristics. Levels of lp(a), insulin and insulin glucose ratio were also analyzed by linear regression analysis with 95% confidence intervals after log transformation of insulin and insulin glucose ratio.
Results
Clinical characteristics
Clinical characteristics of the control group and diabetic patients are shown in table 1. SBP (systolic blood pressure), DBP (diastolic blood pressure) fasting plasma glucose and hba1c were significantly higher in both groups of diabetic
patients (p < 0.0001), When compared to the nondiabetic,
healthy subjects. There was a non-significant difference regarding age and BMI between the diabetic patients and
the control group (p > 0.05). Diabetics with insulin < 10
µiu/ml were significantly older and had longer duration of
DM when compared to the patients with insulin levels ≥ 10 µiu/ml (p < 0.05).
Insulin levels
Serum insulin levels were significantly higher in diabetic patients (16.94 ± 3.21), When compared with the nondiabetic,
control subjects (7.88 ±1.01) [P < 0.05].
The serum insulin/glucose ratio, which is a marker of insulin resistance, was significantly higher in diabetic patients with
insulin levels ≥ 10 µiu/ml (p < 0.0001) When compared to the group with insulin levels < 10 µiu/ml. Moreover, HOMA-ir
values were significantly higher in the group with higher insulin
levels, when compared to the control group (p < 0.0001) And the diabetic patients with lower insulin levels (p < 0.01).
Lipid proile and Lp(a) proile
Total cholesterol (p< 0.01), LDL-c (p< 0.05), Total cholesterol /HDL ratio (p< 0.01) And TG (p< 0.05) Were significantly higher and HDL- c was significantly lower (p <
0.001) In both groups of diabetic patients when compared to the control group.
< 10 µiu/ml (p < 0.01) And in those with insulin levels ≥ 10 µiu/ml (p < 0.05 ) When compared with the control group
[table 2]. Lp(a) levels were significantly lower in DM patients
with basal insulin ≥ 10 µiu/ml, when compared to the ones with insulin levels < 10 µiu/ml ( p < 0.05).
Insulin glucose ratio was negatively correlated with fpg (r =
- 0.49, P < 0.001 And HBA1c levels (r = - 0.343, P < 0.01).
Serum insulin levels were negatively correlated with age (r =
- 0.300, P < 0.05) And positively correlated with HDL (r = 0.306, P < 0.05). The logistic regression analysis revealed a
significant association between Lp(a) as a dependent variable and the insulin levels as an independent variable (r = 0.262,
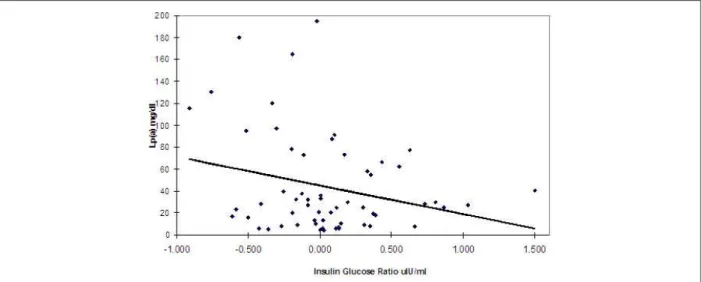
P < 0.05) (Figure 1). The association with insulin/glucose ratio was also significant (r = 0.257, P < 0.05) (Figure 2).
Discussion
It has been observed that patients with type 2 DM have increased morbidity and mortality due to coronary risk events. This increased risk hasbeen shown to be independent from conventional risk factors21.
Different factors have been found to be responsible for an increased prevalence of CAD in DM. One of these are the elevated levels of serum lp(a)11. Our study has revealed
Table 1 - clinical characteristics, glycemic status of control
individuals and dm patients based on insulin levels
Control
Dm patients with insulin
levels
≥ 10 Μiu/ml
N = 26
Dm patients with insulin levels <
10 µiu/ml n =34
Gender M/F 15/13 13/13 19/15
Age (years) 44.54 ± 1.13 47.38 ± 2.48 * 52.88 ± 1.44
Bmi ( kg/ m2 ) 23.90 ± 0.39 27.47 ± 0.82 *** 26.44 ± 0.82 
SBP 125.67 ± 1.53 144.42 ± 3.02 # 144.56 ± 2.30 #
DBP 77.83 ± 1.19 89.23 ± 2.01 # 85.74 ± 1.39 #
FPG (mmol/l) 5.06 ± 0.09 9.53 ± 0.66 # 10.17 ± 0.49 #
HbA1c % 4.83 ± 0.08 7.30 ± 0.30 # 7.33 ± 0.26 #
Serum Insulin
(µIU/ml) 7.88 ± 1.01 30.74 ± 6.51 # 6.39 ± 0.42
Serum
Insulin/Glucose 1.57 ± 0.22 3.99 ± 1.20 ** 0.70 ± 0.06
HOMA-IR 0.90 ± 0.08 2.55 ± 0.48# 1.00 ± 0.05$
Duration 5.60 ± 0.78 * 7.85 ± 0.94
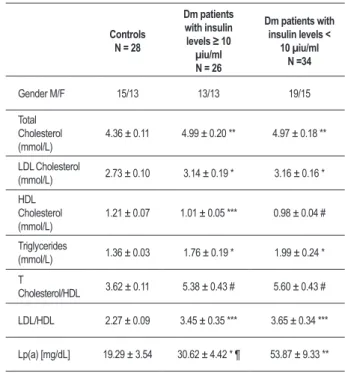
Table 2 - lipid and lp(a) proile of control individuals and dm patients.
Controls
N = 28
Dm patients with insulin
levels ≥ 10
µiu/ml N = 26
Dm patients with insulin levels <
10 µiu/ml
N =34
Gender M/F 15/13 13/13 19/15
Total Cholesterol (mmol/L)
4.36 ± 0.11 4.99 ± 0.20 ** 4.97 ± 0.18 **
LDL Cholesterol
(mmol/L) 2.73 ± 0.10 3.14 ± 0.19 * 3.16 ± 0.16 *
HDL Cholesterol (mmol/L)
1.21 ± 0.07 1.01 ± 0.05 *** 0.98 ± 0.04 #
Triglycerides
(mmol/L) 1.36 ± 0.03 1.76 ± 0.19 * 1.99 ± 0.24 *
T
Cholesterol/HDL 3.62 ± 0.11 5.38 ± 0.43 # 5.60 ± 0.43 #
LDL/HDL 2.27 ± 0.09 3.45 ± 0.35 *** 3.65 ± 0.34 ***
Lp(a) [mg/dL] 19.29 ± 3.54 30.62 ± 4.42 * ¶ 53.87 ± 9.33 **
that Lp(a) levels were significantly elevated in dm patients. Type 2 diabetic patients with hypoinsulinemia had longer duration of diabetes and higher concentrations of Lp(a), when compared to those with hyperinsulinemia. The present study also showed a significant inverse relationship between serum insulin, insulin glucose ratio and Lp(a) levels. A study carried out with elderly individuals also showed that fasting insulin was inversely correlated with Lp(a) levels. Lp(a) was significantly associated with tc and LDL-c, tg and Apo B. These results suggest that fasting insulin levels significantly influence LDL-c metabolism in the elderly. Although Lp(a) levels seem to be mostly genetically inherited, an indirect relation with insulin through adiposity and/or other associated lipid abnormalities cannot be ruled out22. Fasting insulin was has also been shown
to be inversely correlated with Lp(a) in both sexes. However, the reported coefficients were weak23.
In the later stages of type 2 DM, insulin secretion declines, with progressive loss of beta cells as well as worsening of the glycemic control12. The risk of cardiovascular mortality and
morbidity also increases with longer duration of DM24.
Figure 1 - Regression analysis between Lp(a) and Insulin.
Figure 2 -Regression analysis between Lp(a) and Insulin Glucose ratio.
the therapeutic goal of near-normal glycemia was achieved due to the difficulty in treating marked hyperglycemia and the risk of hypoglycemic episodes25.
The concentration of glycosylated Lp(a) is increased in the circulation of diabetic subjects. It is evident that glycosylation prolongs the half-life of lipoproteins and likewise for Lp(a). This can lead to elevated levels of Lp(a) in diabetic individuals26.
In a study by alagozlu et al27, non-obese type 2 DM patients
were studied. They were divided into 3 groups according to the type of treatment administered: i.E. Insulin, sulphonylureas and an untreated group. There was no significant difference in Apo A I, Apo B and triglyceride levels in the different groups of diabetic individuals. Hdl levels were significantly lower and Lp(a) levels were significantly higher in the untreated group. It was concluded that gaining metabolic control may also have favorable effects on lp(a) levels27.
Plasma Lp(a) concentrations are primarily controlled at the level of the gene that encodes Apo(a), and an inversecorrelation has been shown between plasma Lp(a) concentrationand Apo(a) size that may arise, at least in part, from the relativelyinefficient secretion of the larger Apo(a) isoforms from thehepatocytes. Additionally, the level ofLp(a) in human plasma is largely unaffected by diet, physicalactivity, and conventional hypolipidemic therapy28.
In a study by haffner and colleagues, no association was found between lp(a) concentrations and insulin levels29. In most
should be aggressive30.
The insulin resistance syndrome (IRS), which is very common in subjects with type 2 diabetes,has been suggested to be one of the factors increasing the cardiovascularrisk in type 2 diabetic men and predicted CHD events in elderly diabeticmen31. The mechanisms by
whichirs enhances atherothrombosis are largely unknown, but adversechanges, indirectly through cardiovascular risk or directlythrough hyperinsulinemia, may accelerate atherothrombosis32.
Lp(a) has been found to be metabolized differently from triglyceride-rich lipoproteins. Acute hyperglycemia-induced hyperinsulinemia has a different effect on plasma Apo B and Lp(a) levels in healthy subjects33. In a study
by Klaus G. Parhofer et al34, it was observed that unlike
Ldl, Lp(a) production, and not catabolism, determined plasma concentrations and the inverse association of Lp(a) concentrations with Apo(a) isoforms was due to differences in production and not catabolism.
One of the risk factors in long standing dm may be increasing Lp(a) levels. The association of Lp(a) levels in DM has been a matter of some controversies. The major reasons for the discrepant results of the prospective studies have been attributed to the variation in study design, collection and storage of samples, methods used for statistical analysis and population differences that reflect the known ethnic variability in the distribution of Lp(a) levels and Apo(a) size isoforms35.
Conclusions
Type 2 DM is associated with atherogenic lipid disorder and high fasting insulin/glucose ratio. Lp(a) levels inversely correlate with insulin levels in type 2 diabetic patients. Lp(a) may be one of the cardiovascular risk factors in type 2 diabetic patients with longer duration of DM. This study may partially explain the higher incidence of cardiovascular problems with the increasing duration of DM. However, long-term prospective studies are needed in diabetic patients to disclose the true mechanistic links to cardiovascular problems.
Acknowledgements
The authors wish to thank Mr. Tahseen for technical assistance.
Potential conflict of interest
No potential conflict of interest relevant to this article was reported.
Sources of funding
There were no external funding sources for this study.
Study association
This study is not associated with any post-graduation program.
References
1. Reaven GM. Role of insulin resistance in human disease. Diabetes. 1988; 37: 1595-607.
2. DeFronzo RA, Ferrannini E. Insulin resistance: a multifaceted syndrome responsible for NIDDM, obesity, hypertension, dyslipidemia, and atherosclerotic cardiovascular disease. Diabetes Care. 1991; 14: 173-94.
3. Ferrannini E, Haffner SM, Mitchell BD, Stern MP. Hyperinsulinaemia: the key feature of a cardiovascular and metabolic syndrome. Diabetologia. 1991; 34: 416-22.
4. Fanci D, Braunwald I, Isselbacher S, Wilson W, Martin A, Kasper C, et al. Diabetes Mellitus. In: Harrison’s principles of internal medicine. 14th ed. New York: McGraw-Hill; 1998. p. 2060-86.
5. Saad MF, Knowler WC, Pettitt J, Nelson RG, Charles MA, Bennett PH. A two step model for development of non-insulin- dependent diabetes. Am J Med. 1991; 90 (2): 229-35.
6. Leahy JL. Natural history of beta cell dysfunction in NIDDM. Diabetes Care. 1990; 13 (9): 992 1010.
7. Festa A, Williams K, D’Agostino R Jr, Wagenknecht LE, Haffner SM. The natural course of beta-cell function in nondiabetic and diabetic individuals: the Insulin Resistance Atherosclerosis Study. Diabetes. 2006; 55 (4): 1114-20.
8. Laakso M. How good a marker is insulin level for insulin resistance? Am J Epidemiol.1993; 137: 959-65.
9. Tennyson GE. Understanding type 2 diabetes mellitus and associated cardiovascular disease: linked by insulin resistance. Am J Manag Care. 2002; 8 (16 Suppl): S450-9.
10. Balkau B, Eschwege E. Insulin resistance: an independent risk factor for cardiovascular disease? Diabetes Obes Metab.1999; 1 (Suppl 1): S23-31.
11. Kostner KM, Kostner GM. Lipoprotein(a): still an enigma? Curr Opin Lipidol. 2002; 13: 391-6.
12. Ribault A, Durou MR, Letellier C, Wojcik F, Poirier JY, Ruelland A. Determination of lipoprotein(a) concentrations and apolipoprotein(a) molecular weights in diabetic patients. Diabetes Metab. 2000; 26 (2): 107-12.
13. Habib SS, Aslam M. High risk levels of lipoprotein(a) in Pakistani patients with type 2 diabetes mellitus. Saudi Med J. 2003; 24 (6): 647-51.
14. Woo J, Lam CWK, Kay R, Woing HY, Teoh R, Nicholls MG. Acute and long term changes in serum lipids after acute stroke. Stroke. 1990; 21: 1407-11.
15. Bartens W, Rader DJ, Talley G, Brewer HB Jr. Lipoprotein (a) in patients with hyperlipidaemia. Eur J Clin Invest. 1995; 25 (9): 647-53.
16. Slunga L, Johnson O, Dahlen GH, Eriksson S. Lipoprotein(a) and acute phase proteins in acute myocardial infarction. Scand J Clin Lab Invest. 1992; 52: 95-101.
17. Farish E, Rolton HA, Barnes JF, Hart DM. Lipoprotein(a) concentrations in postmenopausal women taking norethisterone BMJ. 1991; 303 (6804): 694.
18. Shlipak MG, Simon JA, Vittinghof E, Conner EB, Knop RH. Estrogen and progestin, Lipoprotein(a), and the risk of recurrent coronary heart disease after menopause. JAMA. 2000; 12 (5): 242-8.
beta-cell function in subjects spanning the range from normal glucose tolerance to overt diabetes: a new analysis. J Clin Endocrinol Metab. 2005; 90 (1): 493-500.
20. Lee S, Choi S, Kim HJ, Chung YS, Lee KW, Lee HC. Cutoff values of surrogate measures of insulin resistance for metabolic syndrome in korean non-diabetic adults. J Korean Med Sci. 2006; 21: 695-700.
21. Stamler J, Vaccaro O, Neaton JD, Wentworth D. Diabetes, other risk factors, and 12-yr cardiovascular mortality for men screened in the Multiple Risk Factor Intervention Trial. Diabetes Care. 1993; 16: 434–44.
22. Carantoni M, Zuliani G, Bader G, Palmieri E, Volpato S, Passaro A, et al. Low density lipoprotein cholesterol, lipoprotein(a), and apo(a) isoforms in the elderly: relationship to fasting insulin. Associazione Medica Sabin. Nutr Metab Cardiovasc Dis. 1999; 9 (5): 228-33.
23. Inoue K, Nago N, Matsuo H, Goto T, Miyamoto T, Saegusa T, et al. Serum insulin and lipoprotein(a) concentrations. The Jichi Medical School Cohort Study. Diabetes Care. 1997; 20 (8): 1242-7.
24. Abu-Lebdeh HS, Hodge DO, Nguyen TT. Predictors of macrovascular disease in patients with type 2 diabetes mellitus. Mayo Clin Proc. 2001; 76 (7): 707-12.
25. Turner R, Cull C, Holman R. United Kingdom Prospective Diabetes Study 17: a 9-year update of a randomized, controlled trial on the effect of improved metabolic control on complications in non-insulin-dependent diabetes mellitus. Ann Intern Med. 1996; 124 (1 Pt 2): 136-45.
26. Klaya F, Durlach V, Bertin E, Monier F, Monboisse JC, Gillery P. Evaluation of serum glycated lipoprotein(a) levels in non insulin-dependent diabetic
patients. Clin Biochem. 1997; 30 (3): 227-30.
27. Alagozlu H, Gultekin F, Candan F. Lipid and lipoprotein patterns in type 2 non-obese diabetic patients. Do Lp(a) levels decrease with improved glycaemic control in these patients? Nutr Metab Cardiovasc Dis. 2000; 10 (4): 204-8.
28. Marcovina SM, Koschinsky ML, Lipoprotein(a) concentration and apolipoprotein(a) size A synergistic role in advanced atherosclerosis? Circulation.1999; 100: 1151-3.
29. Haffner SM, Morales PA, Stern MP, Gruber MK. Lp(a) concentrations in NIDDM. Diabetes. 1992; 41: 1267-72.
30. Erkelens DW. Insulin resistance syndrome and type 2 diabetes mellitus. Am J Cardiol. 2001; 11; 88 (7B): 38J-42J.
31. Kuusisto J, Lempiainen P, Mykkanen L, Laakso M. Insulin resistance syndrome predicts coronary heart disease events in elderly type 2 diabetic men. Diabetes Care. 2001; 24 (9): 1629-33.
32. Laakso M. Insulin resistance and coronary heart disease. Curr Opin Lipidol. 1996; 7: 217-26.
33. Riemens SC, Ligtenberg JJ, Dullaart RP. Hyperglycemia-induced hyperinsulinemia acutely lowers plasma apolipoprotein B but not lipoprotein (a) in man. Clin Chim Acta. 1997; 261 (2): 149-58.
34. Parhofer KG, Demant T, Ritter MM, Geiss HC, Markus Donner M, Schwandt P. Lipoprotein(a) metabolism estimated by nonsteady-state kinetics. Lipids. 1999; 34 (4): 325-35.