The complexity-stability hypothesis in plant gas exchange
under water deficit
Gustavo M. Souza1*, Steven M. Pincus2 and José Alberto F. Monteiro3
1Laboratório de Ecofisiologia Vegetal, Universidade do Oeste Paulista - UNOESTE, Rod. Raposo Tavares km 572, 19067-175, Presidente Prudente, SP, Brazil; 2990 Moose Hill Road, Guilford, CT, 06437, USA; 3Institute of Botany, University of Basel, Schönbeinstrasse 6, CH-4056 Basel, Switzerland. *Corresponding author: gustavo@unoeste.br
Received: 05/10/2005; Accepted: 16/12/2005
We hypothesized that more complex, i.e. irregular, temporal dynamics and a more interconnected overall network supports greater stability to gas exchange parameters (herein, CO2 net assimilation and transpiration) in plants under water deficit. To test this hypothesis two genotypes of Phaseolus vulgaris were subjected to a period of absence of irrigation, and subsequent rewatering to achieve recovery. Gas exchanges parameters were measured each 10 s during 6 h to obtain time series to evaluate complexity by Approximate Entropy (ApEn) calculations, and network connectance in each water regime. Notably, the Jalo Precoce genotype showed significantly more stability than the Guarumbé genotype under system perturbation, coincident with greater irregularity in each gas exchange parameter and greater overall connectance for Jalo Precoce. This conclusion is consistent with other observations of greater homeostasis in more complex networks, seen in broad contexts such as cardiac rhythms and respiratory dynamics.
Key words: Approximate Entropy; complexity, network connectance, plant stress theory, photosynthesis, temporal dynamics, water deficit.
A hipótese sobre a relação entre complexidade e estabilidade em trocas gasosas de plantas sob deficiência hídrica: A
hipótese testada neste estudo foi a de que dinâmicas temporais mais complexas, isto é, mais irregulares, e uma rede com maior conectância global suportariam maior estabilidade de parâmetros relacionados às trocas gasosas (assimilação líquida de CO2
e transpiração) em plantas sob deficiência hídrica. Para tanto, dois genótipos de Phaseolus vulgaris foram submetidos a um período de suspensão da irrigação e subseqüente re-hidratação para avaliar a recuperação das plantas. As trocas gasosas foram medidas em intervalos de 10 segundos durante 6 horas para a obtenção de séries temporais adequadas para os cálculos de com-plexidade por meio do uso da medida de Entropia Aproximada (ApEn), e conectância da rede de trocas gasosas em cada condi-ção testada. Notavelmente, o genótipo Jalo Precoce mostrou significativa maior estabilidade que o Guarumbé, coincidindo com maior complexidade na dinâmica de cada parâmetro de trocas gasosas e maior conectância global no genótipo Jalo Precoce. Esse resultado foi consistente com outras observações de maior homeostase em redes mais complexas, em um contexto mais amplo, como observado em ritmos cardíacos e dinâmicas respiratórias.
Palavras-chave: Complexidade, conectância em redes, deficiência hídrica, dinâmica temporal, Entropia Aproximada, fotossíntese, teoria de estresse em plantas.
INTRODUCTION
The relationship between complexity and physiological stability has been observed among different kinds of biologi-cal systems. A greater irregularity (complexity) of each of cardiac rhythms, respiratory dynamics and blood pressure measurements has been associated with a healthier physi-ological status in humans. Conversely, and significantly,
of system homeostasis (Hütt and Lüttge, 2002; Souza et al., 2004a). An increase in ecological system complexity has also been related to an increase in its overall stability (van Voris and O’Neill, 1980; Hastings et al., 1993; McCann, 2000).
Biological systems are organized as networks with a variety of interconnection and hierarchical attributes (Kauff-man, 1993; Souza and Manzatto, 2000). The existence of significant redundancy (Edelman and Gally, 2001) within the network buffers the primary pathways or mechanisms within biological systems against external perturbations. Systems with sufficient redundancy provide a robustness in perform-ance even when the system suffers an external disturbperform-ance, e.g., via transmission across alternate pathways, providing overall stability to the ensemble system (Amzallag, 2001; Edelman and Gally, 2001). Specifically, the quantity and the strength of the connections between network compo-nents have been directly correlated with the system stability (Trewavas, 1986; Edelman and Gally, 2001).
In this study, we considered the concept of stability as closely related to the classical concept of homeostasis. Stability is more suitable in studies considering dynamical aspects of biological systems such as herein (Souza and Buckeridge, 2004). However, since the original concept of homeostasis does not explicitly consider the ability of biological systems to dynamically reconfigure under environmental perturbations, authors such as Yates (1994) and Lloyd et al. (2001) have introduced a new and more broadly applicable concept, the homeodynamics concept, to account for such biological dynamical evolution. This revised concept is very interesting and could improve our understanding of plant ecophysiology, pending suitable care in interpretation of results.
Network connectance analysis has been proposed by Amzallag (2001) in plant physiological data, to assess the strength or degree to which specified individual network components are linked in an overall ensemble (see details in M&M). Further studies, such as Prado et al. (2004), Souza et al. (2004b) and Souza et al. (2004c), have considered the hypothesis that 1) systems showing more connected physiological networks are more able to maintain their stability, and 2), under external disturbances, physiological networks tend to maintain or increase the connectance between their parameters as a general response to such environmental variation.
Water deficiency is a common environmental factor constraining plants to express their ecophysiological potential. This deficiency leads to decrease in photosynthesis,
although tolerance may vary according to species (Kaiser, 1987; Chaves, 1991; Larcher, 1995; Chaves et al., 2002; Souza et al. 2003).
Souza et al. (2004a) found that sunflower plants, which are more tolerant to water deficit than sugar beet plants, showed more irregular (complex) temporal dynamics in their stomatal conductance runs at different water regimes. It was hypothesized that this complex temporal behavior allowed a more efficient adjustment to conditions of water deficiency. Such hypothesis was also corroborated by van Voris and O’Neill (1980) taking into account the respiration dynamics of a microecological community under different levels of soil toxicity.
In the present context, this study proposes to test the hypothesis that a higher complexity (irregularity) in temporal dynamics of assimilation of CO2 and transpiration would be more efficient to the maintenance of homeostatic capacity of plants of common bean submitted to water deficit. To test this hypothesis we used two genotypes of Phaseolus vulgaris with distinct capacity to resist to water deficiency (Souza et al., 2003). Before submitting plants to a period of absence of irrigation, we measured gas exchanges parameters each 10 s during 6 h to obtain suitable time series in order to evaluate complexity by Approximate Entropy (ApEn) calculations (Pincus, 1991, Souza et al., 2004c). After a 6 day-period of irrigation suspension the plants were rewatered to test their homeostatic capacity.
ApEn assigns a non-negative number to a sequence or time-series, with larger values corresponding to greater apparent process randomness or serial irregularity, and smaller values corresponding to more instances of recognizable features or patterns in the data (Pincus, 1991; Pincus and Goldberger, 1994).
Furthermore, we also assessed the degree of connectance in the networks of gas exchange. These networks were formed by relationships between the physiological variables net CO2 assimilation, transpiration, stomatal conductance and intracellular concentration of CO2 (Souza et al. 2004b and c). We utilized this analysis to test the hypothesis that the plants with, a priori, higher network connectance would be more efficient to face water deficit.
MATERIAL AND METHODS
Foz do Iguacu State Park – PR, Brazil. All seeds were kindly provided by germoplasm bank from Seeds Laboratory at UNOESTE, Presidente Prudente – SP, Brazil.
Plastic pots (5 L) filled with 4 Kg of substrate Plantmax (Eucatex-Agro, Brazil) were used, and irrigated with tap water until saturation. Three seeds of each genotype were sowed in each cup, and only one plant was maintained after complete seedling development.
Sixteen-day old individuals were submitted to water deficiency by suspension of irrigation for 6 days, when the water potential values reached around -1 MPa, the plants were rewatered. The experiment was carried out under greenhouse conditions. The control group was not water limited, being irrigated with 400 mL of water by replicate daily. All plants were supplied with 600 mL of nutrient solution (McCree, 1986) at the 8th and the 16th day after germination.
Water potential of plants under water deficit was measured each two days using dew point microvoltmeter (model HR-33T, Wescor) in a sample chamber (model C-52, Wescor).
Data acquisition was performed according to Souza et al. (2004c). Time series at steady state of gas exchange (net assimilation of CO2 µmol.m-2.s-1, A, and transpiration mmol H2O.m-2.s-1, E) were scored each 10 s during 6 h (from 9: 00h AM to 3:00h PM) in control, water deficit, and after 36 h recovery treatments. Measurements were performed using an IRGA LI-6400 (LiCor, Lincoln, USA). Data were collected inside the laboratory and environmental conditions were maintained constant within the chamber at the temperature of 30ºC, photosynthetic photon flux density (PPFD) of 800 mmol.m-2.s-1, and 370 ppm of CO
2. The difference of water pressure deficit between leaf and air was maintained at 1 kPa using a dew point generator (LI-610, LiCor, Lincoln, USA). The plants were placed into the laboratory at the experimental conditions one hour before starting the measurements. The same healthy and fully expanded central leaflet was analyzed in one plant per treatment (control, water deficit and recovery). The experiment was repeated three times in August and September 2002 and in February 2003, presenting suitable qualitative reproducibility. The time series shown in Figures 1 and 2 were derived from the third experimental repetition.
The noise in measurements (Pearcy et al., 1989) was evaluated with the empty leaf cuvette. This test showed that the noise due to the LI-6400 was very low (<2 % for net CO2 assimilation and <0.005 % for stomatal conductance) and thus could be presently ignored. The coefficient of variation
(total CV %, which represents the sum of variations of the air flow rate, CO2 and water vapor differentials) of the LI-6400 was around 0.1 % during the measurements. Furthermore, the LI-6400 typically takes new measures every 0.75 s, which is suitable for the baseline time interval used in this study (10 s).
Data analyses: To assess changes in system network aspects, we evaluated the occurrence of differences in the system modulation of gas exchange when submitted to different leaf water potentials via the concept and measurement of global connectance, Cg (Amzallag, 2001). Accordingly, to define connectance, first we specify a collection of paired variables of interest in the network. Next, we utilize the correlation coefficients (r) between each paired variable not only to test the significance of the correlation, but also as a measure of the strength of the relationship (connection) between the two parameters, by forming the z-transformation: z = 0.5 ln [(1 + ⎮r⎮)/(1 - ⎮r⎮)]. Finally, we define the network global connectance (Cg) of the specified collection of paired variables as the average of the absolute z-values calculated above (Amzallag, 2001). In this study, we calculated Cg for the following collection of paired variables: A (net CO2 assimilation) x gs (stomatal conductance), A x Ci (internal CO2 concentration), A x E (transpiration), gs x E, and gs x Ci. This technique was first used in time series by Souza et al. (2004c), providing some interesting and significant findings. The irregularity of the time-series was assessed by ApEn. Two input parameters, a run length m and a tolerance window r, must be specified to compute ApEn. This parameter measures the logarithmic likelihood that runs of patterns that are close (within r) for m contiguous observations remain close (within the same tolerance width r) on next incremental comparisons. The opposing extremes are perfectly regular sequences, (e.g., sinusoidal behavior, very low ApEn), and independent sequential processes (very large ApEn). It is imperative to consider ApEn (m,r) as a family of parameters; comparisons are intended with fixed m and r.
ApEn evaluates both dominant and subordinant patterns in data; notably, it will detect changes in underlying episodic behavior not reflected in peak occurrences or amplitudes (Pincus and Keefe, 1992). Additionally, ApEn provides a direct barometer of feedback system change in many coupled systems (Pincus and Keefe, 1992; Pincus, 1994).
ApEn is nearly unaffected by noise of magnitude below r, a de facto filter level. ApEn is robust or insensitive to artifacts or outliers: extremely large and small artifacts have small effect on the ApEn calculation, if they occur infrequently. Both these points are evidently useful in clinical and experimental contexts, such as our present setting.
Further technical discussion of mathematical and statistical properties of ApEn, including mesh interplay, relative consistency of (m,r) pair choices, asymptotic normality under general assumptions, and error estimation for general processes can be found elsewhere (Pincus and Huang, 1992; Pincus and Goldberger, 1994). To develop a more intuitive, physiological understanding of the ApEn definition, a multistep description of its typical algorithmic implementation, with figures, is developed in Pincus and Goldberger (1994). Moreover, an extended discussion that covers a broad variety of both methodological aspects, plus considerably more background on the physiological meaning and scope of applicability of ApEn, can be found in Pincus (2000).
For the studies discussed below, ApEn values were calculated with widely established parameter values of m = 1, and r = 20 % SD (standard deviation) of the gas exchange time-series (Souza et al., 2004c). Normalizing r to each time-series SD in this manner gives ApEn a translation- and scale-invariance (Pincus et al., 1993), in that it remains unchanged under uniform process magnification, reduction, or constant shift higher or lower. Multiple previous studies that included both theoretical analysis (Pincus, 1991; Pincus and Keefe, 1992; Pincus and Goldberger, 1994) and biological applications (Pincus et al., 1993; Pincus et al., 1996; Pincus et al., 1996; Christen et al., 1998; Pincus et al., 1998; Bruhn et al., 2000, Souza et al., 2004c and 2004d) have demonstrated that these input parameters produce good statistical reproducibility for ApEn for time-series of the lengths considered herein. In particular, one ApEn standard deviation ≤ 0.055 under very general conditions for ApEn for time-series of the lengths we analyze herein. Thus ApEn values that differ by 0.15 represent nearly 3 ApEn SDs,
indicating true distinction with error probability nearly p = 0.001.
Because the time-series of all physiological variables in the present experiments exhibit some nonstationary aspects, ApEn was applied to the first-differenced gas exchange time-series. This is a standard statistical method to stationarize time-series and is applicable to a very broad class of models (Chatfield, 1989; Willians, 1997); it showed utility in previous analysis of gas exchange dynamics (Souza et al., 2004a and c).
RESULTS
Effects of water deficiency on gas exchange: The period of suspension of irrigation imposed to both genotypes significant (p<0.05) reductions in the gas exchange parameters A, E and gs (table 1) and in the leaf water potential (table 2). Under control condition, both genotypes presented similar average rates of CO2 assimilation. However, mean values of gs and E were higher (p<0.05) in the genotype Guarumbé (table 1), accordingly, water use efficiency (WUE) in the genotype Jalo Precoce was superior (table 2). In spite of the fact that E and gs in Guarumbé have been relatively more affected by water deficiency than in Jalo Precoce, higher absolute values (p<0.05) under water deficit were maintained in Guarumbé (table 1), still allowing a slight higher WUE in Jalo Precoce.
Thirty six hours after recovering, mean values of A were not completely restored to control levels in both genotypes, al-though they were higher (p<0.05) than values during water de-ficiency (table 1). Jalo Precoce presented a complete recovery of E and gs values, while Garumbé still presented lower values in these parameters than under the control conditions (table 1). This likely explains lower values of WUE after recovery in Jalo Precoce (3.74) than in Guarumbé (4.75).
It is notable that leaf water potential has not returned to initial values in both genotypes after recovery, markedly in Jalo Precoce (Table 2). Nevertheless, Jalo Precoce exhibited more substantial and significant (p<0,05) recovery in A than Guarumbé. While the latter recovered less than 50 % of CO2 net assimilation, the former showed a recovery of approximately 65 %.
Table 1. Mean values and standard deviations of gas exchange parameters (net assimilation of CO2μmol.m-2.s–1, A, transpiration mmol H2O.m-2.s–1, E, and stomatal conductance mol H
2O.m-2.s-1, gs, intercellular CO2 concentration, μmol.L-1, Ci) measured each 10 s during 6 h in two genotypes of P. vulgaris under conditions of irrigation (control), water deficit, and after 36 h of recovering.
Jalo Precoce Guarumbé
control deficit recovery control deficit recovery
A 15.18±1.56 2.88±1.04 9.84±1.69 15.50±0.54 4.43±0.98 7.45±1.66
E 2.19±0.51 0.46±0.08 2.63±0.94 5.76±0.71 0.80±0.16 1.57±0.19
gs 0.130±0.040 0.029±0.007 0.190±0.110 1.066±0.141 0.043±0.014 0.061±0.014
Ci 183.78±21.94 196.16±13.61 221.21±37.17 270.04±10.51 172.50±44.71 155.78±63.14
Table 2. Values of leaf water potential (ψ, MPa) and water use efficiency (WUE, µmol CO2.mmol-1 H
2O) of P. vulgaris under conditions of irrigation (control), water deficit, and after 36 h of recovering.
Jalo Precoce Guarumbé
control deficit recovery control deficit recovery
Ψ -0.5±0.04 -1.0±0.14 -0.7±0.08 -0.5±0.08 -1.1±0.10 -0.6±0.1
WUE 6.88 6.26 3.74 2.69 5.54 4.75
Table 3. Values of correlation coefficients (r) for pairs of gas exchange parameters in two genotypes of P. vulgaris under conditions of irrigation (control), water deficiency, and after 36 h of recovery. These values were calculated by linear regression of the complete time series data. Except for A x gs (p = 0.909) and gs x E (p = 0.194) at control condition in Guarumbé, all others r values showed p<0.001.
Jalo Precoce Guarumbé
control deficit recovery control deficit recovery
A-gs 0.593 0.929 0.726 -0.003 0.775 -0.366
A-Ci 0.510 -0.122 0.728 0.846 0.270 -0.405
A-E 0.597 0.873 0.793 0.808 0.729 -0.279
gs-E 0.977 0.965 0.954 -0.031 0.947 0.672
gs-Ci 0.841 0.139 0.688 -0.177 0.714 0.792
Cg 1.077 1.055 1.129 0.515 0.987 0.598
pairs gs x E and gs x Ci (p<0.0001). Conversely, in Guarumbé gs showed no significant correlation with A (p>0.9) and E (p>0.1), suggesting an absence of a straightforward control of stomata on A and E, under irrigated condition. Since the relation between A x Ci and gs x Ci was significant (p<0.001), the stomatal regulation of A probably occurred through Ci (table 3). Under the water deficit condition, all parameters of Guarumbé were significantly correlated, especially gs x A and gs x E (p<0.0001), suggesting that water limitation induced a strong stomatal control on A and E. Moreover, although there was variation in the extent of correlation r among tested pairs, all correlations between measured variables for Jalo Precoce remained significant
The r values were transformed into z values (see Material and Methods) for calculation of global connectance (Cg), which is the average of z values for each pair of parameters in each treatment. According to Gardner and Ashby (1970), the connectance quantifies the level of linkage within a system. Under the control condition, Cg in Jalo Precoce was 52 % higher than in Guarumbé. However, under water defficiency Cg of Guarumbé increased 47.8 % compared to control, while Cg value in Jalo Precoce remained practically unchanged, but still greater than in Guarumbé (table 3). Finally, after the recovery period, Cg in Guarumbé decreased 39 %, reaching a value close to the baseline control condition. In considerable contrast, Cg in Jalo Precoce remained very stable from baseline through deficit to recovery, with a slight final stage increase of 7 % (table 3). These results suggest that water deficiency had substantially greater effect on overall gas exchange network linkages in Guarumbé than in Jalo Precoce.
Steady-state temporal dynamics in A and E runs: Although all data have been measured under constant environmental conditions, different temporal dynamic patterns can be observed (figures 1 and 2). Both genotypes presented oscillations in A and E runs during the measurements period. Oscillations in A and E were synchronized, i.e., there was a agreement between valleys and peaks for these parameters throughout measurements, as may be observed by the correlation coefficients between A and E, except for Jalo Precoce under control conditions and Guarumbé after recovery (table 3). However, while Guarumbé presented only a single oscillation period of 33 min, Jalo Precoce showed two frequencies, a longer one of 33 min, and a short one of 15 min. There also was a greater variation in the amplitude of oscillations in Jalo Precoce runs (figure 1).
According to visual comparison of the presented dynamics (figures 1 and 2), it can be observed that under water deficiency, both genotypes lost their primary oscillatory behavior, and only Jalo Precoce tended to recover it after rewatering.
Values of ApEn for time series at steady state of A and E under the control condition showed that complexity (irregularity) in both series were greater for Jalo Precoce (table 4). This tendency of higher values of ApEn for Jalo Precoce were observed in other repetitions of the experiment (data not shown), confirming a greater irregularity in temporal dynamics for A and E in this genotype. This difference in values of ApEn between the genotypes was
Table 4. Calculated mean values of Approximate Entropy (ApEn) of steady state time series of net CO2 assimilation (A) and transpiration (E) in two genotypes of P. vulgaris under control, water deficit and recovery treatments. (ApEn parameters m = 1 and r = 20 % of SD).
Jalo Precoce Guarumbé
A
Control 2.041 1.414
Water deficit 1.884 1.945
Recovery 1.744 1.740
E
Control 1.395 1.195
Water deficit 1.397 2.437
Recovery 1.467 1.425
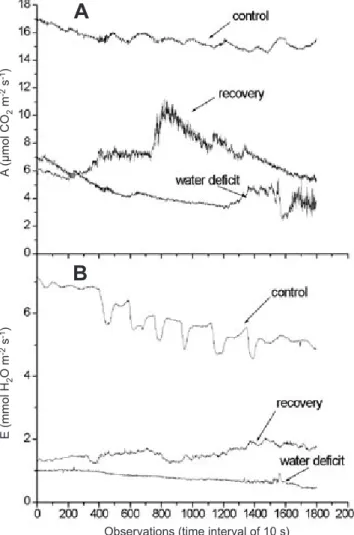
Figure 1. Temporal dynamics of A) net CO2 assimilation, A, and B) transpiration, E, for Jalo Precoce under conditions of irrigation (control), water deficiency, and after 36 h of recuperation. The series were evaluated in similar healthy totally expanded leaves and data were taken each 10 s during 6 h.
A
(µmol CO
2
m
-2 s -1)
E (mmol H
2
O m
-2 s -1)
Observations (time interval of 10 s)
A
most pronounced in A, and statistically significant (p<0.05), based on all experimental repetitions. Although for each experiment repetition the values of ApEn in the E time series for Jalo Precoce were always higher than for Guarumbé, we did not quite achieve statistical significance here. As previously suggested by Souza et al. (2004c) in a temporal dynamic study of gas exchange with Citrus sinensis under situation of different VPD, the variable A seemed to be the more sensitive of the two in exhibiting dynamical differences due to environmental effects in gas exchange time series.
While the runs became more irregular under water deficit in Guarumbé, the runs of genotype Jalo Precoce remained approximately the same, tending towards a lower irregularity. After the recovery period the complexity of all time series tended to be lower than under water deficit, except for transpiration in Jalo Precoce (table 4). These trends were also observed in temporal dynamics of sap flow in tropical tree species under different water regimes (Souza et al., 2004d).
DISCUSSION
Water content has a pronounced effect on photosyn-thesis. Water deficiency leads invariably to a decrease in photosynthetic rate, although levels of tolerance can vary for different plant species (Kaiser, 1987; Chaves, 1991; Larcher, 1995; Chaves et al., 2002). Among the factors that contribute to this photosynthesis reduction we could consider stomatal closure in direct response to a reduction of leaf water poten-tial. A reduction of stomatal conductance limits intercellular CO2 reposition, reducing Ci, consequently constraining net CO2 assimilation (Jones, 1998; Cornic, 2000; Chaves et al., 2002). As a result of stomatal closure, loss of water to atmosphere is also reduced, contributing to the maintenance of plant water potential (Jones, 1998; Chaves et al., 2002). Under moderate water restriction, with a partial stomatal closure, photosynthesis is less affected than transpiration, increasing WUE (A/E). This WUE increase was clearly ob-served in Guarumbé under water deficiency (table 2). Never-theless, WUE decreases quickly as stomata are almost closed (Chaves, 1991; Larcher, 1995; Nobel, 1999).
Thus, under water deficiency, stomata assume a central role in gas exchange control (Chaves, 1991; Jones 1998). Therefore, we assumed herein that values of Cg might be especially dependent on gs. In addition to the direct effect of gs over A and E, there may exist multiple feedback processes acting directly or indirectly on gs. Moreover, environmental factors also can influence any of these variables and their
feedback linkages (Farquar and Sharkey, 1982; Zeiger et al., 1987; Jones, 1998). Accordingly, we proposed a diagram to represent gas exchanges regulation in this study, based upon Jones (1998) (figure 3). A greater stomatal control is a desirable character in plants in order to tolerate water deficiencies, allowing a suitable adjust in gas exchange, resulting in a faster photosynthesis recovering after rewatering (Kramer and Boyer, 1995).
The results of gas exchange network analyses (table 3) suggest that a higher Cg in Jalo Precoce, at initial irrigated condition, may facilitate system homeostasis, compared with the Guarumbé genotype. We have suggested that higher values of Cg provides a better system adjustment under environment perturbations, permitting the system to adjust itself faster in response to environmental stimulus. Additionally, environmental restrictions may canalize the system, reinforcing linkages between network components in the face of a particular environment condition (stress), thus maintaining its homeostasis (Souza et al., 2004b,c). Both these two behaviors were observed in this study. Although Guarumbé increased Cg under water deficiency, Jalo Precoce maintained high values of Cg in all experimental states, sup-porting our homeostatic thesis. Similar results to the present analysis were obtained in gas exchange responses to water deficiency in two tropical tree species (Souza et al., 2004b). In that study, the species with higher Cg values did not ex-hibit significant physiological change in this measure under water deficit, whereas the other species, with lower values of Cg, presented a limited and diminished recuperation after the water deficit condition.
The results presented herein (table 1) showed that Jalo Precoce had a greater stomatal control on gas exchanges, reaching smaller values of gs than Guarumbé in water deficit condition. The greater stomatal control of Jalo Precoce is supported by higher values of r observed in the relationships between A x gs and E x gs (table 2).
The hypothesis in this study was that more irregular (complex) temporal dynamics and a more interconnected overall network could support higher stability to CO2 net as-similation and to transpiration in plants under water deficit.
genotype. This relation found herein and observations from Souza et al. (2004c) on gas exchanges temporal dynam-ics of C. sinensis under different VPD situations support the hypothesis that systems with more irregular temporal dynamics may have greater tolerance to environmental perturbations, thus maintaining greater system stability (homeostasis). Therefore, just as for heart rate, respiration and blood pressure (Lipsitz and Goldberger, 1992; Pincus, 1995), more robust systems had higher ApEn values, and were were more stable, fluid or less affected by external perturbations. Similarly here, Jalo Precoce showed higher baseline ApEn than Guarumbé genotype, and again was more stable under perturbation.
Furthermore, the overall variation in ApEn values (Tvar%), over the three treatment conditions, calculated as: Tvar% = max of the mean ApEn values – min of the mean ApEn values / average of the three ApEn values (control, deficit, recovery) x 100, showed that the runs of Jalo Precoce were more stable than in Guarumbé. Consideration of the time series of net CO2 assimilation, while Tvar% in Jalo was 15.7 %, in Guarambé Tvar% was 31.2 %. This difference was even profoundly more significant for the transpiration time series. Tvar% in Jalo was nearly a factor of 15 smaller (more stable) than that for Guarumbé, respectively, 5.0 % compared to 73.7 %. These results support the hypothesis that the genotype that showed a more complex baseline can retain its stability (homeostasis) with greater efficiency.
Plants, as biological systems, are dynamic systems, thermodynamically in non equilibrium. This implies that those systems, especially their physiological processes, evolve during time, presenting a variability of dynamic behaviors. Such behaviors may be significantly influenced by environment stimuli (Hütt and Lüttge, 2002; Souza et al., 2004a). Complex temporal dynamics can be more efficient in supporting environmental perturbations due to its greater intrinsic flexibility of responses, which can then more effectively stabilize the system, i.e., preserve homeostasis. Van Voris and O’Neill (1980) verified that a greater complexity in respiratory metabolism in a micro-ecosystem was associated with the ability to support higher doses of heavy metals. Møller et al. (1998) in a study of chaotic dynamics in peroxidase catalyzed reactions found that such irregular dynamics improved system stability. Finally, in studies with stomatal conductance temporal dynamics Souza et al. (2004a) observed that plants with higher complexity in gs time series were more able to recover gas exchanges status after period of water deficit.
Figure 2. Temporal dynamics of A) net CO2 assimilation, A, and B) transpiration, E, for Guarumbé under conditions of irriga-tion (control), water deficiency, and after 36 h of recuperairriga-tion. The series were evaluated in similar healthy totally expanded leaves and data were taken each 10 s during 6 h.
Figure 3. Schematic representation of gas exchange relationships under water deficit. A = CO2 net assimilation, E = transpiration, gs = stomatal conductance, Ci = intercellular CO2 concentra-tion, ψ = leaf water potential. Adapted from Jones (1998).
A
(µmol CO
2
m
-2 s -1)
E (mmol H
2
O m
-2 s -1)
Observations (time interval of 10 s)
A
Generally, studies of temporal dynamics on plant physiology, particularly on gas exchanges, are restricted to the rhythms of circadian cycles (Fredeen et al., 1991; Hennessey and Field, 1991; Hennessey et al., 1993; Webb, 1998; Rasher et al., 2001). Nevertheless, variable stomatal conductance behavior across a smaller time scale (minutes or seconds) has been observed (Cardon et al., 1994; Haefner et al., 1997; Mott and Buckley, 1998 and 2000; Souza et al., 2004a). The phase, amplitude and period of stomatal oscillations can substantially vary among patches in a single leaf (Cardon et al., 1994; Mott and Buckley, 1998). This variation of temporal behavior among patches could reflect in a higher or lower irregularity of stomatal conductance dynamics measured by IRGAs (Infra red gas analyzers), which often sample a leaf area containing many patches (Souza et al., 2004a). Various mechanisms have been proposed to explain oscillatory behavior of stomata. Among the most important ones, we especially note those based upon hydraulic mechanisms of interaction between epidermis cells and the adjacent stomata (Sharpe et al., 1987; Haefner et al., 1997), and the influence of oscillations in calcium intracellular concentrations on stomatal aperture (Allen et al., 2001; Evans et al., 2001; Ng and McAinsh, 2003). As both mechanisms presented could be influenced by environmental changes, the former influenced by humidity (Haefner et al., 1997; Mott and Buckley, 1998) and the latter by different environmental factors, since calcium has been considered as an important secondary messenger in response to environmental perturbations (Reddy, 2001), it might be expected that temporal dynamics of stomatal conductance and, consequently, leaf gas exchanges, were influenced by other external stimuli.
Concluding remarks: The physiological studies discussed herein clarify that common bean gas exchanges can exhibit well-defined, non-random network structure, as well as subtle, yet consistent irregularities in individual variable dynamics. Accordingly, given the absence of external influences, above we inferred intrinsic differences between plant genotypes, under several different physiological states, on the basis of both network and individual variable analysis. The assessment of both connectance (Cg) and sequential irregularity (ApEn) was quite useful in evaluating endogenous processes of physiological regulation. Thus, these two entirely distinct and complementary statistical perspectives to investigate plant stability showed corroborative findings supporting our homeostatic hypothesis.
We proposed that a greater system connectance can support a greater complexity in the temporal dynamics of plants, since systems with a high degree of internal connections could more rapidly make fine tuning adjustments. Moreover, our results support the hypothesis of Souza et al. (2004b) that an increase in connectance (Cg values) indicates plant responses to environmental perturbations, improving their resistance, and that systems with a high degree of Cg would be more tolerant to environmental restrictions. In this context, we regard resistance as the capacity of the plants to oppose environmental perturbation due to modifications in their regulation network, and tolerance as the capacity of plants to support environmental changes without significant alterations to their system. Thus, recalling the results of the connectance analyses, Jalo Precoce was the more tolerant genotype, while Guarumbé showed more predominant resistance. This conceptual ecophysiological framework is consistent with the themes of a more systemic stress framework proposed by Souza and Cardoso (2003).
Finally, the results presented herein are somewhat specific to our experimental model, and should be corroborated with subsequent experiments incorporating different sets of environmental variables as well as different species, to verify the robustness and generality of the stability-complexity relation hypothesis.
Acknowledgments: This study was supported by FAPESP (Fundação de Amparo a Pesquisa no Estado de São Paulo).
REFERENCES
Allen GJ, Chu SP, Harrington CL, Schumacher K, Hoffmann T, Tang YY, Grill E, Schroeder JI (2001) A defined range of guard cell calcium oscillation parameters encodes sto-matal movements. Nature 411:1053-57.
Amzallag GN (2001) Data analysis in plant physiology: are we missing the reality? Plant Cell Environ. 24:881-90. Bruhn J, Ropcke H, Rehberg B, Bouillon T, Hoeft A (2000)
Electroencephalogram approximate entropy correctly clas-sifies the occurrence of burst suppression pattern as increas-ing anesthetic drug effect. Anesthesiology 93:981-85. Cardon ZG, Mott KA, Berry JA (1994) Dynamics of patchy
stomatal movements, and their contribution to steady state and oscillating stomatal conductance calculated using gas-exchange techniques. Plant Cell Environ. 17: 995-1007. Chatfield C (1989) The analysis of time series: an
introduc-tion. Chapman & Hall, London.
Chaves MM (1991) Effects of water deficits on carbon assim-ilation. J. Exp. Bot. 42:1-16.
How plants cope with stress in the field: photosynthesis and growth. Ann. Bot. 89:907-16.
Christen JA, Torres J-L, Barrera J (1998) A statistical feature of genetic sequences. Biometrical J. 40:855-63.
Cornic G (2000) Drought stress inhibits photosynthesis by de-creasing stomatal aperture – not by affecting ATP synthe-sis. Trends Plant Sci. 5:183-221.
Edelman GM, Gally JA (2001) Degeneracy and complexi-ty in biological systems. Proc. Natl. Acad. Sci. USA 98: 13763-68.
Evans NH, McAinsh MR, Hetherington AM (2001) Calci-um oscillations in higher plants. Curr. Opin. Plant Biol. 4:415-20.
Farquhar GD, Sharkey TD (1982) Stomatal conductance and photosynthesis. Annu. Rev. Plant Physiol. 33:317-45. Flexas S, Bota J, Loreto F, Cornic G, Sharkey TD (2004)
Dif-fusive and metabolic limitations to photosynthesis under drought and salinity in C3 plants. Plant Biol. 6:269-79. Fredeen AL, Hennessey TL, Field CB (1991) Biochemical
cor-relates of the circadian rhythm in photosynthesis in Phase-olus vulgaris. Plant. Physiol. 97:415-419.
Gardner MR, Ashby WR (1970) Connectance of large dy-namic (cybernetic) systems: critical values for stability. Nature 228:784.
Haefner JW, Bunckley TN, Mott KA (1997) A spatially ex-plicit model of patchy stomatal responses to humidity. Plant Cell Environ. 20:1087-1097.
Hastings A, Hom CL, Ellner S, Turchin P, Godfray HCJ (1993) Chaos in ecology: is mother nature a strange at-tractor? Annu. Rev. Ecol. Syst. 24:1-33.
Hennessey TL, Field CB (1993) Circadian rhythms in photo-synthesis. Plant Physiol. 96: 831-836.
Hennessey TL, Fredeen AL, Field CB (1993) Environmental effects on circadian rhythms in photosynthesis and stomat-al opening. Planta 189:369-376.
Hütt M-Th, Lüttge U (2002) Nonlinear dynamics as a tool for modeling in plant physiology. Plant Biol. 4:281-297. Jones H (1998) Stomatal control of photosynthesis and
tran-spiration. J. Exp. Bot. 49:387-398.
Kaiser WM (1987) Effects of water deficit on photosynthetic capacity. Physiol. Plant. 71: 142-149.
Kauffman SA (1993) The origins of order. Oxford Universi-ty Press, New York.
Kramer PJ, Boyer JS (1995) Water relations of plants and soils. Academic Press, San Diego.
Larcher W (1995) Physiological Plant Ecology: Ecophysiol-ogy and stress physiolEcophysiol-ogy of functional groups. Springer-Verlag, Berlin.
Lipsitz LA, Goldberger AL (1992) Loss of complexity and ag-ing. JAMA 267:1806-1809.
Lloyd D, Aon MA, Cortassa S (2001) Why homeodynamics, not homeostasis? The ScientificWorld 1:133-145.
McCann KV (2000) The diversity-stability debate. Nature 405:228-233.
McCree KJ (1986) Measuring the whole plant daily carbon balance. Photosynthetica 20:82-93.
MØller AC, Hauser MJB, Olsen LF (1998) Oscillations in per-oxidase-catalyzed reactions and their potential function in vivo. Biophys. Chem. 72:63-72.
Mott KA, Buckley TN (1998) Stomatal heterogeneity. J. Exp. Bot. 49:407-417.
Mott KA, Buckley TN (2000) Patchy stomatal conductance: emergent collective behavior of stomata. Trends Plant Sci. 5:258-262.
Ng CK-Y, McAinsh MR (2003) Encoding specificity in plant calcium signalling: hot-spotting the ups and downs and waves. Ann. Bot. 92:477-485.
Nobel PS (1999) Physicochemical and environmental plant physiology. Academic Press, San Diego.
Pearcy RW, Ehleringer J, Mooney HA, Rundel PW (1989) Plant physiological ecology: field methods and instrumen-tation. Chapman and Hall, New York.
Pincus SM (1991) Approximate Entropy as a measure of sys-tem complexity. Proc. Natl. Acad. Sci. USA 88:2297-301. Pincus SM (1994) Greater signal regularity may indicate
in-creased system isolation. Math. Biosci. 122:161-181. Pincus SM, Cummins TR, Haddad GG (1993) Heart rate
con-trol in normal and aborted SIDS infants. Am. J. Physiol. 264:R638-646.
Pincus SM, Huang WM (1992) Approximate entropy: statis-tical properties and applications. Commun. Statist. Theor. Meth. 21:3061-3077.
Pincus SM, Keefe DL (1992) Quantification of hormone pul-satility via an approximate entropy algorithm. Am. J. Phys-iol . 262:E741-754.
Pincus SM, Mulligan T, Iranmanesh A, Gheorghiu S, God-schalk M, Veldhuis JD (1996) Older males secrete lutein-izing hormone (LH) and testosterone more irregularly, and jointly more asynchronously, than younger males. Proc. Natl. Acad. Sci. USA 93:14100-14105.
Pincus SM, Padmanabhan V, Lemon W, Randolph J, Midgley AR (1998) FSH is secreted more irregularly than LH in both human and sheep. J. Clin. Invest. 101:1318-1324.
Pincus SM (2000) Irregularity and asynchrony in biologic net-work signals. Meth. Enzymol. 321:149-182.
Pincus SM (1995) Approximate entropy (ApEn) as a com-plexity measure. Chaos 5:110-117.
Pincus SM, Goldberger AL (1994) Physiological time-series analysis: What does regularity quantify? Am. J. Physiol. 266:H1643-1656.
Prado CHBA, Wenhui Z, Rojas MHC, Souza GM (2004) Sea-sonal leaf gas exchanges and water potential in a woody cer-rado species community. Braz. J. Plant Physiol. 16:7-16. Rascher U, Hütt M-T, Siebke K, Osmond B, Beck F, Lüttge
Reddy ASN (2001) Calcium: silver bullet in signaling. Plant Sci. 160:381-404.
Sharpe PJ, Wu H, Spence RD (1987) Stomatal mechanics. In: Zeiger E, Farquhar GD, Cowan IR (eds), Stomatal Mechan-ics, pp.91-114. Stanford University Press, Stanford. Souza GM, Manzatto AG (2000) Hierarquia auto-organizada
em sistemas biológicos. In: D’Ottaviano IML, Gonzáles MEQ (eds), Auto-organização: Estudos Interdisciplinares, pp.153-173 CLE/UNICAMP, Campinas.
Souza GM, Aidar ST, Giaveno CD, Oliveira RF (2003) Drought stability in different common bean genotypes. Crop Breed. Appl. Biotechnol. 3:203-208.
Souza GM, Cardoso JVM (2003) Toward a hierarchical con-cept of plant stress. Isr. J. Plant Sci. 51:29-37.
Souza GM, Buckeridge MS (2004) Sistemas complexos: novas formas de ver a botânica. Rev. Bras. Bot. 27:407-419. Souza GM, Oliveira RF, Cardoso VJM (2004a) Temporal
dy-namics of stomatal conductance of plants under water defi-cit: can homeostasis be improved by more complex dynam-ics? Braz. Arch. Biol.Technol. 47:423-431.
Souza GM, Ribeiro RV, Santos MG, Ribeiro HL, Oliveira RF (2004b) Functional groups of forest succession as dissipative structures: an applied study. Braz. J. Biol. 64:707-718.
Souza GM, Ribeiro RV, Pincus SM (2004c) Changes in net-work connectance and temporal dynamics of gas exchange in Citrus sinensis under different evaporative demands. Braz.. J. Plant Physiol. 16:119-130.
Souza GM, Ribeiro RV, Santos MG, Ribeiro HL, Oliveira RF (2004d) Approximate Entropy as a measure of complexity in sap flow temporal dynamics of two tropical tree species under water deficit. Ann. Braz. Acad. Sci. 76:625-630. Trewavas A (1986) Understanding the control of plant
devel-opment and the role of growth substances. Aust. J. Plant Physiol. 13:447-457.
Van Voris P, O’Neill RV (1980) Functional complexity and ecosystem stability. Ecology 61:1352-1360.
Webb AAR (1998) Stomatal rhythms. In: Lumsden PJ, Millar AJ (eds), Biological Rhythms and Photoperiodism in Plants, pp.69-79. Bios Scientfic Publishers, Oxford.
Willians GP (1997) Chaos theory tamed. Joseph Henry Press, Washington DC.
Yates FE (1994) Order and complexity in dynamical systems: homeodynamics as a generalized mechanics for biology. Mathl.. Comput.. Modelling 19:49-74.