ECOLOGY, BEHAVIOR AND BIONOMICS
Altitudinal Distribution and Body Resource Allocation in a High Mountain
Social Wasp (Hymenoptera: Vespidae)
A
NDREAR
ODRÍGUEZ-J
IMENEZ1ANDC
ARLOSE. S
ARMIENTO21Calle 135ª No- 91-20, Bogotá, Colombia, [email protected]
2Instituto de Ciencias Naturales, Universidad Nacional de Colombia, A. A. 7495, Bogotá, Colombia [email protected]
Neotropical Entomology 37(1):001-007 (2008)
Distribuição Altitudinal e Alocação de Recursos no Corpo em uma Vespa Social de Montanha Alta
(Hymenoptera: Vespidae)
RESUMO - A regra de Jame propõe uma relação direta entre o tamanho do corpo e a altitude. Muitos estudos são relacionados a essa regra; no entanto, poucos analisam as mudanças proporcionais em partes do corpo ao longo de gradientes. Foi estudada a variação morfológica em Agelaia pallipes (Olivier) em cinco faixas altitudinais (2600-3380 m), no Santuario de Iguaque (Colombia), com o objetivo de testar se a espécie segue a regra de Jame e se o tamanho de determinadas estruturas varia homogeneamente ao longo do gradiente. O efeito da altitude em estruturas foi testado com análise de variância multivariada (MANOVA), e a relação entre cada variável e altitude avaliada com análises de regressão. A MANOVA mostrou diferenças no tamanho das estruturas entre os locais. O aumento na altura conduz à redução no tamanho de corpo, especialmente no comprimento do fêmur traseiro e na largura da cabeça. No entanto, medidas de estruturas relacionadas ao vôo, tais como o comprimento do mesosoma, largura do mesoscutum, e ainda, tamanho da asa anterior, apresentam tendência inversa. É possível que todas as mudanças sejam conseqüência da redução de alimento e da diminuição da pressão atmosférica. A temperatura baixa das altitudes maiores pode limitar o forrageamento e, portanto, os recursos. A baixa pressão atmosférica torna o vôo mais difícil e pode resultar no aumento do tamanho das asas e dos músculos do vôo. Este trabalho enfatiza a necessidade de estudos relacionados a mudanças nas proporções corporais em espécie com amplas distribuições, latitudinal e altitudinal.
PALAVRAS-CHAVE: Regra de Jame, regra de Bermann, faixa altitudinal, Agelaia
ABSTRACT - Jame´s rule proposes a direct relationship between body size and altitude. There are several studies about this rule; however, few studies analyze proportional changes in body parts along gradients. The morphological variation of Agelaia pallipes (Olivier) in fi ve sites along an altitudinal gradient (2600-3380 m) in the Santuario de Iguaque, Colombia, were studied in order to test whether or not the species follows Jame´s rule, and whether body parts follow a homogeneous variation. Body variation analysis was conducted through multivariate analysis of variance (MANOVA) and the relationship between altitude and each morphometric measurement was studied through regression analyses. The MANOVA indicated signifi cant differences among sites. An increase in altitude leads to a reduction in body size, especially in hind femur length and head width. However, measurements linked to fl ight such as mesosoma height, mesoscutum width, and fore wing size showed a reverse tendency. Possibly all described changes are consequence of both reduction on food availability and lower atmospheric pressure. The low temperature of high areas may strongly limit foraging and thus food availability. Lower atmospheric pressure reduces fl ight potential and may result in an increase in size of both wings and fl ight muscles. This paper underscores the need to study in detail the changes in body proportions in species with wide distribution ranges in latitude and altitude.
KEY WORDS: Jame´s rule, Bergmann´s rule, altitudinal gradient, Agelaia, trade-off
Karl Bergmann (1847) observed that within closely related warm blooded taxa, larger species inhabit northern and colder areas while smaller species are found in southern and warmer areas. He proposed that this pattern results from
an extended version of Bergmann´s rule to the intraspecifi c level and due to the obvious differences in the mechanisms that may generate these gradients, Blackburn et al. (1999) suggested naming this pattern as “Jame’s rule”.
Bergmann´s and Jame´s rules have found strong support in several studies for homeotherms (Roberts 1978, Meiri & Dayan 2003, Blackburn & Hawkins 2004). However, contradictory results have been obtained in ectotherms (Blanckenhorn & Demont 2004). For example, individuals of the cricket Melanoplus sanguinipes (Fabricius) and species of geometrid moths are larger in lower altitudes (Mousseau 1997, Brehm & Fiedler 2004); specimens of the frog Rana temporaria (L.) and these of the dragonfly Enallagma cyathigerum (Charpentier) show a not linear but concave latitude-body size relationship (Johansson 2003, Laugen et al. 2005); in neotropical butterfl ies larger specimens are found at intermediate altitudes (Hawkins & DeVries 1996); in other cases, the changes observed in body size are directly related with latitude while are negatively related with altitude (Arnett & Gottelli 1999).
Despite the interest generated by these patterns and their presence in several taxa, not a single explanatory mechanism can be postulated due to obvious intrinsic differences between the organisms (i. e., homeotherms vs poikilotherms) and to the differences in the environmental challenges faced by them (Partridge & Coyne 1997, Blackburn et al. 1999, Blanckenhorn & Demont 2004, Brehm & Fiedler 2004). In some cases classic environmental factors such as temperature or latitude are claimed as responsible while in others factors such as daylight length, season length, and development temperature are defi ned as infl uential.
There are several studies with ants that explore the relationship between latitude, altitude, and either colony size or body size; Kaspari & Vargo (1995), for example, found that extreme latitudes hold larger colonies and they explained this as a strategy to survive winter starvation. This explanation is known as the endurance hypothesis and found support from Heinze et al. (2003) paper where worker size in Leptothorax acervorum (Fabricius) decreases but colony size increases with latitude. Porter & Hawkins (2001) however, questioned the application of these results to all social insects. We are unaware of papers studying Jame´s rule (or Bergmann´s rule in an extended sense) in social wasps despite that there are several species with wide altitudinal and latitudinal ranges.
On the other hand, size variation of body parts along a gradient does not have to follow an uniform trend because species habits and environmental conditions can determine stronger selective regimes that restrict the variation degree in some structures over others (Stern & Emlen 1999, Hodkinson 2005). Studies about Bergmann´s or Jame´s rules have been characterized by using just one structure as body size reference but these do not look at the proportional changes among individual parts (Hawkins & DeVries 1996, Mousseau 1997, Arnett & Gottelli 1999, Brehm & Fiedler 2004). It is possible that, in addition to a general body size change, there is reallocation of resources generating opposite body part tendencies along the gradient or body part size adjustments according to environmental challenges (Hilton et al. 2000). For example, low atmospheric pressure has been
identifi ed as an explanation for larger wing size in fl ying insects (Hodkinson 2005, Dillon et al. 2006); if additionally, a body size reduction with altitude was identified, we may expect a larger proportion of resources allocated for structures linked to fl ying and thus, a proportional increase in their size.
Vespids are generalist predators that forage along large areas searching for prey to feed their larvae; colony success depends mostly on the capacity of the foragers to find food, even to the level that strong selection for fast forager production was identifi ed (Jeanne & Morgan 1992); an increase in forager number will regulate the average food intake to the colony and, thus, success chances (Karsai & Wenzel 1998). Consequently, fl ying structures will be very important in species survival.
Here we studied morphometric changes in a social wasp species along an altitudinal gradient. We explore both body size and proportional changes in body parts sizes such as head, mesosoma, wings, legs, and metasoma. We found that in addition to a reduction in body size with altitude, the opposite of Jame´s rule, there is a proportional increase in size for parts related with fl ying such as wings and mesosoma. This paper concurs with these authors that questions Jame´s rule application for ectotherms in general and for social insects in particular.
Materials and Methods
Agelaia pallipes (Olivier) is a swarm-founding social wasp species found from Costa Rica to northern Argentina north (Richards 1978); in Colombia this is a common species in high mountain forests up to 3380 m of altitude, and it is very abundant in the study area. Nests are ovoid, of about 50 cm of maximum diameter; combs are surrounded by an envelope composed by several irregular layers. Colonies can hold up to 16,500 individuals. Nests can be found either exposed or within trunk holes (Sarmiento 1993).
This study was conducted in the Santuario Nacional de Flora y Fauna de Iguaque (5º25’N 73º27’W approx.) where the higher records for this species were found. This national park is of about 6,750 ha. Altitudes range between 2400 and 3800 m.a.s.l. Temperatures around the 2800 m level range between 4ºC and 12ºC. Most of the park is composed by cloud forest and paramo. All wasps collected (7-36 individuals per site) with malaise traps between mid February and mid March 2001 were measured. We restrict our data to a one month maximum span only to reduce the effect of season on body size (Aguirre and Sarmiento in prep). Sampling was conducted in fi ve sites as follows: Cabaña Chaina (2600 m), Cabaña Carrizal (2850 m), Cerro Pan de Azúcar, (3300 m), Quebrada Carrizal, (3350 m), and Lagunillas (3380 m).
altitudes only (2600 m and 3380 m) (Fig. 1). We identifi ed and excluded outlier specimens by visual inspection of plots of pairs of variables.
Samples were compared with a multivariate ANOVA (MANOVA) analysis. P value was obtained with the Wilks-Lambda test (Į = 0.05). These analyses were carried out with the statistical software SAS (SAS 1985). Additionally, we compared morphometric changes among samples controlling the general size effect (Somers 1986). To do this we exclude fore wing measurements. After a principal component analysis via correlation matrix, we choose the measurement that better describes the general size of the animal, then, we build up a new matrix with the residuals of the regression analyses between that measurement and the other seven structures studied. These analyses were conducted with the software STATISTICA (StatSoft 2001). The new data matrix was used to conduct a new MANOVA analysis as described before. To describe the relationship between altitude and measurements, we carry out Spearman rank correlation and quadratic regression analyses for both unmodifi ed data and residuals. Regressions were conducted with the software STATISTICA (StatSoft 2001). Length and width of the fore wing from extreme altitudes (2600-3380 m) were compared by means of a MANOVA as described above. In every analysis we tested for the fulfi llment of the statistical tests requirements.
Results
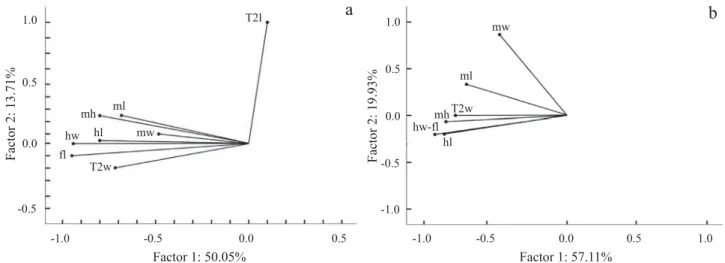
The PCA analysis indicated that 2nd metasomal tergite length (T2l) differs from all others (Fig. 2a); we considered that this difference is due to the diffi culty to determine the
exact length of that structure; thus, we remove it from the posterior analyses.
Thefi rst component of the PCA, excluding the 2nd metasomal tergite length (T2l), explains about 57% of the variation; the more infl uential variables were head width (hw) and hind femur length (fl ) both with a factor contribution of about 0.21. The second component explains about 12% of the variation and the more infl uential variable for this factor was mesoscutum width (mw) with a contribution of 0.79 (Fig. 2b).
There was an effect of the altitude among samples in both cases, with the unmodifi ed data (F28= 4.62, P < 0.0001) and with the residuals (F28= 2.09, P = 0.005). For the unmodifi ed data the effect of the altitude was signifi cant for every structure but when we used the residuals, only 2nd metasomal tergite width (T2w) and head length (hl) were signifi cant (Table 1); we did not found a clear pattern to explain these differences (Fig. 3)
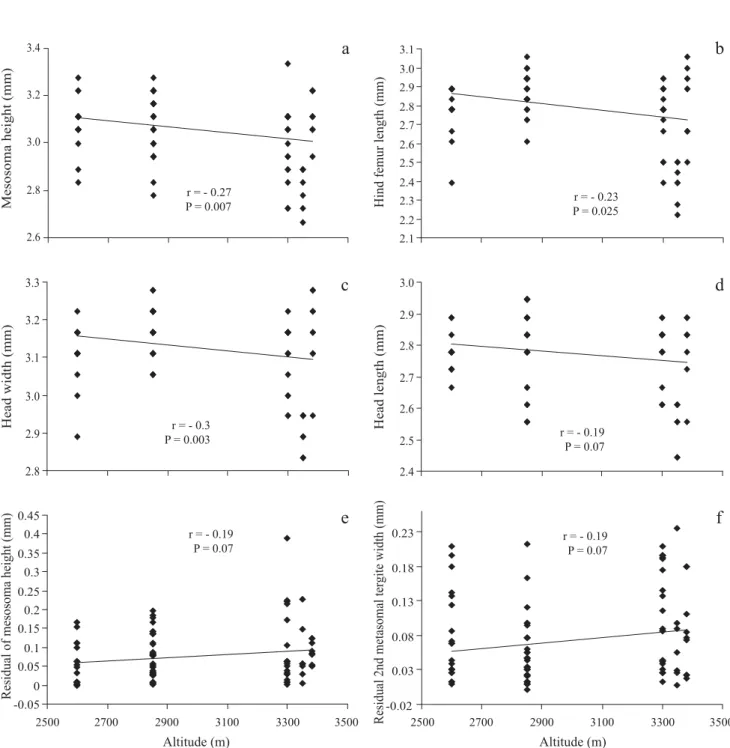
All quadratic regressions had lower fit to data than linear regressions and thus are not discussed here. With the exception of mesoscutum width (mw), the slope of the regressions between altitude and the other seven variables was negative; however, only three of these were signifi cant as follows: mesosoma height (r = -0.27, P = 0.007), hind femur length (r = -0.30, P = 0.003), and head width (r = -0.23, P = 0.025) (Figs. 4a-c). The sample from 3350 m was signifi cantly smaller than the others; however the removal of these specimens did not alter the general patterns observed. Interestingly, samples from higher altitudes have larger variation than samples from lower altitudes (Fig. 5).
The slopes of the regressions with the residuals of fi ve measurements were negative but in no case were these signifi cant. The slopes for the regressions with mesosoma height and 2nd metasomal tergite width were positive and Fig. 1. Structures measured in A. pallipes (Olivier). (a) head width, (b) head length, (c) mesoscutum width, (d) mesosoma length, (e) mesosoma height, (f) hind femur length, (g) 2nd metasomal tergite width, (h) 2nd metasomal tergite length, (i) fore wing length, (j) fore wing width.
a b
c
d
e
f g
h
i
Fig. 2. Principal component analysis among measured structures. (a) including eight structures, and (b) excluding 2nd metasomal tergite length. ml = mesosoma length, mh = mesosoma height, T2w = 2nd metasomal tergite width, T2l = 2nd metasomal tergite length,fl = hind femur length, mw = mesoscutum width, hw = head width, hl = head length.
Table 1. Effect of altitude for every structure considered through the analyses of variance for the wasps collected at the
fi ve altitudes. Hind femur length was excluded of the analyses of residuals because it was used as reference for general body size (see methods).
Unmodified data Residuals
F4, 92 P F4, 92 P
Mesosoma length 4.51 0.0023 0.45 0.77
Mesosoma heigth 9.81 < 0.0001 1.01 0.41
2nd metasomal tergite width 6.24 0.0002 2.57 0.04 2nd metasomal tergite length 7.28 < 0.0001 1.23 0.30 Hind femur length 23.81 < 0.0001 --- ---
Mesoscutum width 5.52 0.0005 2.12 0.08
Head width 23.21 < 0.0001 2.12 0.08
Head length 11.01 < 0.0001 3.57 0.009
Fig. 3. Average size for (a) head length along the altitudinal gradient and (b) 2nd metasomal tergite width.
1.0
0.5
0.0
-0.5
Factor 2: 13.71%
-1.0 -0.5 0.0 0.5
a
T2l
ml
mw mh
T2w fl
hw hl
1.0
0.5
0.0
-0.5
Factor 2: 19.93%
-1.0 -0.5 0.0 0.5
b
ml mw
mhT2w hw-fl
hl
-1.0
Factor 1: 50.05% Factor 1: 57.11%
1.0
0 0.02 0.04 0.06 0.08 0.1 0.12
2500 2700 2900 3100 3300 3500
Altitude (m)
Residual mean head length (mm)
0 0.02 0.04 0.06 0.08 0.10 0.12 0.14
2500 2700 2900 3100 3300 3500
Altitude (m)
Residual 2nd metasomal tergite width (mm)
a
b
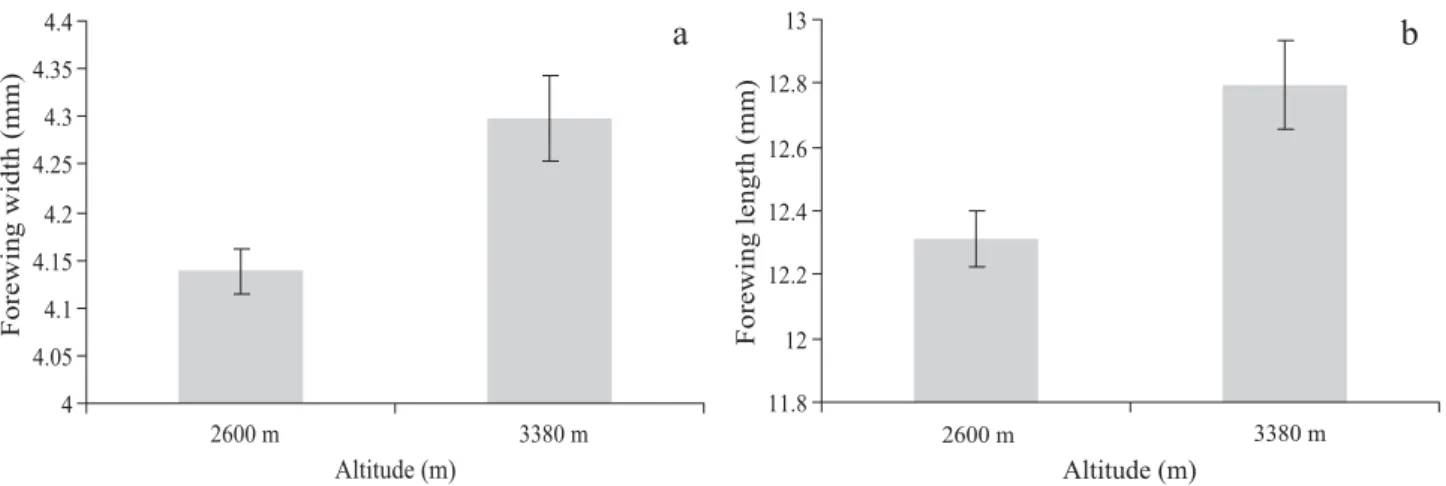
close to signifi cance (Figs. 4e-f). Wing measurements were different between the two extreme altitudes considered (MANOVA, F14= 7.24, P = 0.007) with the wings larger for
Fig. 4. Regression analyses between altitude and six measurements. Regressions for (a) mesosoma height, (b) hind femur length, and (c) head width were signifi cant while regression for (d) head length was not. Regressions for (e) residuals of mesosoma height, and (f) 2nd metasomal tergite width were positive and close to signifi cance.
2.6 2.8 3.0 3.2 3.4
Mesosoma height (mm)
2.1 2.2 2.3 2.4 2.5 2.6 2.7 2.8 2.9 3.0 3.1
Hind femur length (mm)
2.8 2.9 3.0 3.1 3.2 3.3
Head width (mm)
2.4 2.5 2.6 2.7 2.8 2.9 3.0
Head length (mm)
-0.05 0 0.05 0.1 0.15 0.2 0.25 0.3 0.35 0.4 0.45
2500 2700 2900 3100 3300 3500
Altitude (m)
Residual of mesosoma height (mm)
-0.02 0.03 0.08 0.13 0.18 0.23
Residual 2nd metasomal tergite width (mm) 2500 2700 2900 3100 3300 3500
Altitude (m)
a
b
c
d
e
f
r = - 0.27
P = 0.007 P = 0.025r = - 0.23
r = - 0.3
P = 0.003 r = - 0.19
P = 0.07
r = - 0.19 P = 0.07
r = - 0.19 P = 0.07
Discussion
PCA analysis indicated that most of the structures follow a similar trend with both hind femur length and head width being the most infl uential. Similar results were obtained in other studies (Orr 1996, Mousseau 1997); these results suggest that future general body size studies with this wasp species may use any of these structures as indicators.
As in many other studies with insect species (Mousseau 1997),A. pallipes (Olivier) follows the inverse of Jame´s rule. The mechanism to explain this result for insect species in temperate regions involves growing season length.
In addition to the complex physiological responses of insects to near freezing temperatures (Sinclair et al. 2003),
fl ying species may suffer a double negative effect of this factor that limits foraging: in the fi rst place, it increases the energy requirements to obtain the minimal body temperature forfl ying; in the second place, temperatures may reach an extreme minimum that effectively reduces the total fl ying time available (Kingsolver 1985, Hodkinson 2005). For a wasp colony these changes may mean a reduction in the amount of food brought to the brood and, thus, either a reduction in individual body size or a reduction in colony number. We have no data on colony size along altitudinal gradients but we found a general reduction in individual body size. There are also indications that this species adjusts worker body size according to rain amount (Aguirre & Sarmiento in prep). On the other hand, larger variation in high elevation samples may result from the stronger variation in environmental conditions of high altitude Andes. Since a colony may have several adult cohorts, these may have different body sizes as a result of the different conditions experienced during development.
Two strategies have been identified to solve the challenges imposed by low temperatures in insects: fi rst insects reduce body size, and second, insects exhibit darker body coloration; both strategies may speed up solar energy intake (Hodkinson 2005, Laugen et al. 2005). We may expect that darkening will be more noticeable on the mesosoma where fl ying organs are located. The mesoscutum of A. pallipes (Olivier) presents a brown coloration with two yellow longitudinal medial bands. We compared the proportion of these two colorations on the mesoscutum but we did not fi nd differences between the populations of the extreme altitudes measured (2600 m and 3380 m) (Anova F1, 20 = 1.60, P = 0.22); however, it was evident to us that wasps from higher altitudes have darker both brown and yellow colorations. Perhaps a photometric analysis may allow a quantitative approach to this problem. Another possibility is that foragers cope with heating temperatures adjusting their fl ying behavior as demonstrated for other insects (Dillon et al. 2006)
Interestingly, an increase in the size of measurements was associated with flying structures. The residuals of both mesosoma height and mesoscutum width followed a positive trend which may indicate a larger mesosomal cavity and possibly a larger muscular mass (Snodgrass 1935). Additionally, individuals from higher areas have larger wings than individuals from lower areas (F2, 14 = 7.24, P = 0.007). These results agree with literature references that insects from higher altitudes compensate for the greater fl ying diffi culties, due to lower air density, with an increase in wing size and
fl ying strength (Hilton et al. 2000, Hodkinson 2005, Dillon et al. 2006)
The two described trends indicated that A. pallipes (Olivier) redistributed its resources to increase fl ying strength while reducing body size. These results suggest that species along either altitudinal or latitudinal gradients may experience complex processes rather than just a homogeneous reduction or increase in body size and, thus, call for taking a closer look to the effect of these environmental factors on species biology. In this sense, this paper concurs with the results of Hilton et al. (2000) who point out organ size adjustments following environmental challenges.
Fig. 6. Fore wing size of the samples from two extreme elevations 2600 m (n = 9) and 3380 m (n = 8); (a) fore wing width, and (b) fore wing length.
Fig. 5. Mean hind femur length of A. pallipes (Olivier) along the altitude gradient.
2.2 2.3 2.4 2.5 2.6 2.7 2.8 2.9 3
2500 2700 2900 3100 3300 3500
Altitude (m)
Mean hind femur length (mm)
4 4.05 4.1 4.15 4.2 4.25 4.3 4.35 4.4
2600 m 3380 m
Altitude (m)
Forewing width (mm)
11.8 12 12.2 12.4 12.6 12.8 13
2600 m 3380 m
Altitude (m)
Forewing length (mm)
Acknowledgments
Authors thank A. Amarillo, K. Wolfe, S. Jansen, H. Aguirre, and Z. García for their comments. We thank Pedro Reina (Santuario Iguaque) for his help with fi eld sampling. Bolivar Garcete-Barrett provided advice with the identifi cation of the species. An anonymous reviewer provided insightful comments. This research was supported by the Sciences College and the Instituto de Ciencias Naturales of the Universidad Nacional de Colombia, the Colombian National Parks Unit, the Alexander von Humboldt Institute, Colombia, and the NSF grants DEB 9972024 and 0205982 to M. Sharkey and B. Brown.
References
Anguilleta, M.J. & A.E. Dunham. 2003. The temperature-size rule in ectotherms: simple evolutionary explanations may not be general. Am. Nat. 162: 332-342.
Arnett, A. & N. Gotelli. 1999. Bergmann´s rule in the ant
lion Myrmeleon immaculatus DeGeer (Neuroptera:
Myrmeleontidae): geographic variation in body size and heterozygosity. J. Biogeogr. 26: 275-283.
Bergmann, K. 1847. Ueber die Verhältnisse der Wärmeökonomie der Thiere zu ihrer Grösse. Gottinger Studien. 3: 595-708.
Blackburn, T.M. & B.A. Hawkins. 2004. Bergmann’s rule and the mammal fauna of northern North America. Ecography 27: 715-724.
Blackburm, T.M., K.J. Gaston & N. Loder. 1999. Geographic gradients in body size: A clarifi cation of Bergmann`s rule. Divers. Distrib. 5: 165-174
Blanckenhorn, W.U. & M. Demont. 2004. Bergmann and converse bergmann latitudinal clines in arthropods: Two ends of a continuum? Integr. Comp. Biol. 44: 413-424.
Brehm, G. & K. Fiedler. 2004. Bergmann´s rule does not apply to geometrid moths along an elevational gradient in an Andean montane rain forest. Glob. Ecol. Biogeogr. 13: 7-14.
Dillon, M.E., M. Frazier & R. Dudley. 2006. Into thin air: Physiology and evolution of alpine insects. Integr. Comp. Biol. 46: 1-13.
Hawkins, B. & P. DeVries. 1996. Altitudinal gradients in the body sizes of Costa Rican butterfl ies. Acta Oecol. 17: 185-194.
Heinze, J., S. Foitzik, B. Fischer, T. Wanke & V. Kipyatkov. 2003. The signifi cance of latitudinal variation in body size in a holarctic ant,Leptothorax acervorum. Ecography 26: 349-355.
Hilton, G.M., K. Lilliendahl, J. Solmundsson, D. Houston & R. Furness. 2000. Geogroaphical variation in size of body organs in seabirds. Func. Ecol. 14: 369-379.
Hodkinson, I.D. 2005. Terrestrial insects along elevation gradients: Species and community responses to altitude. Biol. Rev. 80: 489-513.
Jeanne, R. & R. Morgan. 1992. The infl uence of temperature on nest site choice and reproductive strategies in Polistes wasps. Ecol. Entomol. 17: 135-141.
Johansson, F. 2003. Latitudinal shifts in body size of Enalllagma cyathigerum (Odonata). J. Biogeogr. 30: 29-34.
Karsai, I. & J. Wenzel. 1998. Productivity, individual-level and colony-level flexibility, and organization of work as consequences of colony size. Proc. Natl. Acad. Sci. U.S.A. 95: 8665-8669.
Kaspari, M. & E. Vargo. 1995. Colony size as a buffer against seasonality: Bergmann´s rule in social insects. Am. Nat. 145: 610-632.
Kingsolver, J. 1985. Thermoregulatory significance of wing melanization in Pieris butterfl ies (Lepidoptera: Pieridae): physics, posture, and pattern. Oecologia 66: 546-553.
Laugen, A.T., A. Laurila, K.I. Jönsson, F. Söderman & J. Merilä. 2005. Do common frogs (Rana temporaria) follow Bergmann’s rule? Evol. Ecol. Res. 7: 717-731.
Meiri, S. & T. Dayan. 2003. On the validity of Bergmann´s rule. J. Biogeog. 30: 331-351.
Mousseau, T.A. 1997. Ectotherms follow the converse of Bergmann´s rule. Evolution 51: 630-632.
Orr, M.R. 1996. Life-history adaptation and reproductive isolation in a grasshopper hybrid zone. Evolution 50: 704-716.
Partridge, L. & J. Coyne. 1997. Bergmann´s rule in ectotherms: Is it adaptive. Evolution 51: 632-635.
Porter, E. & B. Hawkins. 2001. Latitudinal gradients in colony size for social insects: Termites and ants show different patterns. Am. Nat. 157: 97-106.
Richards, O.W. 1978. The social wasps of the Americas. Excluding the Vespinae. British Museum (Natural History), London, 584p.
Roberts, D.F. 1978. Climate and human variability. 2nd ed. Menlo
Park, Cummings, Massachussets, 123p.
Sarmiento, C.E. 1993. Abejas y avispas (Hymenoptera: Apidae, Vespidae, Pompilidae, y Sphecidae) del Santuario Nacional de Flora y Fauna de Iguaque, Boyacá, Colombia. Bol. Mus. Entomol. U. Valle. 1: 1-11.
SAS Institute. 1985. SAS user´s guide: statistics. V 5.1. SAS institute Inc. Hary NC.
Sinclair, B.J., P. Vernon, C.J. Klok & S.L. Chown. 2003. Insects at low temperatures: An ecological perspective. Trends Ecol. Evol. 18: 257-261.
Snodgrass, R. 1935. Principles of insect morphology. McGraw-Hill Co, New York, 667p.
Somers, K. 1986. Multivariate allometry and removal of size with principal component analysis. Syst. Zool. 35: 359-368.
StatSoft 2001. Statistica. (data analysis software system), version 6.
Stern, D. & D. Emlen. 1999. The developmental basis for allometry in insects. Development (Camb.) 126: 1092-1101.