ARENBERG DOCTORAL SCHOOL FACULTY OF SCIENCE
Study of natural and synthetic polymer
systems by advanced microscopy
techniques
Tiago Andrade Chimenez
Thesis presented in partial fulfilment of the requirements for the degree of PhD in Science
2016 Supervisors:
Tiago Andrade Chimenez
Estudos de sistemas poliméricos naturais e sintéticos utilizando técnicas
avançadas de microscopia
Tese apresentada ao Instituto de Química de São Carlos da Universidade de São Paulo e à Faculdade de Ciências da Katholieke Universiteit Leuven como parte dos requisitos para a obtenção do título de doutor em ciências
Área de concentração: Físico-Química
Orientadores: Prof. Dr. Marcelo Henrique Gehlen e Prof. Dr. Johan Hofkens
i
ACKNOWLEDGMENTS
I would like to use this space to express my gratitude to some people. First of all, I would like to thank my promoters, Prof. Marcelo H. Gehlen and Prof. Johan Hofkens. Thanks to them, I had the opportunity to perform my research in laboratories equipped with state-of-the art microscopes. I would also like to thank Prof. Frans De Schryver and Prof. Hiroshi Uji-I for accepting to be my assessors at KU Leuven.
My thanks to the CAPES and CNPq for the scholarship granted during my Ph.D.
I would also like to thank Prof. Antonio Aprigio da Silva Curvelo for have given the sugarcane bagasse samples used in some studies and for all support and discussion about topics related to sugarcane bagasse.
I would like to thank Magda and Karel for all support they gave me when I started to work with polymerization of styrene in KU Leuven. I would also like to thank Daniel Jänsch from Max Planck Institute for providing the NMP initiator samples.
I have a lot to thank to Leen Cuypers and Alexandre Mazzola, who helped in the establishment of the dual joint doctorate by USP and KU Leuven. Many thanks to Diego Lencione for all support related to the optical instrumentation.
I would also like to give my gratitude to those who have been working around the lab during the last years. I would like to mention some people that in some way have contributed to my PhD: Irlon, Isac, Vagner, Carlão, Adriel, Mafrinha, Camilo, Ronaldo, Carol, Anderson, Aline, Rafael, Renato, Paulo, Papako, Edson, Patricia, Stoyan, Kris, Eduardo, Ann Petré, Carine, Marino, Karolien, Wouter B, Elke, Bart, Stijn, Wouter S. I would also like to take this opportunity to express my gratitude to my whole family. Special thanks to my mother Cida, my sister Talita, and my cousin Bruno. Without their support, I would never get up here.
ii
PREFACE
This PhD thesis was initiated in the first half of 2011 in the Laboratory of Molecular
Fluorescence (LFM/IQSC), under supervision of Prof. Marcelo H. Gehlen. The two first
chapters are related to the study of sugarcane bagasse by autofluorescence confocal
microscopy and to the optical microscopy characterization of nanocrystalline cellulose.
From July 2013 to July 2014, a sandwich doctorate was performed in the Laboratory for
Photochemistry and Spectroscopy from KU Leuven/Belgium, under supervision of Prof.
Johan Hofkens. During this period, a study related to the nitroxide-based polymerization
of styrene was performed, in which single-molecule spectroscopy and microscopy such
as FCS and WFM were used. This stage of the research is described in Chapter 4.
On the way back to LFM, in Brazil, a FCS setup was implemented and a study of
diffusion properties of nanocrystalline cellulose fluorescently labelled was performed,
which is described in Chapter 3.
Therefore, this thesis is divided in four chapters. Each chapter contains, respectively,
iii
ABSTRACT
In the first chapter, he spatial distribution of fluorescent compounds in the sugarcane
bagasse matrix is investigated by confocal fluorescence microscopy and spectroscopy
with one and two-photon excitation. Autofluorescence images, emission spectra and
fluorescence lifetime measurements provided a tool for the characterization of natural
bagasse samples. Moreover, the technique allows the following of processes related to
the lignin removal.
Nanocrystalline cellulose (NCC) is a rod-shape nanofibre with 1–100 nm in diameter,
and tens to hundreds of nanometres in length. In Chapter 2, NCC was obtained via
sulphuric acid hydrolysis from Avicel®. Afterwards, the material was characterized by
classic electronic microscopy SEM and TEM, confirming the rod-shaped morphology
and the nano-sized structure. Conventional wide field microscopy was used as
fluorescence microscopy tool in the characterization of NCC, when dispersed in
polymeric solutions of PVA and PVP. The last part of Chapter 2 describes the
characterization of NCC structures by using the super-resolution fluorescence
microscopy STED (Stimulated Emission Depletion). The STED images showed a
resolution down to 50 nm, allowing the comparison with TEM and AFM microscopy
results.
In Chapter 3, the NCC was covalently labelled, by a click-chemistry reaction, with the
ATTO-532 dye. Properties related to diffusion coefficient of NCC were determined by
Fluorescence Correlation Spectroscopy (FCS). The diffusion of NCC dispersed in
solution of PEG, containing different amounts polymer, was also studied by FCS and
iv
heterogeneity details of NCC dispersions, which are related to the hydrophilic and
hydrophobic properties of the polymer solution.
In Chapter 4, it is presented a study of controlled radical polymerization by fluorescence
correlation spectroscopy (FCS) and wide-field fluorescence microscopy (WFM). These
techniques were used to determine the diffusion coefficients of growing polymer chains,
during the controlled radical polymerization process. Linear and star-shaped polystyrene
were grown via nitroxide-mediated polymerization (NMP) from alkoxyamine-based
initiators containing a highly fluorescent perylene diimide moiety. We demonstrate that
direct investigation of heterogeneity emerging during a controlled radical
polymerization process by means of fluorescence of single-molecule chain initiator
allows to obtain unravelling information related to the diffusion processes of the
v
RESUMO
O bagaço de cana-de-açúcar é um abundante coproduto obtido a partir da produção
convencional de etanol. No entanto, o bagaço vem se mostrando como uma importante
fonte para a produção de etanol de segunda geração. No primeiro capítulo da tese é
apresentado um estudo referente à distribuição espacial dos compostos na matriz de
bagaço de cana-de-açúcar. A investigação foi realizada utilizando microscopia de
fluorescência confocal e espectroscopia por excitação com um e dois fótons. Imagens de
autofluorescência em combinação com as medidas de fluorescência e tempos de vida
forneceram uma gama de informações necessárias para a caracterização de amostras de
bagaço. Além disso, a técnica permite o acompanhamento de processos relacionados
com a remoção de lignina.
A nanocelulose cristalina (NCC) é um material promissor devido as suas propriedades
intrínsecas, tais como seu formato alongado, medindo de 1 a 100 nm de diâmetro e seu
comprimento variando de algumas dezenas a centenas de nanômetros. No capítulo 2, a
nanocelulose cristalina foi obtida através da hidrólise da celulose cristalina (de
Avicel®) com ácido sulfúrico. Em seguida, o material foi caracterizado por técnicas de
microscopia SEM e TEM, confirmando a morfologia em forma de haste e a estrutura de
tamanho nanométrico. A microscopia de campo largo convencional foi utilizada como
ferramenta na caracterização da NCC dispersa em soluções poliméricas de PVA e PVP.
A última parte do capítulo 2 descreve a caracterização de estruturas de NCC usando a
microscopia de super-resolução de fluorescência STED (depleção de emissão
estimulada). As imagens mostraram uma resolução de até 50 nm, permitindo a
vi
No capítulo 3, a nanocelulose cristalina foi covalentemente marcada com o corante
ATTO-η32, através da chamada reação “click”. As propriedades relacionadas com o
coeficiente de difusão da NCC foram determinadas por espectroscopia de correlação de
fluorescência (FCS). Em uma etapa posterior, a NCC foi colocada em diferentes
soluções do polímero PEG, contendo quantidades diferentes. As propriedades dinâmicas
foram analisadas por métodos de FCS e WFM. O uso de técnicas de espectroscopia e
microscopia revelou detalhes relacionados à heterogeneidade das dispersões de NCC, as
quais estão relacionadas com as propriedades hidrofílicas e hidrofóbicas das soluções
vii
LIST OF ABBREVIATIONS
AAc – Acid ascorbic
AFM - Atomic force microscopy
APD - Avalanche photodiode detector
ATRP - Atom transfer radical polymerization
BF - Bleached fibre
BP - Bleached pith
BS - Beam splitter
BWB - Bleached whole bagasse
CAA - Camera assembly attached
CAQUI - Central Analítica de Química
CCD - Charge coupled device
CRP - Controlled radical polymerization
CU - Control unit
CW - Continuous wave
DCTP - Degenerative chain transfer polymerization
DF - Dichroic filter
DMSO - Dimethyl sulfoxide
EDTA - Ethylenediamine tetraacetic acid
EM-CCD - Electron-multiplying charge coupled device
EXP – Beam expander
FCS - Fluorescence correlation spectroscopy
viii
GC-MS - Gas chromatography mass spectrometry
GPC - Gel permeation chromatography
HMF - Hydroxymethylfurfural
CI - Crystallinity index
IQSC - Instituto de Química de São Carlos
IR - Infrared
IR - Iris
KULeuven - Katholieke Universiteit Leuven
L - Lens
LPF - Low-pass filter
M - Mirror
MM - Mobile mirror
MSD - Mean square displacement
MW - Molecular weight
NA - Numeric aperture
NADH - Nicotinamide adenine dinucleotide - hydrogen
NCC - Nanocrystalline cellulose
NF - Notch filter
NLC - Non-linear crystal
NMP - Nitroxide-mediated polymerization
NMR - Nuclear magnetic resonance
OB - Objective
OF - Optical fibre
ix
P - Prism
PA - Piezoelectric
PBS - Prism beam splitter
PDI - Polydispersity index
PDI* - Perylene diimide
PEG - Polyethylene glycol
PFD - Pre-focus system
PH - Pinhole
PP - Pulse picker
PRE - Persistent Radical Effect
PVA - Polyvinyl Alcohol
PVP - Polyvinylpyrrolidone
S - Sample
SD - Silicon detector
SEM - Scanning electron microscopy
SPT - Single-particle tracking
STED - Stimulated emission depletion
STEM - Scanning transmission electron microscopy
TEM - Transmission electron microscopy
THF - Tetrahydrofuran
TIRF - Total internal reflection fluorescence
TTL - Transistor-transistor logic
USP - Universidade de São Paulo
x
WP - Wave plate
WFM - Wide field microscopy
xi
LIST OF TABLES
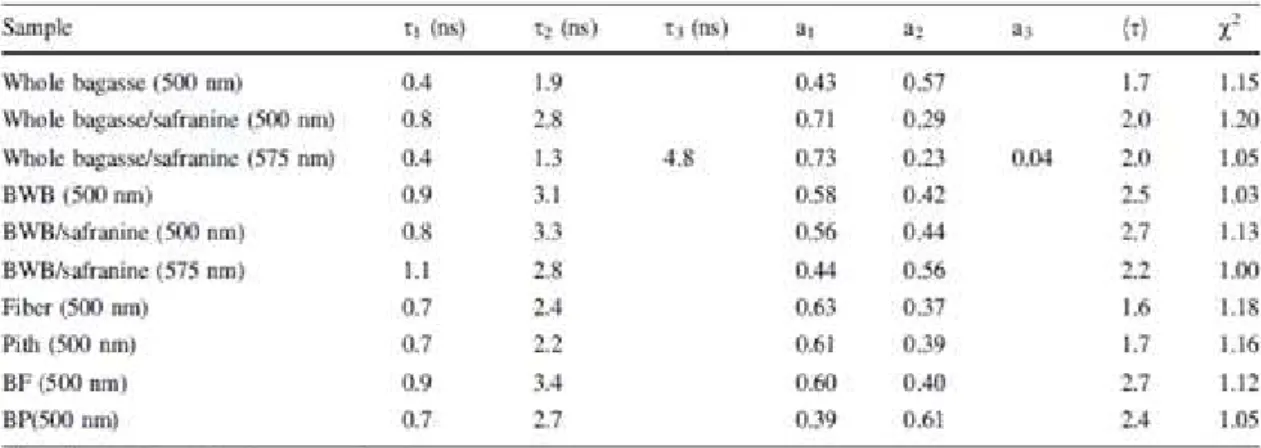
Table 1. Decay times (i) and normalized amplitudes (ai) of micrometre-sized emission
spots from cellulose samples isolated from sugarcane bagasse obtained by
multiexponential fitting.40 ... 20
Table 2. Decay times and normalized amplitude related to Avicel® and NCC. ... 42
Table 3. Diffusion coefficients Dt1 and Dt2 of rhodamine 6G, ATTO-532 and NCC. ... 60
Table 4. Weight Average Molecular Weight (Mw), Number Average Molecular Weight
xii
LIST OF FIGURES
Figure 1. Molecular structure of cellulose.7 ... 3
Figure 2. Structural composition of lignocellulosic biomass based on sugarcane.
Adapted from.10 ... 4
Figure 3. Confocal microscopy setup. Top picture: Microscope IX71 containing two
APD detectors, piezoelectric PI controller. Bottom picture: Maya 2000 Pro spectrometer
attached to the microscope (IQSC – USP)40. ... 10
Figure 4. Confocal optical schematic setup. APD: avalanche photodiode; BS: beam
splitter; CU: control unit; DF: dichroic filter; EXP: expander beam; IR: iris; L: lense;
LPF low-pass filter; M: mirror; MM: mobile mirror; NF: notch filter; NLC: non-linear
crystal; OB: objective; OF: optical fibre; PBS: prism beam splitter; PA: piezoelectric;
PH: pinhole; PP: pulse picker; S: sample; SD: silicon detector; W: wave plate. (IQSC – USP)41 ... 11
Figure 5. Wide field optical schematic. CAA: camera assembly attached; CU: control
unit; DF: dichroic filter; EXP: expander beam; IR: iris; M: mirror; MM: mobile mirror;
NF: notch filter; OB: objective; P: prism; PFD: pre-focus system; S: sample; W: wave
plate (IQSC – USP )41. ... 12
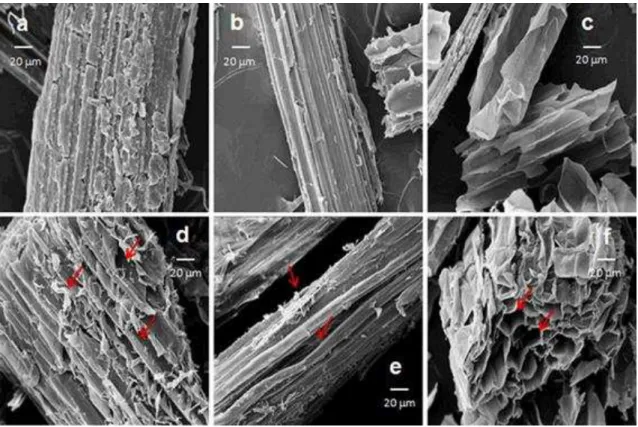
Figure 6. SEM images of bagasse samples: a whole bagasse, b fibre, c pith, d BWB, e
BF and f BP. Micro sized splinters are indicated by arrows in samples after bleaching
process.43 ... 14
Figure 7. Fluorescence microscopy images of a whole bagasse, b fiber, c pith, d BWB, e
BF and f BP. Samples were excited at 405 nm. The lateral colour scale bars are related
to the fluorescence intensity.43... 15
Figure 8. Fluorescence intensity image and decay traces of indicated emission spots
obtained by two-photon excitation at 800 nm of a) whole bagasse, b) fibre, c) pith, and
corresponding bleached samples, d) BWB, e) BF and f) BP. Scale bar 10 nm.43 ... 17
Figure 9. Two-photon fluorescence microscope images of a whole bagasse sample
obtained at a focal plane of a) 0 µm, b) 5 µm and c) 10 µm. Scale bar 10 µm. The lateral
xiii
Figure 10. Fluorescence intensity images and decay of each indicated emission spot
obtained by two-photon excitation at 800 nm of samples stained with safranine: a)
whole bagasse and b) BWB. Scale bar 10 nm. The lateral colour scale bars are related to
the fluorescence intensity.43 ... 22
Figure 11. Fluorescence spectra from (solid curve) fibre, (long dashed curve)
fibre/safranine, (two dotted dashed curve) BF, single dotted dashed curve) BF/safranine
and (shorted dashed curve) Avicel. Samples were excited at 405 nm and spectral
intensity was recorded using a linear CCD spectrometer fibre coupled to the binocular
side port of the microscope.43 ... 24
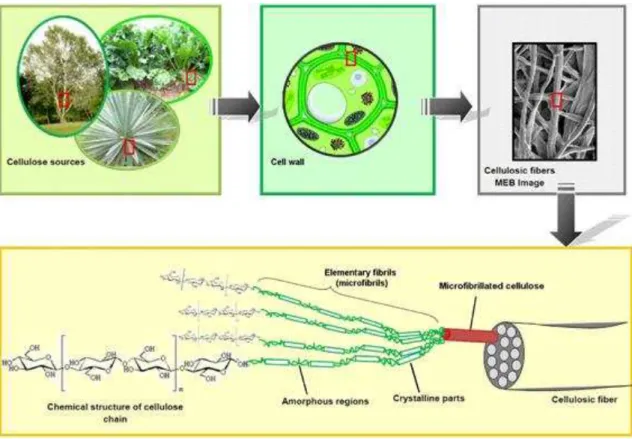
Figure 12. From the cellulose sources to the cellulose molecules: Details of the
cellulosic fiber structure with emphasis on the cellulose micro fibrils.65 ... 29
Figure 13. SEM images of Avicel® samples. Morphologic details of microcellulose
particles. ... 35
Figure 14. TEM images of nanocrystalline cellulose, obtained from sulphuric acid
hydrolysis. ... 36
Figure 15. Diffratograms of Avicel® and NCC. The values of crystallinity index
calculated from method Segal et al were 57% to Avicel® and 70% to NCC. ... 37
Figure 16. WFM images of Avicel® (a and b) and NCC (c and d). ... 39
Figure 17. Fluorescence spectra of a) Avicel® and b) NCC obtained by excitation at
405 nm. ... 40
Figure 18. Fluorescence decays of a) Avicel® and b) NCC obtained by two-photon
excitation at 800 nm. ... 41
Figure 19. Wide field fluorescence images of a) solution of PVA-water/NCC and b)
PVP-isopropanol/NCC. ... 43
635 nm, power = 28.5 mW, size = 400x400p (10x10mm), dwell time = 0.4 ms and b)
xiv
Figure 21. a) Confocal and b) STED microscopy images and the respective profile of
the spot pointed from the yellow arrow. ... 45
Figure 22. Schematic diagram illustrating the various types of chemical modifications
on NCC surface.35 ... 50
Figure 23. Autocorrelation curves of rhodamine 6G, ATTO-532 and NCC/ATTO-532.
... 59
Figure 24. Prolate particle shape, in which b is the semi-minor axis of the structural unit
and a is the semi-major axis of the structural unit. ... 60
Figure 25. Autocorrelation curves of a) NCC/PEG/water, b) NCC/PEG/methanol and c)
NCC/PEG/acetonitrile at the PEG concentration of 2%, 5%, 10% and 20%. ... 63
Figure 26. a) NCC fraction and diffusion coefficient (Dt) in function of PEG content. b)
ATTO-532 fraction and diffusion coefficient (Dt) in function of PEG content. ... 65
Figure 27. Step-length distribution for a) NCC/PEG (50%)/water; b) NCC/PEG
(70%)/water; c) NCC/PEG (50%)/methanol; d) NCC/PEG (70%)/methanol; e)
NCC/PEG (50%)/acetonitrile and f) NCC/PEG (70%)/acetonitrile. Single particle
trajectories in a representative area are shown in the insets. ... 66
Figure 28. Mean square displacement (MSD) for a) NCC/PEG/water; b)
NCC/PEG/methanol and c) NCC/PEG/acetonitrile. ... 68
Figure 29. Diffusion coefficient of NCC as a function of PEG content (%). ... 70
Figure 30. General concept of controlled/living radical polymerization (CRP).162 ... 75
Figure 32. Activation–deactivation equilibrium in nitroxide-mediated polymerization. Bicomponent initiating system (a) and monocomponent initiating system (b). 162 ... 76
Figure 32. Structures of styrene (1) and of the alkoxyamine-based NMP initiators used
in this work (2 and 5: non-fluorescent initiators; 3 and 4: fluorescent initiators). ... 77
Figure 33. Sample holder device. ... 79
Figure 34. Schematic setup of the FCS and WFM (KU Leuven). ... 82
Figure 35. Raman spectra for the polymerization of styrene, mediated by a) System 1, b)
xv
Figure 36. GPC traces of the polystyrene obtained via NMP for the a) System 1, b)
System 2 and c) System 3. ... 86
Figure 37. Normalized FCS autocorrelation curves for the polymerization of styrene,
mediated by a) System 1, b) System 2 and c) System 3 at different reaction time. ... 88
Figure 38. a) Monomer conversion in function of polymerization time. B) Diffusion
coefficients plotted versus styrene conversion. Square symbols represent diffusion
coefficients related to polymerization mediated by linear initiator (system 1), round
symbols represent diffusion coefficients related to polymerization mediated by linear
initiator, containing fluorescent star-shaped initiator (system 3), and triangle symbols
represent diffusion coefficients related to polymerization mediated by star-shaped
initiator system 2). ... 90
Figure 39. Step-length distribution for a) system 1, b) system 2 and c) system 3. The
distributions exhibited are related to polymeric systems after 180 minutes of reaction.
Single molecule trajectories in a representative area are shown in the insets. ... 92
Figure 40. Mean square displacement (MSD) for system 1 (a), system 2 (b) and for
system 3 (c). Below of MSD graphs is shown the schematic representation of labelled
chain in their surroundings of respective system. Yellow circles shown in some chains
xvi
SUMMARY
ACKNOWLEDGMENTS ... i
PREFACE ... ii
ABSTRACT ... iii
RESUMO ... v
LIST OF ABBREVIATIONS ... vii
LIST OF TABLES ... xi
LIST OF FIGURES ... xii
CHAPTER 1: OPTICAL MICROSCOPY STUDY OF SUGARCANE
BAGASSE
ABSTRACT ... 21 INTRODUCTION ... 3
2 EXPERIMENTAL ... 7
2.1 Preparation of sugarcane bagasse samples ... 7
2.2 Labelling of sugarcane bagasse by safranine ... 7
2.3 Techniques ... 8
2.3.1 Scanning electron microscopy ... 8
2.3.2 Fluorescence confocal microscopy ... 8
2.3.3 Wide field microscopy ... 11
3 RESULTS AND DISCUSSION ... 13
3.1 Characterization of sugarcane bagasse by autofluorescence microscopy... 13
xvii
CHAPTER 2: PRODUCTION AND OPTICAL MICROSCOPY
CHARACTERIZATION OF NANOCRYSTALLINE CELLULOSE
ABSTRACT ... 27
1 INTRODUCTION ... 28
2 EXPERIMENTAL ... 32
2.1 Production of nanocrystalline cellulose by acid hydrolysis ... 32
2.2 Preparation of nanocrystalline/polymer composites ... 32
2.3 Techniques ... 32
2.3.1 X-ray diffraction ... 32
2.3.2 Transmission electron microscopy ... 33
2.3.3 Scanning electron microscopy ... 33
2.3.4 Confocal fluorescence microscopy ... 33
2.3.5 Wide field microscopy ... 34
2.3.6 Super-resolution microscopy by Stimulated emission depletion (STED) ... 34
3.1 Characterization of Avicel® NCC by electron microscopy and X-ray diffraction ... 35
3.2 Characterization of Avicel® NCC by wide field microscopy ... 38
3.3 Characterization of Avicel® NCC by steady and time-resolved fluorescence spectroscopy ... 39
3.4 Dispersion of NCC in polymers ... 42
3.5 Super-resolution optical microscopy of Avicel® and NCC ... 43
4 CONCLUSIONS ... 46
xviii
1 INTRODUCTION ... 49
2 EXPERIMENTAL ... 52
2.1 Obtaining NCC ... 52
2.2 Preparation of 1-azide-2,3-epoxypropane ... 52
2.3 Introducing azide groups to the surface of NCC ... 53
2.4 Labeling of azide functionalized NCC with ATTO-532 dye... 53
2.5 FCS measurements ... 53
2.6 Wide Field Measurements ... 56
3 RESULTS AND DISCUSSION ... 58
3.1 Determination of diffusion coefficient of NCC dispersions ... 58
3.2 Study of dynamic properties of different composites based on the interaction of NCC/polymer ... 60
4 CONCLUSIONS ... 71
CHAPTER 4: POLYMERIZATION OF STYRENE
ABSTRACT ... 731 INTRODUCTION ... 74
2 EXPERIMENTAL ... 77
2.1 Polymerization of styrene ... 77
2.2 Polymerization process ... 78
2.3 Measurements ... 80
2.3.1 GPC ... 80
2.3.2 Raman ... 80
2.3.3 FCS ... 81
xix
3 RESULTS AND DISCUSSION ... 83
3.1 Styrene nitroxide mediated polymerization ... 83
4 CONCLUSIONS ... 95
1
CHAPTER 1
2
ABSTRACT
The spatial distribution of the components in the sugarcane bagasse is a very important
issue related to its industrial application, including the production of second generation
ethanol. In addition, several cellulosic materials have been used to produce diverse
polymeric composites. Sugarcane bagasse samples including whole bagasse, fibre, pith,
and respective samples obtained after chemical bleaching were investigated using
confocal fluorescence microscopy and spectroscopy with one and two-photon
excitation. Images from unbleached samples showed longitudinally oriented emission
patterns in fibre walls containing lignin fraction. After bleaching treatment, the oriented
emission was partially disrupted. Autofluorescence from bleached samples, with a
residual lignin content of about 1%, was attributed to the presence of fluorophores
dispersed throughout the matrix, which induced the concomitant reduction of
fluorescence self-quenching. The combination of autofluorescence images with spectral
emission and lifetime measurements provides a tool for microscopic characterization of
natural bagasse samples. Moreover, the technique allows the monitoring of bleaching
3
1 INTRODUCTION
Lignocellulosic compounds are widely used as source of different fermentable sugars,
showing a great potential in production of ethanol of second generation and production
of biomaterials. 1-3 Lignocellulose may be found in plant tissues, wherein the major
composites are cellulose, polyoses and lignin. Polyoses are branched polysaccharides,
consisting of pentose, hexose and uric acid.4 Lignin is an aromatic biopolymer, which is
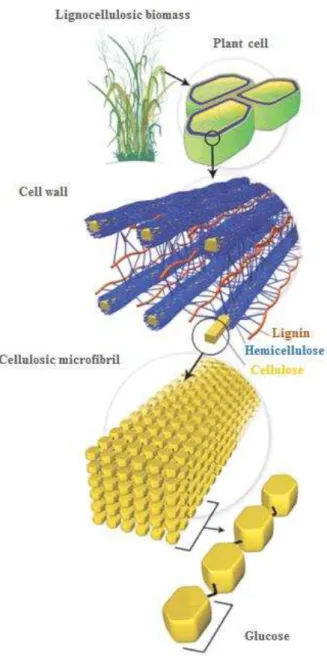
synthesized from the phenylpropanoid pathway.Figure 1 shows the chemical structure of the cellulose, a linear biopolymer with high molecular weight, containing units of 1,4 D-glucose, and crystalline and amorphous regions.5; 6
Figure 1. Molecular structure of cellulose.7
The reduction of emission of global warming gases provides a growing demand on
production of fuel obtained from renewable source. In this scenario, there is the
increasing necessity to produce biofuels.8; 9 In order to attend to the green production
claim it is necessary the development of new technologies related to the
depolymerization of lignocellulose materials. Sugarcane bagasse is a by-material that
has been used in sugarcane plant boilers to generate vapour and electricity. Figure 2
shows the schematic illustration of a typical lignocellulosic biomass based on
4
Figure 2. Structural composition of lignocellulosic biomass based on sugarcane. Adapted from.10
Bagasse is a residue obtained from the processing of sugarcane. This product has a
substantial chemical and morphological heterogeneity. The two main parts of bagasse
are fibre bundles and pith. The last one is composed by structural elements similar to
vessels, parenchyma and epithelial cells. Sugarcane is a raw-material that has a great
5
ethanol is initiated by hydrolysis of the cellulose forming glucose.11 Several
methodologies, including fluorescence based methods, may be used in characterization
of compounds in plant cell walls.12-15 Optical microscopy represents an important
technique to identify and localize the presence of lignocellulosic compounds, besides, it
has the advantage of being a non-invasive and non-destructive method. In this scenario,
two-photon microscopy has been used successfully to study lignocellulosic materials,
because of its high spatial resolution and improved signal collection efficiency that
gives images with higher contrast and better quality. Due to its larger penetration depth,
it is possible to obtain images from thick sections. Images can be recorded several times
deeper than by single-photon microscopy. Fluorophore compounds that are active at
single-photon excitation can often be excited by two photons of twice the wavelength
(2). However, one must recognize that single-photon and two-photon excitation show
different quantum-mechanical processes and have very different selection rules.16-20
Plant tissues are complex biomaterials with intrinsic fluorescence properties. The
distribution of lignin in cellulosic matrices is an important parameter to evaluate the
quality of cellulosic material for ethanol production. Safranine has been used as a probe
in studies of plant tissues and cellulosic fibres13; 21-23 because of the preferential
interaction of the dye with the region containing lignin. Fluorescence lifetime
microscopy (FLIM) is a technique that has been used by some authors to identify and
quantify lignin in sugarcane bagasse. 15 In the investigation of the autofluorescence
from plant biomaterials, some authors have attributed the observed emission to the
presence of lignin fractions and aromatic compounds as lignans, flavonoids and
tannins.24-26 On the other hand, the autofluorescence has also been ascribed to the
presence of flavins and flavoproteins.27 Until the present time, there is still no consensus
6
should eliminate almost all primary compounds responsible by the natural emission of
lignocellulose materials.
Different studies have shown the capacity of fluorescence microscopy techniques to
reveal information about the spatial distribution and concentrations of components in
lignocellulosic matrices.28-30 Confocal and wide field fluorescence microscopy in
combination with spectroscopy techniques are useful tools in the study of structure and
composition of plant materials.
The hydrolysis of micro cellulose that uses concentrated inorganic acids as sulphuric
and hydrochloric is a well-established methodology used to convert cellulose into
sugars and to generate nanocrystalline cellulose. The structural properties combined
with chemical and physical composition represent the most important features of fibres
in application as, for example, reinforcement additives to the production of polymeric
composites.1; 31 The use of nanocrystalline cellulose to reinforce composites require
strong adherence between the fibre and the polymeric solution. Moreover, it is
necessary a high degree of dispersion of fibre into that material.32 The structure of the
fibre may be modified by different treatments, depending on the required aim and
application. Samir et al showed that the presence of nanocrystalline cellulose in
polymeric composites inducts the phenomenon of percolation, which contributes to the
improvement of thermal, mechanical, and barrier properties.33-35 One of the major
difficulties related to the use of nanocrystalline cellulose in composites is associated to
its dispersion into the polymeric solution without degradation or formation of
self-aggregated phases. To overcome such obstacles, several studies have been developed
aiming at the increase of compatibility between the polymeric matrix with the
7
2 EXPERIMENTAL
2.1 Preparation of sugarcane bagasse samples
The process of preparation of different sugarcane bagasse samples were performed by
Karen Marabezi from the laboratory of Organic Physical-Chemistry (University of São
Paulo – São Carlos/SP), coordinated by the Professor Antonio Aprigio da Silva
Curvelo. All the samples were washed with water aiming to eliminate interstitial
impurities. The process of separation of bagasse fractions were carried out by the use of
sieves with diameter mesh of 1θ‒θ0. The remain compounds were removed by
extraction using the solvent mixture cyclohexane/ethanol (1:1, v/v) and water.
The methodology of removal of lignin was performed according to known
delignification oxidative process.39 Before the process, the sugarcane sample was
separated into three groups: integral bagasse, fiber and pith. The crystallinity of
sugarcane bagasse was determined by X-ray diffraction and showed the value of 0.55
g/g.
2.2 Labelling of sugarcane bagasse by safranine
The samples of integral bagasse and bleaching integral bagasse (5g) were labelled by
the use of aqueous solution of safranine (3.10-5 mol.L-1). The bagasse remained immerse
in solution under stirring for 5 minutes. Afterwards the sample was washed 3 times for
8
2.3 Techniques
2.3.1 Scanning electron microscopy
The samples were deposited in specific aluminium supports. The measurements were
performed in the Instrumental Analysis Centre of the Institute of Chemistry of São
Carlos (CAQUI/IQSC/USP) using a Zeiss Leo 440 scanning microscopy with Oxford
detector, operating with an electron beam of 20 kV. The sample were covered by 10 nm
of gold in a metallizer device BAL‒TEC (model MED 020) and kept in desiccator.
2.3.2 Fluorescence confocal microscopy
All the samples used were suspended in water and spin-coated (~3000 rpm, 30 s) on
cover glasses (0.13 mm, 22 x 22 mm, VWR International). The cover glasses were
cleaned by rinsing Milli-Q water, drying with argon gas and overnighting in a muffle at
450 °C.
The confocal microscopy setup was “lab built” in Molecular Fluorescence Laboratory at
IQSC - USP, containing an inverted microscope IX71‒Olympus, with a nanometric
scanning controlled by piezoelectric device (E-710.3CD – PI). The system was used to
achieve data related to confocal fluorescence images, steady-state emission and
fluorescence decays.
The confocal microscopy and steady-state emission measurements of sugarcane bagasse
and Avicel® samples were performed by using a CW laser excitation at 405 nm using a
Cube Coherent diode laser operating with adjustable output power from 1 40 mW.
The measurements of safranine labelled lignocellulosic material were carried out by
excitation with a Verdi-Coherent laser at 532 nm, operating at low intensity (20 mW).
9
plates of zero order (Del Mar Photonics). Two Olympus objectives lenses were used,
40X, NA = 0.75 model UPLFLN 40XPH and 60X, NA = 1.35 model UPLSAPO 60XO.
The detection system used a photon counting detector APD type, Perkin Elmer, model
SPCM-AQRH.
Confocal images were obtained due to the controlling and synchronizing of the
piezoelectric scanning system and two plates of National Instruments (PCI-GPIB
NI-488.2 e PCI-6601) applied to acquisition of TTL signal. Communication and interfacing
of the instruments were achieved by two programs developed in our laboratory, written
in LabView 8.5, and in the Laboratory for Photochemistry and Spectroscopy from KU
Leuven, written in C#.
Steady-state emission fluorescence spectra were obtained by the spectrometer Maya
2000 Pro ‒ (Ocean Optics), fibre optical attached to IX71 microscope through a side
10
Figure 3. Confocal microscopy setup. Top picture: Microscope IX71 containing two APD detectors, piezoelectric PI controller. Bottom picture: Maya 2000 Pro spectrometer attached to the microscope (IQSC – USP).40
A pulsed laser beam (TiμSafira Mira λ00 ‒ Coherent) at 400 nm with pulse width of
150 fs and frequency of 76 MHz was applied to perform fluorescence decay
measurements. Pulse picker (Conoptics) kept excitation pulse frequencies in 4 MHz.
Photodiode model TDA 200- PicoQuant with Becker & Hickl 140 was used to counting
and synchronizing of photons. Figure 4 shows the schematic setup related to decay
11
Figure 4. Confocal optical schematic setup. APD: avalanche photodiode; BS: beam splitter; CU: control unit; DF: dichroic filter; EXP: expander beam; IR: iris; L: lense; LPF low-pass filter; M: mirror; MM: mobile mirror; NF: notch filter; NLC: non-linear crystal; OB: objective; OF: optical fibre; PBS: prism beam splitter; PA: piezoelectric; PH: pinhole; PP: pulse picker; S: sample; SD: silicon detector; W: wave plate. (IQSC – USP).41
2.3.3 Wide field microscopy
The fluorescence wide field images were obtained by using an inverted IX71 Olympus
microscope and an objective model UPlanFLN Olympus, with magnification of 100X
12 ‒ Photometrics, coupled to a side output of microscope. The laser sources were Verdi at
532 nm and Cobolt Blues at 473 nm with average power of 50 mW. The schematic
setup is illustrated in Figure 5.
13
3 RESULTS AND DISCUSSION
3.1 Characterization of sugarcane bagasse by autofluorescence
microscopy
SEM analysis of sugarcane bagasse samples (whole bagasse, fibre and pith), and the
corresponding bleached samples (bleached whole bagasse (BWB), bleached fibre (BF)
and bleached pith (BP)) were used to determine the effect of chemical bleaching. These
regions were analysed because they present unique characteristics with respect to their
recalcitrance and morphology. Integral bagasse basically consists of fibre and pith. The
fibre surface is formed by parallel stripes and has a high length/diameter ratio. In
contrast, pith has a fragile and fragmented structure associated to parenchyma cells
designed to store sucrose. These features are very important to the understanding of
hydrolysis and bleaching processes. In Figure 6 SEM micrographs of unbleached and
bleached samples are compared. Unbleached samples (Fig. 6 a, b, c) present a rigid and
compact morphology. After chemical bleaching, fibre and pith exhibited disorganized
morphology. The roughness and some micro sized splinters were observed on the
surfaces (Fig. 6 d, e, f). Therefore, after bleaching, samples showed most exposed
structure, which allows more accessibility hydrolysis reaction of lignocellulosic
14
Figure 6. SEM images of bagasse samples: a whole bagasse, b fibre, c pith, d BWB, e BF and f BP. Micro sized splinters are indicated by arrows in samples after bleaching process.43
Autofluorescence images of bleached and unbleached sugarcane bagasse samples were
performed to improve the understanding of morphological microenvironment in
cellulose matrix and to evaluate distribution of lignin fraction before and after the
treatment. Confocal fluorescence images, obtained by single-photon excitation at 405
nm, of whole bagasse, pith and fibre samples, and the corresponding bleached ones
BWB, BF and BP, are compared in Figure 7. The material absorbs light in a wide
spectral range, from the near ultraviolet to the visible, due to their complexity and micro
environmental diversity. However, the samples showed higher emission intensity when
excited at 405 nm region. All samples exhibited quite strong autofluorescence without
fine structure. In other words, it is not possible to show the individual dots related to the
15
longitudinal organization of fibres do not appear in any region observed in both natural
and bleached samples. Autofluorescence arises from compounds dispersed in the plant
cell walls44 mostly from the lignin fraction. Features related to structure and thickness
affect resolution and contrast of fluorescence images. In addition, the excitation light at
UV–Vis region cause light scattering in the samples, and conventional confocal
microscopy study of plant tissues may be limited by the opacity of the medium. 45; 46
This problem can be overcome by using two-photon microscopy, because scattering and
absorption are substantially reduced in the near-infrared range compared to the visible
range.18; 47
16
Images of sugarcane cellulose materials measured by two-photon microscopy are
illustrated in Figure 8. The images show greater structural details compared to images
obtained using confocal microscopy via single-photon excitation. In addition, images
generated from two-photon excitation contained some microstructure information and
more detailed fluorescence mapping than single-photon excitation images. Two-photon
microscopy offers supplementary characterization of lignocellulosic materials,45; 48
because transitions between states of the same parity are forbidden for single-photon
excitation, but they are allowed for the two-photon excitation.16 The fluorescence
images in Figure 8 show sequences of small fluorescent spots that form well oriented
straight row tracks, which are related to lignin fraction, especially from unbleached
whole bagasse and fibre samples. The spots indicated were used to accumulate the
fluorescence decay of each sample. The average distance between two oriented
fluorescence tracks is about 12 m, which is comparable with the distance between cell
walls determined by SEM (see Figure 6b). Fluorescence spots in pith samples show a
decrease in intensity and disordered structure, it does not generate straight tracks format.
Bleached samples do not contain emission tracks; instead, some blurry emission spots
are evident. This result is consistent with disorder increasing in the samples after
17
Figure 8. Fluorescence intensity image and decay traces of indicated emission spots obtained by two-photon excitation at 800 nm of a) whole bagasse, b) fibre, c) pith, and corresponding bleached samples, d) BWB, e) BF and f) BP. Scale bar 10 nm.43
Scanning the z-position of the focal plane using two-photon fluorescence microscopy
allowed us to visualize the architecture, fibril patterns, and other details of the
microstructure of cellulosic materials. 2D images at various depths of z-axis from 0 to
18
thoroughly dependent of z-position. Each micrometre change in depth of the focal plane
leads to loss of orientation. This effect may be related to the SEM images of the bagasse
sample in Figure 6a, where oriented walls of the fibre are located near its surface.
19
Lifetime measurements in combination with microscopy techniques can be used to
study biological materials.49; 50 Samples were investigated by fluorescence decay
measurements aiming at the investigation of lignin-rich regions. Fluorescence decay
traces were recorded at wavelength of 500 nm, as well as at 575 nm for samples labelled
with safranine, which corresponds to emission maximum of the dye. Decay analyses
were performed by FAST software (Edinburgh Instruments), fitted by multiexponential
function without deconvolution. The fitting range was chosen by considering the decay
part of the time dependent data according to optimal parameters. Typical decay profiles
of untreated and bleached samples are illustrated in Figure 8. The fluorescence
relaxation was fitted with a biexponential decay function. The decay components,
normalized amplitudes and average values are presented in Table 1. A fast decay
component occurs in the range of 0.4–1.4 ns, and a long-lived component takes more
than 2.0 ns to decay. Such biexponential decay behaviour with a short decay component
20
Table 1. Decay times (i) and normalized amplitudes (ai) of micrometre-sized emission
spots from cellulose samples isolated from sugarcane bagasse obtained by
multiexponential fitting.43
Complex matrices such as sugarcane bagasse contain multiple intrinsic fluorophores,
which may be aromatic compounds with phenolic and acid groups from the lignin
fraction (cinnamic residues), and traces of endogenous biomolecules such as enzymes
and cofactors, chlorophyll, xanthophylls, coumarin and flavonoid derivatives.26; 52; 53;
54
Hafren and Oosterveld-Hut 55 studied wood fibers using fluorescence lifetime
imaging. Biexponential fitting at two emission regions of 436 and 480 nm resulted in
wavelength-independent decay times of about 0.7 and 4.3 ns. These values are within
the range of decay times observed for our samples.
Analysis of decay parameters in this system is a difficult task because of its complexity.
Nevertheless, some important issues were identified. In general, the fluorescence decay
of untreated and bleached samples are biexponential and occurs in time intervals longer
than 20 ns, as illustrated in Figure 8. The calculated average decay time increases by
about 68% from fibre to BF, 47% from whole bagasse to BWB, and 41% from pith to
21
Samples stained with safranine show slightly different decay behaviour, as illustrated in
Figure 10. First, unbleached samples like whole bagasse show a third decay component
with a lifetime of 4.8 ns. This component is ascribed to the decay of the singlet-excited
state of safranine formed mainly through energy transfer from the natural compounds to
the added dye. In addition, the fluorescence lifetime of safranine in other solvents was
also measured. In a polyvinylpyrrolidone film, a single component with a lifetime of
about 4 ns was recorded, while the fluorescence lifetime of safranine in propanol was 3
ns. Therefore, the observed increase of safranine fluorescence lifetime in bagasse
samples is a result of absorption of the dye in lignin-rich regions. The second difference
is the moderate quenching of the second decay component of the whole bagasse sample,
which is reduced from 1.9 to 1.3 ns. This result is consistent to fluorescence quenching
of excited chromophores of the lignin fraction by energy transfer to the adsorbed
safranine. Fluorescence behaviour is thoroughly linked to the chemical environment of
the cellulosic matrix.56 Chemical bleaching of lignin fraction causes decomposition and
dispersion of the components generated. The bleaching reaction also decreases the
amount of organic materials and intrinsic fluorophores in the sample. Therefore,
bleaching reduces energy migration and fluorescence self-quenching in the samples.
Self-quenching is mainly observed when the lignin matrix is intact and its intrinsic
fluorophores are closely confined. The emission intensity of the bleached samples is
still strong because most of the remaining chromophores are partially isolated or
dispersed in the cellulosic matrix, reducing excited state deactivation by self-quenching.
These results are in agreement with those obtained by using fluorescence lifetime
imaging (FLIM) to map the distribution of lignin in sugarcane bagasse.15 They also
22
with the slow decay time. The faster decay is associated to dense lignin regions and
becomes slower after samples undergo pre-treatment to remove lignin.
Figure 10. Fluorescence intensity images and decay of each indicated emission spot obtained by two-photon excitation at 800 nm of samples stained with safranine: a) whole bagasse and b) BWB. Scale bar 10 nm. The lateral colour scale bars are related to the fluorescence intensity.43
Emission spectra of the fibre samples were also measured under the same conditions
and the results are exhibited in Figure 11. Untreated fibre presented high intensity
emission with a maximum at about 500 nm, consistent with the emission spectra
23
emission was quenched and a new band appeared at about 575 nm corresponding to the
fluorescence of the added dye. Safranine has negligible absorption at the excitation
wavelength of 405 nm, so dye emission may occurs after energy transfer from the
intrinsic fluorophores to safranine. The BF sample exhibited a similar emission profile
to that of the untreated fibre, but its intensity was reduced by half. The reduction in
intensity confirms that chemical bleaching removed the lignin fraction, so
autofluorescence from the sample decreased. However, the intensity is much higher
than would be expected from a sample containing a lignin fraction of about 1% after
chemical bleaching. This means that there are still intrinsic fluorophores remained in
some regions of the sample, and these fluorophores showed higher emission efficiency
than in the unbleached sample, because of the matrix dispersion and the lower
self-quenching process. Chemical treatment cleaves the lignin macrostructure into smaller
components, which then disperse all over the solid matrix, reducing the self-quenching.
For the BF sample stained with safranine, the dye emission still appears, but at lower
intensity, which agrees with energy transfer occurring from the fluorophores remaining
in the sample to the added safranine dye. The reference Avicel sample exhibited very
24
25
4 CONCLUSIONS
It was used single and two-photon fluorescence microscopy to characterize the
autofluorescence from micro-regions of sugarcane bagasse samples. Fluorescence
images show that fibril packages of bagasse samples partially lose their longitudinal
orientation after chemical bleaching. Extraction of lignin allows the dispersion of the
remaining natural fluorophores in the sample, which reduces self-quenching process.
The presence of high intensity spots after chemical bleaching indicates that fluorescent
lignin derivatives remain in some regions of the lignocellulosic matrix. Our results were
able to provide information related to the morphological properties and lignin
distribution in sugarcane bagasse samples. In addition, it is possible to understand how
the bleaching process affects these parameters. Therefore, this study provides support
for future site-specific morphological analyses of the effects of different pre-treatments
usage on cellulose hydrolysis, which is an important issue in second-generation
26
CHAPTER 2
PRODUCTION AND OPTICAL
27
ABSTRACT
Nanocrystalline cellulose (NCC) is a rigid rod-shaped fibre with one to one hundred
nanometres in diameter and tens to hundreds of nanometres in length, always with a
large length / diameter ratio. Due to its properties, NCC can be used for different
applications such as in regenerative medicine, in optical materials, and in composites
used in automotive industry. The characterization of NCC has been performed by XRD,
IR spectroscopy and TEM. However, a thorough understanding about its morphology
and composition is still being uncovered. Different techniques of fluorescence
microscopy in combination with steady-state and time-resolved fluorescence
spectroscopy represent potential tools to study NCC. In this chapter, the whole
procedure of NCC obtaining via an adapted acid hydrolysis of Avicel® is described.
Afterwards the material was characterized by classic electron microscopy SEM and
TEM, confirming the rod-shaped morphology and the nano-sized structure. Wide field
microscopy was applied as fluorescence microscopy tool to characterize the NCC when
dispersed in two distinct polymeric solutions of PVA and PVP. Because of the
hydrophilicity of NCC, the wide field images showed the well-dispersed NCC in the
solution of PVA/water, while the solution of PVP/isopropanol showed the formation of
NCC self-aggregates into the polymeric matrix. The last step of this chapter describes
the characterization of NCC structures by using the super-resolution fluorescence
microscopy STED (Stimulated Emission Depletion). The images obtained by STED
showed NCC morphology with resolution down to 50 nm, allowing the comparison
28
1 INTRODUCTION
Nanocrystalline cellulose (NCC) is cellulosic materials with dimension in nanometre
range. Those materials show distinct behaviour and different physicochemical
properties when compared to larger cellulosic fibres. NCC may be obtained from two
different types of sources. Plant materials are the most common ones used in the NCC
obtaining. There are other cellulosic sources from which NCC has been isolated,
including tunicates, bacteria and algae.58
NCC is described as a rigid rod-like particle with widths and lengths of 5 70 nm and
100 2000 nm respectively. The particles are highly crystalline, with crystalline index
between 54 and 88%.59 The variety of thickness, lengths, morphologies and degree of
crystallinity depends on the source of cellulosic material and conditions under which
production is carried out as well as on the experimental technique used.34 NCC isolated
from tunicate has been reported to have dimension of 8 – 20 nm in thickness and
lengths about 1m.60-62 There are some reports related to NCC obtaining via sulfuric
acid from cotton-Avicel® with thickness about 10 – 100 nm and lengths from 1 m to 2
m.63-65
The Figure 12 shows how cellulose may be found in nature, and gives details of the
29
Figure 12. From the cellulose sources to the cellulose molecules: Details of the
cellulosic fiber structure with emphasis on the cellulose micro fibrils.66
The hydrolysis process occurs preferentially in amorphous domains, whereas crystalline
regions are more resistant to acidic attack. Typical procedures for the production of
NCC involve the following steps:
1. Strong acidic hydrolysis of cellulosic material under controlled conditions of
temperature, time, stirring, concentration, and the acid/cellulose ratio;
2. Dilution with cold water to stop the reaction and repeated washing with
successive centrifugation process;
3. Extensive dialysis against distilled water to fully remove free acid molecules;
30
Several studies have been performed over the last decades, and they are related to the
application of NCC as filler in nanocomposites for improving mechanical and barrier
properties.7; 34; 67-75 In the last years, attention has been devoted to studies involving the
application of NCC in different materials, such as foams, aerogels,70 building block for
selective membranes,76 adhesive materials,70, 77 lithium battery, and in mechanical
reinforcement agent for low thickness polymer electrolytes. The intermolecular
hydrogen bonds of the cellulose molecules result in strong interactions between the
fillers and the polymeric matrix, showing better composite properties compared to the
pure polymer matrix. Another important effect of NCC is the high flexibility of the
cellulose polymer that provides an entanglement effect with the polymer matrix that
contributes to improve mechanical and thermal properties.78-81
Different techniques have been employed to perform the characterization of
nanocrystalline materials. The crystallinity index, in general, is determined by X–ray
diffraction (XRD) technique.82; 83 The chemical composition may be determined by
Raman and infrared spectroscopy.14; 70 Aspects related to the morphology are generally
investigated by microscopy techniques, such as, transmission electron microscopy
(TEM), scanning electron microscopy (SEM), and atomic force microscopy (AFM).84- 87
Light microscopy has been a useful technique in investigation of different
lignocellulosic materials, 15; 88; 89 and possesses the advantage of being non-invasive and
non-destructive method. In that context, NCC could be characterized by light
microscopy technique, such as, confocal and wide field microscopy (WFM), providing
morphologic information that is not available by other techniques.
Advances in optical microscopy have been established in the last decade, generating a
great impact in areas of chemistry and biology.90; 91 Recent progresses in optics allowed
31
microscopy techniques as, for example, the STED method.92-94 Methods with
super-resolution assure high space sensitivity, allowing the investigation of unknown details
in natural and artificial systems, up to the single molecule level.95; 96
The NCC has great potential generating highly functionalised nanomaterials to different
areas, such as, intelligent recovering, pharmaceutical applications, nanocomposites and
electronic materials. The effectiveness of the use of nanocrystalline cellulose is related
to the structural knowledge of the system. From this point of view, the application of
super-resolution technique STED represents a very useful tool to investigate NCC
32
2 EXPERIMENTAL
2.1 Production of nanocrystalline cellulose by acid hydrolysis
The commercial microcellulose Avicel® was purchased from Sigma-Aldrich. The
methodology used to obtain nanocrystalline cellulose was adapted from Mandal and
Debabrata.86 The hydrolysis of Avicel® was carried out by the use of sulphuric acid.
For each 1g of Avicel® was used 6 mL of sulphuric acid 54% (v/v). The hydrolysis was
performed under stirring during 60 minutes at 50 ºC. At the end of the reaction, the
mixture showed a lightly brownish colour. Subsequently, the suspension was cooled
down by the addition of cold distilled water. Afterwards, the washing process with
Milli-Q water and centrifugation at 14,000 rpm was performed several times until the
supernatant shows pH around 7. Then, the suspension was filtered using a membrane
with the diameter mesh at 200 nm.
2.2 Preparation of nanocrystalline/polymer composites
Solutions of polyvinyl alcohol (PVA, MW) and polyvinylpyrrolidone
(PVP, MW~55,000) were prepared by their dissolution in water and isopropanol (2%
w/w). The polymeric solution was kept under stirring during 20 minutes at 40 ºC.
Hereafter, the NCC suspension was added to the polymeric matrix (10% w/w) and kept
under stirring during 30 minutes. Finally, the samples were deposited on cover slides
and stored in a desiccator.
2.3 Techniques
2.3.1 X-ray diffraction
The diffractograms were obtained from diffractometer Rigaku, operating at 50 kV and
33
room temperature (25 ºC) and at angle 2 from η to 40º (2º.min-1). The crystallinity
index was calculated from the diffractogram peaks, taking into account the Gaussian
distribution function related to the amorphous and crystalline areas 97. The equation 1
was applied to obtain the crystallinity index:
� % = ( −�� ) ��
Equation 1
Where Aa is the corresponding area under the amorphous curve and At is the total area
of all peaks, including the amorphous curve.
2.3.2 Transmission electron microscopy
NCC was measured in a Tecnai™ G2 F20 microscope, operating in STEM mode, in
bright field and dark field. Before measuring, the samples were sonicated for 10 minutes
and the suspension was dropped on a grid and stored in a desiccator for 24 h.
2.3.3 Scanning electron microscopy
The methodology used to obtain scanning electron microscopy images of NCC was
previously described in section 2.3.1 of Chapter 1.
2.3.4 Confocal fluorescence microscopy
The confocal microscopy and steady-state emission measurements of NCC were
implemented by using a Cube Coherent diode laser line at 405 nm operating with
adjustable output power from 1 to 40 mW. Details of methodology and instrumentation
34
2.3.5 Wide field microscopy
The wide field fluorescence images were obtained by using an inverted IX71
microscope and an objective model UPlanFLN Olympus, with magnifying of 100X and
numerical aperture of 1.3 in oil. The laser Cobolt Blue operating at 473 nm with average
power of 50 mW was used as the light source. Details of methodology and
instrumentation were described in section 2.3.3 of Chapter 1.
2.3.6 Super-resolution microscopy by stimulated emission depletion
(STED)
The samples used in STED microscopy were prepared in aqueous solution and labelled
by the dye ATTO-647N-COOH (ATTO-TEC) at concentration of 1.10-5 mol.L-1, under
stirring for 24 h. Subsequently, they were washed 5 times for 10 minutes with distilled
water at the temperature of 40 ºC and finally spin-coated (1500 rpm, 90 s) onto the
surface of cover slide of 22 x 22 mm.
STED super-resolution images were obtained in an inverted IX71‒Olympus
microscope, using a piezoelectric controller, E‒710.3CD‒PI, to perform the nanometric
scanning. A mode-locked Picoquant laser operating at 635 nm and 80 MHz of pulsed
frequency was used for sample excitation while depletion was provided by a laser line at
750 nm. The excitation and depletion beams were collimated by dichroic mirror before
focused by an immersed oil 100x objective of numerical aperture of 1.3 (UPLSAPO
100XO/PSF, Olympus). The fluorescence emission signal from the sample was
collected by the objective and separated from the laser line by using dichroic lenses
(FF01 -740- DI01 and FF662-FDi01, Semrock). Communication and interfacing
between the instruments were made by a software programming in C# developed in the
35
3 RESULTS AND DISCUSSION
3.1 Characterization of Avicel® NCC by electron microscopy and
X-ray diffraction
Samples of NCC were obtained from micro-particles of cellulose Avicel®. The
hydrolysis of cellulose under controlled conditions generates nanocrystals, which are
composed of well-defined fibrils of cellulose chains, showing a hard linear arrangement.
Figure 13 shows scanning electron microscopy images of microcrystalline cellulose
Avicel®, which are small particles aggregated with irregular shape.
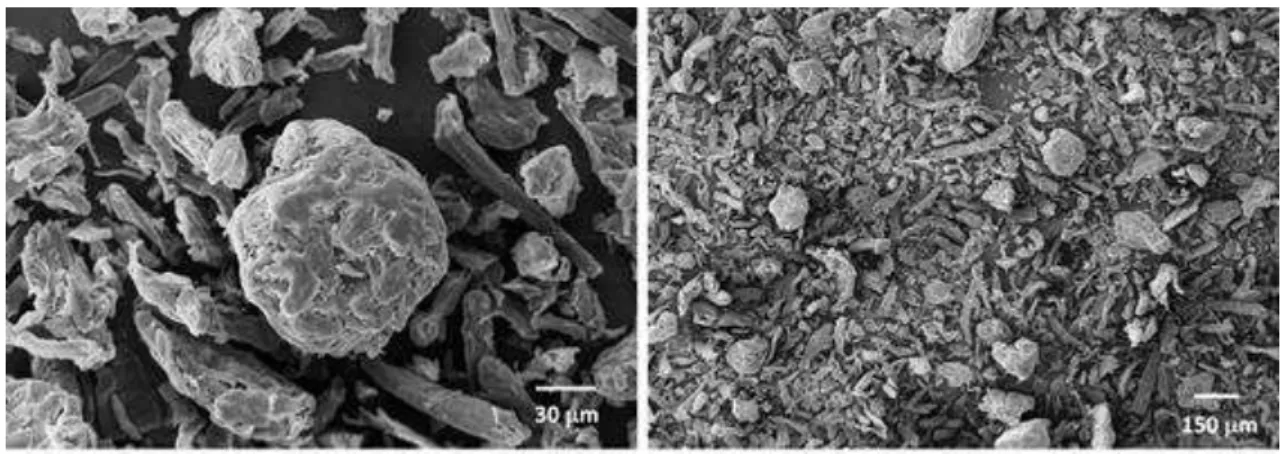
Figure 13. SEM images of Avicel® samples. Morphologic details of microcellulose
particles.
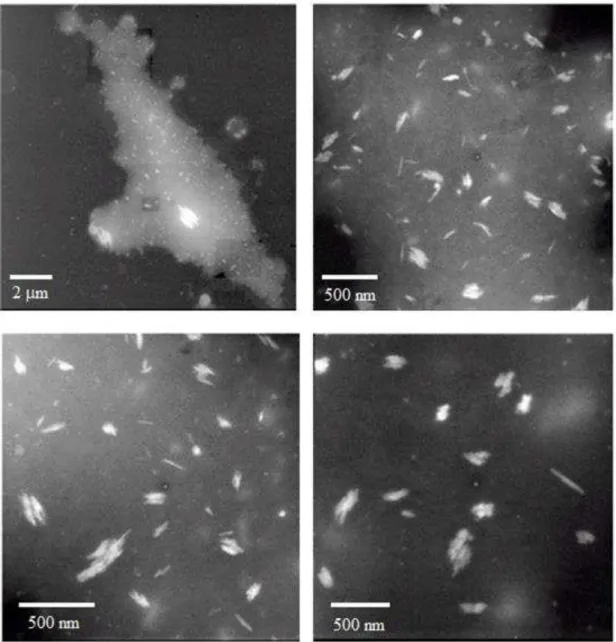
Figure 14 shows the transmission electron microscopy of NCC obtained by sulfuric acid
hydrolysis. The morphology of the particles is nearly flat and their average length is in
between 100 – 200 nm, while the distribution of their diameter is from 10 – 40 nm. This
special shape of NCC is due to the action of sulfuric acid in amorphous areas of the
36
Figure 14. TEM images of nanocrystalline cellulose, obtained from sulphuric acid hydrolysis.
The properties related to morphology and structure of NCC may be determined by its
origin and extraction conditions.60 Crystals of cellulose are generated from the synthesis
of different biomass species. The origin of the structure of cellulose nanocrystals is
associated to the formation of micro fibrils, during the deposit in layers on the cellular
37
the specific cellular wall. Therefore, after the acidic hydrolysis process, it is possible to
obtain NCC with a range of particle sizes.
Figure 15 shows the X-ray diffractogram of Avicel® and NCC. Both of them have three
peaks related to the cellulose at 2 – 14.7º; 16.4º e 22.6º. 98 The peak at 22.6° is sharper
after the hydrolysis process, representing a well-defined structure of the crystalline
lattice at plane (2 0 0). The determination of the index of crystallinity was obtained by
the method reported by Segal et al, 99 using the intensity of the crystalline and
amorphous values as comparison parameter. The crystallinity index for Avicel® and
NCC were 57% and 70%, respectively. The increase of the crystallinity index after the
hydrolysis is attributed to the removal of amorphous regions of the cellulosic matrix.
38
3.2 Characterization of Avicel® NCC by wide field microscopy
Images of autofluorescence of Avicel® and NCC are shown in Figure 16. Cellulosic
materials have a broad absorption spectral region, even after delignification process. In
Figure 16 (a and b) it is shown the morphologic characteristics of Avicel®, exhibiting
irregular rod-shaped particles with diameter ranging from 30 m to 60 m. This result
may be compared with particles illustrated in Figure 13 (SEM images). The images in
Figure 16 (c and d) are related to samples of NCC. After the hydrolysis, a significant
decrease of length and diameter of the nanoparticles occurs. The recorded images of
NCC by wide field microscopy (vide infra) were limited due to the high scattering and
39
Figure 16. WFM images of Avicel® (a and b) and NCC (c and d).
3.3 Characterization of Avicel® NCC by steady-state and
time-resolved fluorescence spectroscopy
Emission spectra of Avicel® and NCC showed in Figure 17 were obtained via
measurements using the same confocal microscopy setup, and the source of light used
was a laser with wavelength at 405 nm. The Avicel® fluorescence spectrum shows a
maximum emission band at 540 nm. Whereas the emission band of NCC occurs in a
40
determination of the emission maximum). Nevertheless, an emission blue shift after
hydrolysis process is achieved.
Figure 17. Fluorescence spectra of a) Avicel® and b) NCC obtained by excitation at
405 nm.
Fluorescence decay traces measurements were obtained via 2-photon excitation, using a
pulsed laser at 800 nm. Decay analyses were performed by FAST software (Edinburgh
Instruments), fitted with multiexponential function without deconvolution. The decays
41
Figure 18. Fluorescence decays of a) Avicel® and b) NCC obtained by two-photon excitation at 800 nm.
A biexponential function was applied to fit the fluorescence decay of Avicel®, while
the decays of NCC were only fitted with three exponential components. The decay
times obtained are shown in Table 2. For Avicel®, the values were 1.74 e 5.5 ns. For
NCC, the decay times recovered were 0.46; 1.32 and 4.35 ns.
After sulfuric acid hydrolysis of Avicel® to obtain NCC fibres the two longer
fluorescence decay times decreased and a third and faster component appeared. These
features may be related to the polysaccharide depolymerization forming reactive