Development of a decision support tool for lots scheduling in
semiconductor manufacturing at Qimonda Portugal
Ariana Ferreira Pinto Araújo Campos
Relatório do Projecto Curricular do MIEIG 2008/2009 Orientadora na FEUP: Prof. Ana Camanho
Orientadores na Qimonda Portugal:
Engenheiro Fernando Freitas e Engenheira Joana Pereira
Faculdade de Engenharia da U ni ve rs idade do Porto Mestrado Integrado em Engenharia Industrial e Gestão
Desenvolvimento de uma ferramenta de apoio à decisão para o
escalonamento de lotes no fabrico de semicondutores na Qimonda
Portugal
Resumo
Este projecto insere-se no âmbito do estágio curricular do Mestrado Integrado em Engenharia Industrial e Gestão (MIEIG), na empresa Qimonda Portugal. De acordo com a actual forma de planeamento os pedidos são feitos pela sede, em Munique, com duas semanas de antecedência. Aqui, se não existirem restrições ao nível da capacidade e materiais, o volume prometido é igual ao pedido. No entanto, até terça-feira da semana da entrega e tendo em conta o inventário nas várias áreas produtivas, podem ser feitas alterações da promessa inicial ou Change of Promises (COPs). Assim, se por diversos motivos o volume planeado não puder ser cumprido, este pode ser diminuido ou adiado para a semana seguinte.
A existência de diferenças significativas, entre as quantidades prometidas inicialmente pelo departamento de Planeamento e Logística (PL) e as que realmente são entregues, devem-se ao facto de o cumprimento das encomendas estar directamente relacionado com um dos principais indicadores de desempenho da fábrica, o Confirmed Line Item Performance (CLIP). Este indicador mede a quantidade prometida face à quantidade entregue. Para garantir que, no mínimo, é atingido o objectivo semanal definido para este indicador (95%), são acordados novos volumes e é face a estes últimos valores que o CLIP é medido.
O objectivo principal deste projecto era conseguir aproximar a quantidade inicialmente prometidas e a efectivamente entregue, mantendo níveis de CLIP elevados e minimizando as COPs. Para tal foram identificados os principais motivos que levavam ao afastamento entre essas duas quantidades. Assim concluiu-se que dois dos principais problemas eram a gestão incorrecta de prioridades e a falta de visibilidade dos pedidos por destino. Estes factores podem levar ao atraso no processamento dos lotes e ao seu não envio na semana devida e também à entrega de quantidades em excesso para um destino que depois irão fazer falta para satisfazer os pedidos dos outros destinos, ambos com maior ênfase na última área produtiva da fábrica, o Mark, Scan and Pack (MSP). Face à necessidade de corrigir estes problemas e também de assegurar a comunicação entre o PL e a linha de produção, decidiu-se que deveria ser implementada uma ferramenta de apoio à decisão (MSP Scheduler) que permitisse a definição de prioridades adequadas, bem como garantir que as quantidades entregues a cada destino são as correctas.
O principal resultado deste projecto consistiu no desenvolvimento de uma aplicação informática de apoio à decisão com o objectivo de dar resposta a alguns dos principais problemas que ocorrem na linha produtiva que podem levar ao não cumprimento das quantidades prometidas. A especificação de requisitos e caracterização da ferramenta proposta foi detalhada neste projecto. O maior contributo foi garantir que a quantidade planeada é cumprida o mais rigorosamente possível pela fábrica, mantendo um valor percentual do CLIP muito elevado. Deste modo o departamento de PL pode ter confiança na execução dos pedidos conforme o previsto, conseguindo satisfazer as encomendas com maior exactidão.
Abstract
This project is in the scope of the traineeship of the MIEIG, in the company Qimonda Portugal. According to the current way of planning requests are made by headquarters, in Munich, with two weeks in advance. Here, if there are no restrictions in terms of capacity and materials, the volume promised is equal to the requested. However, until Tuesday of the delivery week and taking into account the amount in the various productive areas, changes can be made of the initial promess or COPs. Thus, if for various reasons the volume planned can not be met, it can be reduced or postponed to the following week.
The existence of significant differences between the quantity originally promised by the PL department and those that are actually delivered, are due to the fact that the demands’ fulfillment is directly related to one of the key performance indicators for the plant, the CLIP. This indicator measures the quantity promised face to the quantity delivered. So, to ensure that, at least, it is achived the weekly target set for this indicator (95%), new volumes are agreed and is against these values that the CLIP is measured.
The main objective of this project was to bring together the quantity initially promised and the actually quantitiy deliveried, maintaining high levels of CLIP and minimizing the COPs. Therefore they were identified the main reasons that led to the difference between these two quantities. Thus it was conclued that the two main problems were the incorrect management of priorities and the lack of visibility of the demands by destination. These factors can lead to the delay in lots’ processing and not shippment in the correct week and also to the delivery of quantities in excess to a destination that then will lack to meet the requests from other destinations, both with greater emphasis on the last productive area of the plant, the MSP. Given the need to correct these problems and to ensure communication between the PL and the procution line, it was decided that should be implemented a tool for decision support (MSP Scheduler) that allowed the setting of right priorities and ensure that the quantities deliveried to each destination are correct.
The main result of the project was the development of a computer application to decision support with the aim of answering some of the major problems that occur in the production line that can lead to the failure of the quantities promised. The specification of requirements and characterization of the tool proposed was detailed in this project. The greatest contribution was to ensure that the quantity promised is met as strictly as possible by the plant, maintaining a percentual CLIP value very high. This way the PL department can have confidence in the execution of requests as planned, to meet the orders with greater accuracy.
Agradecimentos
Gostaria de agradecer esta oportunidade de estágio dada pela Qimonda Portugal e pela Faculdade de Engenharia da Universidade do Porto. Foi sem dúvida um grande contributo para a minha formação pessoal e profissional. Um especial agradecimento aos meus orientadores de estágio, a Prof. Ana Camanho e os Engºs Fernando Freitas e Joana Pereira por toda a disponibilidade demonstrada e apoio na realização deste trabalho. Gostaria também de agradecer a todos aqueles com quem trabalhei e que contribuíram para a minha formação e integração na empresa, não esquecendo os que participaram na realização do meu projecto. Um obrigada também aos meus colegas da faculdade, por toda a motivação e incentivo dados ao longo destes meses.
Table of contents
1 Introductionro ... 1
1.1 Scope and objectives of the project ... 1
1.2 Project phases ... 2
1.3 Structure of the report ... 3
2 Company Presentation ... 4
2.1 The group Qimonda and the seimiconductors market... 4
2.2 Production Structure ... 7
2.3 Management Board ... 8
2.4 Qimonda Portugal ... 8
2.4.1 Productive Areas ... 9
Wafer Test ... 10
Wafer Level Assembly... 11
Pre-Assembly ... 11
Components Assembly ... 12
Components Test ... 13
3 State of Art….. ... 15
4 Project scope: MSP Scheduler ... 17
4.1 Logistics of the MSP area ... ...17
4.2 Initial Problem ... ..19
4.3 MSP Scheduler Specification ... 22
4.3.1 MSP Scheduler logic ... 25
Productive Tab - Upper Part ... 25
Productive Tab - Lot Status ... 27
Special Tab ... 11
5 Conclusions and Future Work ... 34
References P ... 36
Appendix A: Balanced Scorecard ... 37
Appendix B: Operator Work Space ... 39
Appendix C: MSP Scheduler specification ... 41
Index of Figures
Figure 01 - Gant graphic ... 2
Figure 02 - DRAM market bit growth ... 5
Figure 03 - Qimonda's product portfolio ... 5
Figure 04 - Qimonda’s partners and partnerships in development and manufacturing ... 6
Figure 05 - Memories industry market share ... 6
Figure 06 - Operator with a wafer ... 7
Figure 07 - Qimonda’s plants worldwide ... 7
Figure 08 - Management board ... 8
Figure 09 - Qimonda Porto ... 8
Figure 10 - Backend operations... 10
Figure 11 - 10k suit ... 10
Figure 12 - Wafer map ... 11
Figure 13 - Wafer from the Pre-Assy ... 11
Figure 14 - BOC and TSOP products ... 12
Figure 15 - Substrates and leadframes ... 12
Figure 16 - Wire Bonding ... 13
Figure 17 - TSOP after modling ... 13
Figure 18 - Solder balls ... 13
Figure 19 - Burn-In oven ... 14
Figure 20 - Bathtub curve ... 14
Figure 21 - Test equipment ... 14
Figure 22 - Reel after final packaging ... 14
Figure 23 - Shipping area ... 14
Figure 24 - Process flow in the MSP area ... 17
Figure 25 - Marked chip ... 18
Figure 26 - Reel after packing ... 18
Figure 27 - Scheduler framework... 23
Figure 28 - MSP Scheduler interface ... 24
Figure 29 - Criteria for lot sorting ... 25
Figure 30 - Baunumber with receipt released / not released ... 26
Figure 32 - Fluxogram for lot selection ... 29
Figure 33 - Lot selection ... 29
Figure 34 - Example of case I... 30
Figure 35 - Example of case II ... 30
Figure 36 - Example of case III a) ... 31
Figure 37 - Example of case III b) ... 31
Figure 38 - Comparison between the current and the new situation ... 32
Figure 39 - Lot Split ... 32
Index of Tables Table 01 - Sort Table ... 20
Table 02 - Relations between CTPO, VKL and destinations ... 21
1 Introduction
1.1 Scope and objectives of the project
The current project was developed during the internship at Qimonda Portugal, within the scope of the last year of the Industrial Engineering and Management master at Faculdade de Engenharia da Universidade do Porto (FEUP). The internship lasted five months, from August 2008 to January 2009. It was oriented by Fernando Freitas and Joana Pereira both Qimonda’s engineers and by Ana Camanho, my supervisor from FEUP.
The main objectives of this internship were to understand and analyze the main problems that contribute to the differences between the quantities originally promised and the ones that are actually delivered and then finding a solution that would reduce these differences.
Requests are made by Munich with two weeks in advance. In case there aren’t any restrictions in terms of capacity and materials, the promised volume is equal to the request. In the following week planners begin to make the plan taking into account the requests that were made, the work-in-progress (wip) already in the production line, the yield of the products and the cycle time. Thus, the planned amount is superior to the requested, in order to absorb production process changes that could jeopardize the amount promised. However if, for various reasons, the expected volume can not be met, a new volume can be agreed until Tuesday of the delivery week. These Change Of Promises (COPs) exist so clients are aware of the most accurate value (at that time) of the quantity that will be delivered but mostly because of the Conformed Line Item Performance (CLIP), an indicator that measures the quantity promised (after the COPs) face to the quantity delivered for each product reference (baunumber). This key perfomarce indicator is part of Qimonda’s Balanced Score Card. The new promised quantity is usually slightly lower than the real quantity that is expected to be produced in order to assure high values of CLIP. In the end the client might receive a higher volume than expected. This is not very critic when the clients are Distribution Centers (DC’s - warehouses where the products are stored before going to the final client), but when the products are to be assembled on modules, delivering higher volumes can be a problem because the modules’ factory might not be able to assemble due to lack of materials or might stay with accumulated stock since it wasn’t expecting the delivered quantities.
The main reasons identified that lead to COPs were: decrease in yield and speed shares, lots on hold, delays in lots’ processing and the shippment of products to wrong destinations. Only on the last two it was feasible to act.
Fig. 1: Gant graphic
Delays in lots’ processing are due to the incorrect management of priorities in the productive line while the shippment of excess quantities to one destination and that might lack in other destinations is caused by the lack of visibility of the demands by destination.
The presentation of a solution to these problems was the main goal of the project and it was successfully achived trough the specification of a decision support tool (MSP Scheduler) for one of the most critical areas of Qimonda’s plant, the MSP. This tool will also ensure an effective communication between the Planning and Logistics (PL) department and the production line.
Nowadays everytime there is a problem the PL department calls the responsibles of the area, who contact the people in the productive line to give priority to a certain product or to warn them there is more than destination. However, the plant works 24 hours a day, 7 days a week while the PL department works from Mondays to Fridays, from 9a.m to 6p.m. In the period of time in which the planners are absent a larger quantity can be sent to one destination and then will lack in others destinations and wrong priorities can be given to the lots. It was necessary to assure that these situations wouldn’t continue to happen.
The specification of the MSP Scheduler was aligned with the people from the MSP area and their responsibles and approved by the IT department.
With the MSP Scheduler the planning of Qimonda can have more confidence that the delivered quantity is as close as possible to the initial quantity promised, reducing the COPs that are made to adjust these values and maintaining a very high CLIP value.
1.2 Project phases
The graphic below presents the scheduling of the project and a detailed view of all the tasks that were proposed at the beginning of the project,their starts time and durations.
In the first two weeks all new employees have to do Induction, which has the objective of introducing the company, rules and procedures. In the next weeks all productive areas were visited in order to get to know the productive processes.
This line training was an excellent way to initiate the project as it was possible to understand the complexity of the semiconductors’ manufacturing. In the following week a presentation of the productive areas was made. After the definition of the objectives of the project, planning train was done for about three weeks.
A Master Data training was also done with the introduction to two programs: Fab300 and Product Master Data (PMD), followed by line training in the Burn-in, Test and MSP areas. These steps were very important especially to the identification of the problems in the productive line. The definition of a decision support tool was aligned with the people from the MSP area, after several meetings. The main result of the project was the specification of the MSP Scheduler according to the defined requisites, what was completed successfully. The development of the internship report was made from September to January.
1.3 Structure of the report
In this first chapter are presented the scope and objectives of the project, its different phases and also an introduction to the company including information on the production of semiconductors at Qimonda.
In chapter two is described the state of art related to the development of decision support tools based on scientific articles. Then, in chapter three, is presented the initial problem that lead to the development of a new decision support tool for the MSP area and its specification. The obtained results as well as the conclusions and future work can be found in chapter four. In chapter five are present the references that supported the project. Finally in the appendixes, was included relevant information for the understanding of the project and also the specification developed for the MSP Scheduler tool.
2 Company presentation
2.1 The group Qimonda and the semiconductors market
In 1996, Siemens started the production of semiconductors. Resulting from a spin-off from its parent company, Infineon Technologies became an independent company in the memory business in 1999. This way Siemens could be dedicated to communications solutions (CM) and automotive, industrial and multimarket products (AIM). Qimonda was also a result of a spin-off but from Infineon Technologies to form a separate legal entity, in May 2006. Currently Infineon still holds a 77.5% stake of Qimonda.
Qimonda’s headquarters are in Munich (Germany). The company employs about 13.500 workers worldwide, almost 2500 in Research and Development (R&D).
In 2006, it was a leading global supplier and the number two player in the Dynamic Ram Access Memory (DRAM) market. However this is a very competitive industry and the demand has decreased considerably in recent years along side with price cuts imposed by east competitors has placed Qimonda in a very difficult position that lead to the recent insolvency announcement in January 2009.
Qimonda is a universal name that has different meanings and allows associations in different languages, reflecting the strong global footprint of this global company. The word “Qi”, of Chinese origin, stands for flowing or breathing energy while in English it can be related with “key”. On the other hand “monda” is easily associated with the Latin word “mundus” or in English, “world”. The combination of these two words is intuitively understood as “key to the world” or simply Qimonda. The name and brand identity of Qimonda express the philosophy and personality of the company, reflecting its core values: creative, passionate and fast. Qimonda strives for Operational Excellence and wants to be recognized as a Center of Know-how in Semiconductors Backend Technology. In order to satisfy its customers’ needs, it supplies high quality and reliable products and services, delivered on time and at competitive cost; it assures fast introduction and ramp-up of new products; it achieves continuous success through a highly competent and motivated workforce and is a creative R&D center of competence contributing to create future value through innovations.
For the current year Qimonda’s business priorities are: reduce cost, maximize volume and guarantee quality.
Fig. 3: Qimonda’s product portfolio Fig. 2: DRAM market bit growth 1
The market place is growing, as there are more and more different applications for DRAM memories. The semiconductors industry is continuously improving, making better and cheaper products. The influence of this rapid density growth is reflected on the capacity of the memory products.Figure 2 exemplifies the changes expected in the market of DRAM.
The memory market prices are governed by Moore’s Law, which predicts an average rate of 30% decrease in the price/bit per year. According to this law, the number of transistors that can be placed inexpensively on an integrated circuit increases exponentially, doubling approximately every two years. This leads to a constant cost reduction and an increase in performance.
Qimonda is1 a leading memory supplier with a broad diversified portfolio of competitive products in the DRAM industry. With a historical emphasis on computer and server products, the company is now focusing on graphics, mobile and consumer products using its power-saving technology. Qimonda’s products are used in a wide variety of applications, including notebooks, desktops, networking and storage equipment, graphic cards, game consoles, mobile phones, GPS, MP3, televisions, printers, cameras, DVD players and many other electronic devices (figure 3). With its portfolio Qimonda has established on the market as an innovative and dynamic company.
Qimonda supplies the world’s largest computer and electronics providers. Its main customers include major computing original equipment manufacturers such as Sony, HP, Toshiba, Dell, IBM and Sun Microsystems. As a result of the extended product portfolio, it has recently acquired customers from the graphics and game console market, among them NVIDIA, AMD, Microsoft and Nintendo. In addition, it has also customers in the area of consumer and mobile applications, such as LG, Spansion and SanDisk.
1
Fig. 4: Qimonda’s partners and partnerships in development and manufacturing
Fig. 5: Memories industry market share2
Strategic cooperations, such as alliances for R&D, manufacturing and foundry partnerships are crucial for Qimonda’s success. By sharing resources and know-how companies can be more competitive in the DRAM industry. An example is Inotera Memories (Taiwan), a company highly productive, competitive and at the leading edge in the DRAM industry. Other companies such as Elpida Memory, Sony, SanDisk, Winbond Electronics, AMD and many others have alliances with Qimonda, all benefiting from these partnerships (figure 4).
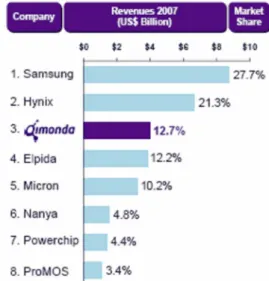
Besides the uncertain nature of the semiconductor market, including trends in demand and prices and other inherent risks, Qimonda also competes globally with other DRAM manufacturers, including Samsung Electronics, Hynix Semiconductor, Elpida Memory, Micron Technology and Nanya Technology.
In the picture below is shown the market share of DRAM products in 2007. Qimonda was in the third position with 12.7% of market share2.
2
Fig. 7: Qimonda’s plants worldwide (Jan 2007) Fig. 6: Operator with a wafer
2.2 Production structure
Production at Qimonda AG is divided into two major phases.Frontend plants produce wafers (silicon discs – figure 6) that will be transformed into several small rectangles, the chips, at Backend plants. Then the chips will be assembled into modules or other electronic devices. Wafers can be produced either in 200mm or in 300mm of diameter, although the 300mm are taking over the market since they represent significant efficiency gains. The number of chips in a wafer depends on the dimensions of the chip to be produced and on the size of the wafer.
Today the company has several manufacturing plants around the world.Richmond (USA) and Dresden (Germany) are frontend plants; Porto (Portugal), Suzhou (China), Malacca (Malaysia) and Senai (Malaysia) are backend plants. Some of the backend plants are dedicated exclusively to components or modules, whereas others do both. Qimonda supplements its manufacturing capacity through joint ventures (Inotera and Winbond in Taiwan and SMIC in China) and subcontracted companies such as EEMS TECH (China). Qimonda also invests in R&D activities in several plants.
Fig. 9: Qimonda Porto
Fig. 8: Management board: Mr. Kin Wah Loh and Mr. Thomas J. Seifert, Mr. Armando Tavares and Mr. Paulo Queiróz
2.3 Management board
Currently, Qimonda AG board members are Mr. Kin Wah Loh, the President and CEO, and Mr. Thomas J. Seifert, member of the Management Board and Executive Vice President. In Portugal, Mr. Armando Tavares is the President and CEO of Qimonda Portugal while Mr. Paulo Queiróz is the Executive Vice President and Plant Manager (figure 8).
2.4 Qimonda Portugal
Qimonda Portugal (QPT) is the largest backend plant of the group Qimonda AG. Since its foundation in 1996, as Siemens Semicondutores, S.A., great success was achieved. With the birth of Infineon, in 1999, it continued to excel within the group. Today, as Qimonda Portugal S.A., this plant is considered a highly efficient mixed facility of great importance, focusing on Manufacturing Excellence. About 7% of the worldwide DRAM production is assembled and tested in Porto.
Qimonda Portugal, with the unit in Vila do Conde, is the biggest assembly and test plant in Europe, with a total size of 22.000m2 and a production area of 15.500m2. Currently Qimonda Portugal has two production centers and one of research and development center. With about 2000 employees, the company believes that qualification and continuous training will help it continuing to excel in a fast changing and demanding market. The group Qimonda is the second largest foreign investment in Portugal, with an accumulated of almost 700 million Euros.
As previously mentioned, Qimonda Portugal is a backend plant. It receives the wafers from the frontend plants and then produces the chips. These chips are sent to distribution centers and then delivered to the final customer or go to other plants to be assembled in modules.
Two years ago, Qimonda modules line was moved to Malacca and all component lines from Malacca were transferred to Porto. So at this moment, Qimonda Portugal only produces components.
In the first semester 2007, the company was the major national exporter3 having generatedan annual volume of sales of 3.61 billion Euros in that year, dethroning the sales numbers of Petrogal and Autoeuropa.
Recently Qimonda and Centrosolar Group, a leading German solar company, signed a contract to jointly build, equip and operate a solar cell manufacturing plant. The joint venture will produce solar cells based on silicon and will be owned 49 percent by Centrosolar and 51 percent by Qimonda Solar GmbH, a 100 percent subsidiary of Qimonda AG. In the planned cooperation, Qimonda will contribute its existing know-how in silicon-based mass production as well as important access to silicon supply. Centrosolar will contribute its expertise with solar systems and the sales and distribution of solar modules. The joint venture company which will be located on Qimonda’s existing plant in Vila do Conde, Portugal is planned to initially invest 70 million euros by September 2009.
With the start the production of 65nm Buried Wordline technology Qimonda has achieved a major milestone. This new technology combines high performance, low power consumption and small chip sizes, contributing to enlargement of the company’s product portfolio. In addition Qimonda has begun developing its next generation 46nm Buried Wordline technology and is well on track to start mass production by mid 2009. Offering more than twice the number of bits compared to the 65nm technology, the introduction of our 46nm technology will be a major step towards Qimonda’s goal of being “The World’s Leading Creative Memory Company”. Nevertheless, achieving these objectives depends on the ability of the Qimonda group to overcome the current insolvency situation.
2.4.1 Productive areas
To the development of this project it was important to understand the complexity of the processes involved in the production of semiconductors, so one of the first steps of the project consisted in knowing the components’ productive areas.
Although Qimonda Portugal is a Backend plant, it also performs two operations that are normally carried out at Frontend plants.
So the production process at Qimonda Portugal can be divided into: Frontend Operations
- Wafer Test (WTEST)
- Wafer Level Assembly (WLA) Backend Operations
- Pre-Assembly (PREASSY)
- Components Assembly (CAssembly): Front of Line (FOL) and End of Line (EOL) - Components Test (CTest): Burn-In (BUI), Test and Mark, Scan and Pack (MSP)
3
Fig. 11: 10K suit
The production of semiconductors requires a very controlled environment in terms of temperature, humidity, number of particles and static electricity as these factors can affect the quality of the final product. This is why the production areas are also called “clean rooms”. There are three different areas depending on maximum number of particles admitted per volume unit: 1k, 10k and 100k. Wafer Test and Assembly Operations are 10k areas as they are in direct contact with the wafers’silicium, while Test Operations are 100k areas. RDL is a very delicate area, photosensitive and must be performed under yellow light so it is a 1k area.
In the following section the productive areas of Qimonda will be explained with more detail.
Wafer Test
Wafer Test is the final Frontend area. Here the wafers are tested to assure that, according to established standards of quality, they are functionally healthy before going to the Backend process where they will become individual components.
In a wafer, not all dies have the same quality. The information of each die is kept in a Wafer Map that differentiates the quality of each die through colour and number coding. These maps are useful in Backend Operations, when the dies are extracted from the wafer.
Fig. 12: Wafer Map
Fig. 13: Wafer from the Pre-Assembly
Wafer Level Assembly
In the WLA area each die of the wafer is prepared for multi-die packaging. This technology was recently introduced at Qimonda and it consists of making components with more than one die inside. Presently, Qimonda only produces Dual-Die chips (chips with two dies). Here, the bond pads of the dies that were aligned down the middle of the die are “dragged” to the periphery, so that the Wire Bonding can be performed successfully.
Pre-Assembly
Pre-Assembly is the first Backend area. The objective of this area is to prepare the wafers to the next area, the FOL. There are two different processes: Full Cut (FC) and Half Cut (HC). Although both processes have the same operations they are executed in a different order. In the FC the first operation is Laminating, then Grinding, Mounting and Peeling (GMP) and finally Dicing. In the HC the first operation is Dicing, then Laminating and GMP.
In the Dicing operation each die is individualized. In the FC the first blade makes a cut and then the second blade cuts deeper while in the HC the blades cut simultaneously. To prevent the dies from falling down there is an adhesive tape. The wafers are now individualized in chips.
The Laminating process consists in the application of a tape in the active side of the wafer that will protect it in the next operation, the Grinding. Here the wafer is grinded to decrease its thickness. While in HC there are made two polishments (one thicker and the other thinner), in FC there is one extra polishment.
Then, in the Mounting operation, the wafers are mounted on a frame, using a dicing tape. This frame is used to support the wafer in the next steps. The tape applied is removed in an operation named Peeling.
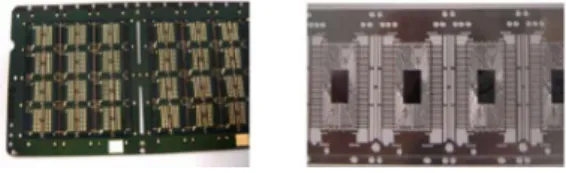
Fig. 15: Substrates and leadframes
Components Assembly
Until this stage of production we were handling with wafers, but from now on the units will be dies. Here it is important to distinguish between two major groups of products: TSOP and BOC, because although both products share most parte of the test processes, there are some significative differences in the assembly processes as well as in the raw materials.
BOC products have some advantages compared to TSOP: are cheaper, have the same capacity but lower energy consumption and better performance. For these reasons, it is expected that the BOCs replace the TSOPs within a few years. Nowadays BOCs represent approximately 80% of the production volume at Qimonda compared to the 20% of TSOPs.
The wafers with individualized dies come from the Pre-Assembly to the Bond area. In the Front of Line there are two main operations: Die-Bonding and Wire-Bonding. In the Die Bonding operation each chip is extracted from the wafer (through the reading of the wafer map) and then placed on the leadframe or substrate, depending if the product is TSOP or BOC. To make the connection between the die and the physical support there is an intermediate operation, Printing, where an adhesive is placed on the substrate. The leadframes already have that adhesive which is placed by the suppliers.
TSOPs use leadframes, which is a metal structure that will make the contacts to the Module’s PCB or to any other board to which the component may be attached; the BOC’s use a different technology, the component is directly mounted to a PCB which in turn can be attached to its final location through the use of solder balls.
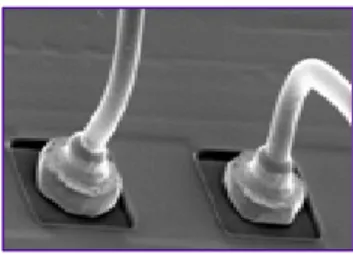
The Wire Bonding establishes an electrical contact between the bond pads of the chip and the leads of the leadframe in case of TSOP products or the substrate fingers for the BOC’s, according to the product’s configuration. This connection is made by using gold wire of high purity (99%) which assures an excellent conduction. The bond pads are the terminals of the chip that make possible the communication between the chips and the exterior.
Fig. 17: TSOP after molding Fig. 16: Wire Bonding
Fig. 18: Solder balls
At the EOL the BOC and TSOP products are submitted to different operations. The first operation, Molding, is similar to both types of products, where a layer of mold compound is applied over the component in order to isolate the contacts of the dies from the environment.
Then, for the BOC, solder balls are placed on the substrate pads to make the connection between the PCB and the chip, in an operation called Ball Placing. These solder balls are equivalent to the leads of TSOP products.
The Reflow Oven makes the soldering of the balls to the substrate. In the last operation, Singulation, the units are individualized through a cutting process using blades in resemblance with the dicing operation previously seen.
In case of the TSOP products, after molding, the excess of mould compound and the dambar that links the leads are removed in an operation called Dedam/Dejunk. Then the components go through a sequence of baths, including a solution of Sn and Pb that covers the leads improving its mechanical resistance. In case of green products the lead (Pb) is eliminated through an electrochemical process. The last operation of the EOL is Trim & Form. Here the units are individualized, is given the wanted shape to the leads and the excess material that isn’t necessary for the assembly is cut off.
Components Test
At Test Operations, components will go through a series of tests so that, according to their performance, they are marked with the correspondent quality. There are three operations: Burn-In, Test and MSP.
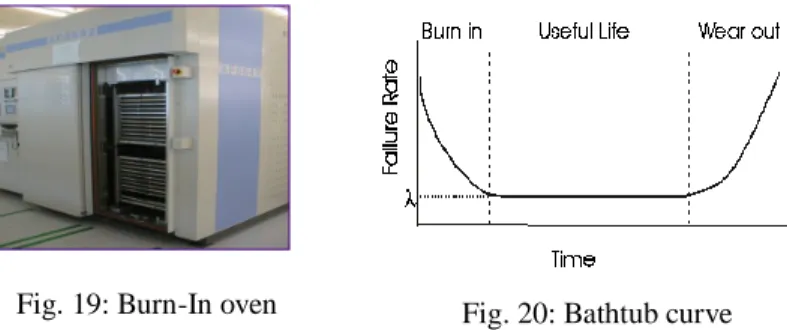
14 Fig. 19: Burn-In oven Fig. 20: Bathtub curve
The main goal of the Burn-In area is to reduce the failure rate of the chips by exposing them to electric stress under high temperatures (125ºC) inside an oven (figure 19). This aging process simulates, under extreme conditions, the units functioning through time, with the objective to reduce child mortality which is the main cause of failures of semiconductors in the first years of utilization. These tests allow the classification of units according to different bin sorts (Pass, 2nd Quality and Fail). As it is shown in the figure 20, at the beginning, the components present a high failure rate; therefore, the ageing must be accelerated so they pass to a constant failure rate which is a characteristic of the electronic components.
In the Test area the chips will be exposed to more tests with the main objective to analyze the speed of each chip. First the components go through “stress tests” (Core Tests). Every product is submitted to, at least, two electric tests: a Low Temperature Test (-10º,-25º,-40º) and a High Temperature Test (85ºC to +95ºC) to test their functionality. Some products also do a High Speed Test where the speed of response of each component will be tested. Here there are two types of equipments: Testers and Handlers (figure 21). Testers are responsible for the generation of all the electrical signals that will be applied to the memory in order to verify its good functioning as well as its performance. Through the execution of a specific test program for each type of product, the Tester sends the result to the Handler. This result consists in a separation of the products by bins: 1 to 4 – Pass (speed sorts), 5 to 8 – Fails. This classification is important to control the quality and the characteristics of the final product, as well as all Frontend and Backend processes.
The last production area is the Mark, Scan and Pack. At the MSP components are laser marked with the brand and the sales description and then they are scanned to make sure that they are correctly marked and to inspect the leads or the solder balls. Finally they are packed (figure 22) in reels (95%) or trays (5%) and delivered to the shipping area (figure 23).
Fig. 21: Test equipment
3 State of art
The highly dynamic market of semiconductors is characterized by rapid changing demands and product mixes.
In contrast to frontend operations, where the maintenance of high production volumes is often the goal, backend operations are associated with a particular customer and a due date. The demand for on-time delivery of high quality products has motivated the implementation of technologies based on scheduling rules to guarantee customers’ satisfaction and answer to the management’s concerns (Jampani and Mason, 2007).
Operations management in manufacturing facilities can be divided into three basic levels: strategic planning, tactical planning and operational control. Operational control, also called shop floor scheduling, is the lowest level of planning and deals with the decisions about the release of new jobs into the factory, sequencing of jobs, and dispatching new jobs for particular sets of resources. These short-term production targets derive from the high level production plans (Jula and Leachman, 2006).
In the semiconductor industry the main challenges are to maximize the throughput of the facility while maintaining low cycles times and work-in-progress (WIP), high machine utilization, minimize setup times and responding rapidly to the customer demands. Scheduling has the objective to optimize one or more of these objectives, although it is desirable to have a schedule that performs acceptably with respect to some of the objectives, rather than one that performs very well with respect to one objective and very poorly with respect to others (Gupta and Sivakumar, 2004).
According to Gupta and Sivakumar (2004), there are essentially four different approaches to semiconductor manufacturing scheduling problem: heuristic or dispatching rules, mathematical programming techniques (e.g. Branch and Bound and Lagrangian relaxation), neighborhood search methods and artificial intelligence techniques.
Dispatching rules have been extensively applied to the scheduling problems in semiconductor manufacturing, due to their low computational requirements, ease of implementation and intuitive application. However, dispatching rules do not guarantee finding an optimal solution even for a single objective; they aim instead at finding reasonable solutions in a relatively short period of time (Dabbas and Fowler, 2003)
Different dispatching rules target different performance objectives. Some of the well-known dispatching heuristics are first-in-first-out (FIFO), shortest processing time (SPT), largest processing time (LPT), earliest job due date (Job-EDD), earliest operation due date (Operation-EDD), among others (Dabbas and Fowler, 2003).
Since no one rule performs well for all performance measures, researches have been made in the integration of a multi-criteria approach justified by the need of the user to make a selection of the best satisfying scheduling according to a set of conflicting criteria, as usually encountered in a job-shop scheduling context (Mesghouni et all,1999).
Dabbas et al. (2003) proposed a modified scheduling approach that combines multiple dispatching criteria into a single rule with the objective of simultaneously optimizing multiple objectives. This is accomplished using a linear combination with relative weights that identify the contribution of the different criteria. The weights’ assignments to the different criteria are optimized using a mixture design of experiments (DOE) and multiple response optimization. Results using this new approach show significant improvement versus the use of a single dispatching criterion.
Most of the stated rules couldn’t give an answer to the objectives of the project: assure that the right quantities are sent to the right destinations and on-time, in order to maintain a high CLIP percentage which is directly related to customer service.
In this project the rules for scheduling were based on the priority of the products and also in the percentage of fulfillment of the demand. Lot selection was made according the optimal combination of lots that fulfilled the quantity to process. Besides, it also ensures high machine utilization and throughput and due date accuracy.
The MSP Scheduler fills the gap between higher level production planning and lower-level scheduling by establishing short-term production targets and priority scores for each product. Although planning is performed at an aggregated order level without regard to the originating customer placing the order, the performance is measured per individual customer order (Jampani and Mason, 2007). This is the reason why it is so important to have a scheduling tool that helps the users to take the best decisions in order to achieve the company’s goals.
Fig. 24 - Process flow in the MSP area
4 Project Scope: MSP Scheduler
4.1 Logistics of the MSP area
Before starting developing this tool it was important to first understand the logistics of the area. The Mark, Scan & Pack area has, just like the name says, the following main operations:
- Laser making of the units
- Inspection of the units
- Packaging in reels or trays
The process flow, shown in figure 24, depends on the type of product (TSOP or BOC) and the expedition material (Reels or Trays) as can be seen in the image below.
MSP Preparation is the first operation of this area. Lots arrive, in trays, to the MSP Prep from the Test area. According to the inventory, production volume and FIFO (first in first out) lots are taken from the kardex (storage system). Then the lots are counted, in order to verify if the real quantity is equal to the quantity indicated in the Operator Work Space (OWS) system. After that they are moved in and the units are transferred from straps to sleeves. In case there are lots with the same baunumber, same owner and in the same operation, they can be merged physically and in system. Finally the lots are moved out.
Depending on the expedition material, the units are submitted to different operations. In case of trays, products first do MSP and then 12h Baking; if it is Tape & Reel they first do 9h Baking and then MSP.
Fig. 25 - Marked chip
Fig. 26 - Reel after packing
There is an intermediate step in case the expedition material is tray, named MSP Tray, where it is made the transition from Productive Trays to Shipping Trays, which are cheaper.
In the MSP Baking the sleeves are placed in ovens at a temperature of 125ºC for 9 or 12 hours. Only BOC products are submitted to Baking to remove the humidity the units might have accumulated. TSOP aren’t submitted to this operation because they aren’t very susceptible to humidity. After the MSP Preparation they immediately do MSP. Then the units are cooled down for one hour (Cooling). In case the units aren’t packed in the next 14 hours then they will have to do Baking again to avoid being packed with humidity.
At the MSP step the units are laser marked (see figure 25), inspected (marking inspection and inspection of the shape and position of the leads or the solder balls of the units) and then packed. In case there are problems with the leads the units will pass trough Lead Conditioning where units are recovered.
With the move-in to this step the labels are printed containing the information about date code, VKL (destination baunumber), sales description and Quantity. The number of packed units depends on the type of product and expedition material:TSOP Reel - 1500, BOC Reel - 2000, TSOP Tray - 1080 and BOC Tray - 1360.
To prevent humidity accumulation after shipping, the reels are placed in vacuum bags, along with three clay desiccants and a humidity indicator, in an operation named Dry Packing. This is also exclusive for the BOC products. After that the units are placed in “pizza boxes” and follow to the QaPackCheck.
QaPackCheck is an operation of quality control where the products and the quality of the packaging are verified. If everything is ok, then is it placed on the pizza box the respective QSeal (quality seal), that depends on quality of the product. The boxes are then placed in the Kardex (storage system), being ready for shipping.
4.2 Initial Problem
The PL department receives, with two weeks in advance, the orders made by Munich. At this stage the promised quantity is normally equal to the requested, unless there are restrictions in terms of capacity or materials. However, this initial promise can be changed until Tuesday of the week of the delivery trough the Requests and Promises-User Interface (RAP-UI), which is programme that allows communication between Porto and Munich. Here, change of promises (COPs) can be made in case the quantity expected is not equal to the requested quantity. After a period of analysis of the way planners make the weekly plan for their products it was possible to identify the five main reasons that contribute to the significative differences between the planned quantities and the ones actually delivered:
a. Yield losses b. Speed shares c. Lots on hold
d. Incorrect priorities given to the lots
e. Lack of visibility on the demand by destination
To better understand the issues behind each of these factors and identify the ones that can be improved, a more detailed explanation will be given in the following section.
a. Yield Losses
Yield is an efficiency indicator that measures the return of the process. It is calculated by the ratio between the quantity out and the quantity in. This indicator is equivalent to the percentage of failures in the productive process and is very product related. In fact, most of the failures aren’t related to the productive process, but to the product itself. This way, only 1% to 1.5% of yield losses are process’ problems, the others are Frontends’ problems.
The only thing that can and is being done, by the Quality Management (QM) department, is monitoring these losses, in order to identify any irregular situation.
b. Speed Shares
In the Test area products are submitted to a group of functional and speed tests where the units are separated by bin sorts according to the result of both tests. Although a product is being tested to a certain speed, at the end of the test there can be different percentages of different speeds that are called speed shares.
For example when 256M T90 or T90C is tested for the speed 2.5Fns, at the end there will be 70% with 2.5Fns, 20% with 3Sns and 10% with 3.7ns (the highest numbers are the lower in terms of speed). Components might not pass in the tested speed, but they can pass on a slower speed.
Table 1 - Sort Table
A product that has one speed at the beginning of the test can have different speeds at the end. Currently there is a Sort Table where the tested speed and speed shares for each product are defined. In conclusion, nothing can be done to improve a product’s speed share.
c. Lots on Hold
A lot is on hold when it is stopped from continuing its process. There are innumerous reasons why a lot can be placed on hold but they all fit into three categories: quality problems, logistics issues and process control. A lot on hold has always one or more hold codes that are associated to different departments, according to the motive why the lot was put on hold. Only after the problem is solved, is given disposition to the lots, so they can continue being processed.
However, when planners are doing their plan they don’t know if there are lots that will be put on hold for some reason neither what quantities. It is not possible to foresee this situation before it happens. Currently, when there are lots on hold that are really needed to fulfill the plan, planners contact the responsibles for the lots and ask them to release those lots as soon as possible. There are some issues that can take more time to be solutioned and the lots have to wait for disposition and sometimes are delivered in the following week.
At the time it is being developed a Lean Six Sigma project with the objective to decrease the number of lots that are put on hold. The reasons why lots are placed on hold are being analyzed in order to optimize the disposition process and search for alternatives ways of managing these lots that can simplify the logistic process.
Given this, lots on hold won’t be object of the project.
d. Incorrect priorities given to the lots
In the production line, operators not always make the right decisions in what comes to choosing the lots to process. This has a great impact in all areas but especially in the MSP area, because they might be lots that are really needed to the plan fulfillment and must be processed. Given this it is important that operators know which lots are more prioritary to prevent failing supplies just because they chose to process other lots.
Table 2 - Relations between CTPO, VKL and destinations
e. Lack of visibility of the demand by destination
Lots produced at Qimonda’s plant can be shipped to different distributions centers (DCs): Europe (DCE), Asia (DCA), USA (DCU) and Japan (DCJ). They can also be sent to the Module plant in Senai (MDCJ).
The destinations assigned to the lots interfere directly with the procedures at the MSP area, because the quantities to ship, the packing type and the contents of the labels depend on the destination.
According to the current system at Qimonda, a CTPO baunumber (productive baunumber) can be associated to several VKL baunumbers (destination baunumbers), one for each destination. This way, in the MSP area there might be lots with the same CTPO baunumber but with different VKL baunumbers. An example can be seen in the table below.
The same CTPO baunumber 99300349 is associated to three different destinations and consequently the product will have three different VKL baunumbers.
In case there is a high volume of products waiting to be processed, operators have the indication to increase the average lot size, in order to maximize the capacity of the machines and productivity, until a maximum of 35k (maximum lot size accepted by the DCs). This is problematic because lots with the same CTPO baunumber may be merged although they have different destinations, since in the MSP area people only have access to the CTPO baunumber and not to the VKL baunumber.
The problem in merging lots with the same CTPO baunumber but different VKL baunumbers is there is a tool, the Demand Manager that allocates products to destinations according to the quantities defined for each destination, in the Demand Fulfillment (interface of the Demand Manger). For each product, there might be one or more destinations with different demands to fulfill. This tool is totally invisible to the people in the production line.
If lots are merged, then the Demand Manager will act, sending the merged lot to the destination with higher priority, in the Demand Fulfillment. If there is only one destination, this isn’t problematic but when there is more than one, usually the more priority destination receives quantities in excess that will lack in the other destinations.
In the Demand Fulfillment, according to the demand for the current week and the week after are opened pairs of demand (demand + prio) according to the requests.
In the example given in table 2, the product 128M S11N has a demand of 25k to the Distribution Center in Asia (DCA) in week n and so it was opened a pair of demand of 25k with prio 9. This means that this pair won’t close until that quantity is fulfilled.
After that pair is closed, all the other lots will be allocated to the Distribution Center in Europe (DCE) that has a lower priority. The opened pair for DCE was of 5000k so that this pair never closes and no lot stays without destination.
Table 3: Demand Fulfillment
Assuming that there were only 40k of that product in the production line and the lots were merged (until a maximum of 35k), then the final lot would be allocated to the most priority destination (DCA) that instead of 25k would receive 40k. Since there wasn’t any more material to process, DCE wouldn’t receive that product. In terms of CLIP, DCA would have 100% (although it exceeded in 10k the quantity demanded) and DCE only 33% (the delivered quantity was of 5k when the demanded quantity was of 15k).
This situation is very common especially in case of TSOP products, due to small demands. If operators knew what quantities should be delivered to each destination they could better manage the incoming lots in order to fulfill the demands.
In conclusion, there are two main problems where there is room for improvement: the incorrect priorities given to the lots and the lack of visibility of the demand by destination. Both of them have a major impact in the output of the line and can be solved trough the implementation of a scheduling tool in the MSP area.
4.3 MSP Scheduler Specification
The MSP Scheduler resulted from the need to solve the two problems identified, incorrect priorities given to the lots and lack of visibility of the demand by destination.
They were two main reasons for implementing this tool at the MSP area. On the one hand those problems have a major impact in this last productive area, since there might be critical products that must be processed and the right quantities must be delivered to the right destinations.
On the other hand the MSP is the only area of the plant where there isn’t any support tool. Since it is an area with many specific variables and sometimes contradictory goals, there should be a tool to support the decision process.
One of the first steps was the definition of what would be the right approach to ensure that those problems are overcome. Initially it was thought that maybe a report, with the demands of each product for each destination, would answer those problems. However, information isn’t always enough. Sometimes, even with the right information people don’t always take the best decisions. This way, it was necessary a tool that besides informing people, would help them to take the best decisions according to the situation at the moment, a scheduler.
The next step was deciding whether this tool would be an independent tool or whether it would be integrated in the existing business software (SAP) or in the Operator Work Space (OWS), Qimonda’s manufacturing execution system (Appendix B).
The integration of the tool in SAP wasn’t feasible because this software is only used for the management of materials and not to line management. The OWS is a tool used in different areas of Qimonda’s plant while this would be an exclusive tool for the MSP area. Therefore, the choice fell on the development of an independent tool with the advantage of being easier to upgrade, since it doesn’t interfere with other tools.
It was aligned with the Information Technologies (IT) department that the new scheduler would be built based on the structure of the existing schedulers in other productive areas, although the existing features and functions are completely different. This would make the computing implementation of the tool easier. In addition, the MSP Scheduler would be implemented as a new module in the current scheduler framework.
Before starting to develop this tool it was analyzed the currently existing data in the MSP area and in the PL department. Besides, it was also identified useful extra information that will help operators in their daily work and guarantee an effective communication between the planning and the production line.
In the MSP area, people have four different sources of information: OWS, Lot Traveller (“identity card” of the lot), Production Plan and Business Objects (BO) Reports.
o OWS: in the OWS are shown the lots to be processed and the lots already in process for the chosen step. Product information such as the CTPO baunumber and product description and also information on the lots (lot number, quantity, number of days in facility, restricted lots and lot restrictions) are displayed.
o Lot Traveller: the Lot Traveller has information on the lot number, CTPO baunumber, product description, owner, package and packing type. It also has specific information on the other steps of the area.
o Production Plan: the Production Plan given by the responsibles of the area indicates for each product the weekly and daily plan that should be achieved. It also shows the products with high priority (aligned with the PL department).
o BO Reports: the BO Reports give a global view of the flow of the area, allowing knowing whether the area is ahead or behind the plan. Besides they also give more detailed information on the wips of the products in each operation.
On the planning side, they have access to demands and percentage of fulfillment (or CLIP percentage) for each product and destination. Since in the MSP area they don’t have this visibility, in case there are products that have to be processed with urgency or a product that has to be sent to different destinations, an e-mail is sent to the responsibles of the area that transmit the information to the production line.
In order to ensure a more effective way of communication, that information is displayed in the MSP Scheduler, avoiding phone calls or e-mails exchange. Products are then ordered by priority and for each product and destination is indicated the quantity that has to be processed in order to meet the demand.
Besides, it was included the most relevant information that existed in those four different sources and also some extra helpful information: wip in test and the wip in the test gate (so that people know what products and quantities soon will get to their area), wip in MSP Prep divided in already moved in (which means that the lot can start to be processed) and not moved in and also the number of days in that step (to the control of the area).
In conclusion, the presented tool resulted from the combination of the existing information (until now spread over several places) and also adds useful functionalities to the management of the production line. However, the final prototype was defined only after a few meetings, with people that work in the production line and their responsibles, where they were discussed and analyzed the functionalities of the tool. The interface of the MSP Scheduler is simple to use (even for those that don’t have computer science knowledge), intuitive and user friendly and has been designed specifically to the MSP area.
With the MSP Scheduler operators know what product and quantities have to be processed considering the priorities of the different products and percentage of fulfillment for each destination. Here it is possible to visualize, by destination baunumber (VKL baunumber), the wips in the Test area (Wip Test and Wip Gate) and in the MSP Prep step (moved in and not moved in) and according to the priorities defined by the PL department and also CLIP percentages know what lots should be processed, helping in the fulfillment of the plan of every products. Besides it avoids sending excess quantities to a destination, through the control of merges and splits.
MSP Scheduler implementation is a major improvement for shop floor management as operators will launch always the right products at the right time and with the right quantities, according to the weekly plan defined by PL department. This new decision support tool will help to maintain a constantly higher CLIP one of the most important plant’s KPI, directly related to customer service. A detailed specification of this tool will be done in the next section.
4.3.1 MSP Scheduler logic
To starting using the MSP Scheduler the user first has to register in the system. In this tool there are two different tabs: Productive and Special. The information displayed in both tabs comes from the internal Master Data Base and from Qimonda’s Data Warehouse. When the MSP Scheduler is opened the Productive tab is shown.
Productive Tab - Upper Part
After opening session the user can choose between two types of products, TSOP or BOC. Then a list of all products, with defined plan, is shown. The criteria for ordering this list is the priority (main criteria) and the percentage (second criteria used in case of tie). The Productive tab provides the following information to the users, concerning each product:
o CTPO baunumber: Is the baunumber that people in the MSP area have access. If it hasn’t been released in the laser marking data base (data base of marking receipts), then a red exclamation point appears before the baunumber. This situation is problematic on the weekends when there is no one from the MSP department that can release the receipt (information marked on the chip). If the CTPO is not released then the system doesn’t allow its selection, showing an error message.
o Package: It is the package of the product as they usually see it in the MSP area. It is related to the dimensions of the chip.
o Packing Type: The packing type is equivalent to the expedition material that can be: Tape and Reel (Tape & Reel), Shipping Tray (Ship Tray) or Productive Tray (Prod Tray). The shipping trays are cheaper than the productive trays, so if the client accepts, the products will be sent in these trays. The expedition material depends on the type of product, destination and client.
o Prod_Desc: The product description includes the product’s memory size, shrink, frontend, package and configuration, e.g. 128M D11 QR2 PG-TSOPII-66 x16. o Wip Test: It corresponds to the volume in the Test area that within little time will
arrive to the MSP. This way, operators can manage better the lots if they know the products that are arriving.
o Wip Gate: It’s equivalent to the wip, not on hold, in the last step of the Test area.
o Wip MSP Prep: Wip Moved In in MspPrep step (√) and wip not Moved In (X)
o VKL baunumber_Dest: VKL baunumber and respective the destination.
o Prio: To differentiate between normal and priority products the colour of the lines for these lasts products is orange. As mentioned, prioritary products appear in the top of list. The definition of the priorities is made by the PL department. Usually the priority products are the ones critical to the CLIP or are to an important client. o %: It’s the percentage of fulfillment for each destination (CLIP percentage).
Products are order by percentage; the ones with the lower percentages are shown first. These percentages are updated every time there is a transaction, because the percentage will be different - when a certain quantity of a product is produced, there is less quantity to deliver. % = (volume out / demand for that week)*100 o Demand: Weekly demand defined on the plan by the PL department.
o ∆ (Qty to Process): Qty to Process = Weekly Demand - Quantity Out
o ? (Select boxes): The first product is automatically selected (first check box is selected). In case the user decides to choose a different product he just has to select it and the other check box is automatically deselected (the user can only choose one product at a time).
On the right side of the upper part of the tab there are four buttons:
o Move in Button: This button is only active if the selected product has the field Msp Prep X not empty. It shows a list of all the lots in MspPrep of the selected product that haven’t performed Move In. When clicking on the Ok button it opens as many windows of the Carrier Validation (OWS function) as the number of selected lots. This allows the disassociation of straps and association of sleeves using bar code reader when it is made the Move In to the MspPrep step.
The system is then automatically refreshed so that the material that wasn’t Moved In passes to the Move In column. This function was included in the MSP Scheduler so the operators didn’t have to use the OWS. Using two use two different programs would only duplicate and they might start questioning the advantages of the tool.
o Refresh: refresh button
o Baunumber Info: to find out some more detailed information of a baunumber o Print: used to print the list of products
Productive Tab - Lot Status
After selecting the product, a list of the existing lots of that product is automatically shown. This list is ordered by FIFO or Days in Facility. Information about the total number of lots of the selected product available at the MSP Prep and the number of selected lots can be seen on “Total Lots” and “Selected Lots”. The lot status provides the following information:
o Restricted Lot:if a lot is restricted it can not be merged or split. It is represented by a yellow warning sign in the first column. A lot can be restricted in case of experiences, evaluations and quality problems.
o Lot Number: number of the lot
o Days in Facility: number of days in Qimonda Porto o Days in Step: number of days in the step MSP Prep o Quantity (k): lot quantity
o Owner: lot owner
o Lot Restriction: Restriction that a lot might have (same reasons as restricted lots) o ? = Select Boxes: Automatically the system selects a group of lots although the user
can choose a different group. The rules for this selection will be present in the next section.
o Total Quantity: Is the total quantity of all selected lots.
o Confirm Button: The rules defined for this button will be presented in the next section. o Split: The use of the split button will also be explained in the next section
There are three more actions buttons whose functions are:
o Pick a lot: by writing down the lot number and it selects the lot. It’s an exception to the normal flow of the lot.
o Print: prints the list of all lots of the selected product
o Close Session: in case it is necessary to change the user, by clicking in button the new user can register in the system.
Rules to lot selection and Confirm button
Automatically the system selects a group of lots. However, this is only a suggestion as operator can choose a different group of lots, allowing more flexibility in the operations. The group of lots selected in each particular case will be presented in this section.
Nowadays demands are in multiples of 1k and the maximum lot size that arrives to the MSP area is between 10k and 15k. The maximum lot size, after merging, is 35k. Althoughthere is no restriction in the capacity of the machines, this the maximum lot size that can be send to the DCs. The maximum quantity that sent to a destination (in case there is more than one) can be at most 10% superior to the quantity demanded.
The criteria used for lots selection were: FIFO, machine utilization, setup time, number of splits and fulfillment of the demand for each destination. Although FIFO is currently a policy of the company, in many cases it doesn’t lead to the optimal solution. For instance there might be a group of lots that fulfills the demand and it isn’t selected because it doesn’t follow FIFO.
Fig. 32 - Fluxogram for lot selection
So, the group of lots chosen first takes in consideration the best combination of lots. In case there are lots with more than seven days in facility these must be chosen. However, if there is more than one destination and the quantity to process or the 35k limit is exceeded, splits should be made. The group of lots selected must as well maximize the machines utilization and minimize the setup times (merging lots until a maximum of 35k) and ensure that the demand of each destination is fulfilled, through the control of splits.
The fluxogram that describes the defined algorithm is present bellow:
The rules for lots selection depend mainly on the following factors: Q: Quantity to process for a given destination (<35k or >35k)
L: Quantity of all lots (L>Max or L<Max) → Max= Qty to process + 10% quantity demanded D: Number of destinations (or VKLs) for a CTPO baunumber (one or more than one)