Rev Saúde Pública 2005;39(2) www.fsp.usp.br/rsp
Assessment of lunch served in the Workers’
Food Program, Brazil
Karin Eleonora O liveira Savioa, Teresa H elena M acedo da Costaa, Édina M iazakib and Bethsáida de Abreu Soares Schmitzb
aDepartamento de Nutrição. Faculdade de Ciências da Saúde. Universidade de Brasília (UnB).
Brasília, DF, Brasil. bDepartamento de Estatística. UnB. Brasília, DF, Brasil
Study developed at the Departamento de Nutrição da Universidade de Brasília, Faculdade de Ciências da Saúde. Supported by Finatec (Fundação de Empreendimentos Financeiros e Tecnológicos - Universidade de Brasília - Grant n. 6370/01) and Ministry of Health (Grant n. 701/1999).
Based on the Master’s degree dissertation submitted to the Universidade de Brasília in 2002. Received on 23/6/2003. Reviewed on 14/5/2004. Approved on 13/9/2004.
Correspondence to:
Karin Eleonora Savio de Oliveira SQS 303 Apto 205 Bloco A Asa Sul 70336-010 Brasília, DF, Brasil E-mail: [email protected]
Keywords
Nutrition programmes and policies. Food consumption. Body mass index. Nutritional status. Workers. Risk factors. Food services. Anthropometry. Cross-sectional studies.
Abstract
Objective
In the light of the Workers’ Food Program (WFP) growth and its recent review of nutritional parameters regulations, the study aimed at evaluating food intake in WFP through dietary assessment of lunch served in the program and workers’ nutritional status.
Methods
A cross-sectional study was carried out in a representative sample of workers in Brasília, Federal District, Brazil. A total of 1,044 subjects who had lunch at 52 food and nutrition units were evaluated. Social-economic and demographic data were collected as well as anthropometric measures for calculating the Body Mass Index. Food intake was assessed by dish weight and direct observation of dish composition.
Results
Of all subjects, 43% had excess weight, 33.7% were overweight and 9.3% were obese. Males were most affected. Median lunch energy intake was 515 kcal in women and 736 kcal in men. Median dietary fiber intake was 6.0 g among women and 8.3 g among men, and median cholesterol intake was over 90 mg among subjects with excess weight.
Conclusions
The results indicate that the study population who is often seen as healthy is at nutritional risk. Workers in WFP should be targeted for health promotion strategies using especially nutritionists’ skills as educators.
INTRODUCTION
The Workers’ Food Program (WFP) was established under Act 6,321 of April 14, 197612 with the purpose of
improving workers’ nutritional status, especially of low income workforce, and aiming at generating a clear im-pact on their quality of life, reducing work-related inju-ries, increasing their productivity and preventing occu-pational health conditions as well. As WFP target is work-ers’ health, minimal nutritional requirements should be met. The main meals – lunch and dinner – should pro-vide at least 1,400 kcal or either 1,200 kcal for low-intensity jobs and 1,600 kcal for high-low-intensity jobs.
The WFP’s 25th anniversary was celebrated in 2002, and there are now eight million workers of more than 103 thousand companies enrolled in the program, 52% receiving meals on-site (cafeterias, buffet service or food basket programs) and 48% getting them in restaurants and marketplaces or through food and meal cupons.10
Rev Saúde Pública 2005;39(2) www.fsp.usp.br/rsp
Assessment of lunch served in the WFP Savio KEO et al
direct observation. Dish composition was carried out without the observation group’s involvement. This process was carefully monitored, and all food and servings were recorded in an appropriate form. When dish composition was over, each dish was weighted and labeled in the bottom side to allow for subse-quent calculation of the leftover/intake index using Gandra & Gambardella5 formula.
Based on direct observation records of dish compo-sition, lunch intake was calculated in grams. There were two final weights: a scale-measured weight and an es-timated weight from records of client servings. When the difference between observed and estimated weights exceeded 5%, the observed weight was replaced by the weight calculated in the following equation:
Observed weight = 2.47953 + 0.01388 WFP + 0.95225 estimated weight
The adjustment above was obtained by applying the method of minimum squares (R²=92.2%) using crude data of 1,044 subjects. To control for the effect of expe-rience gaining by the observation group recording dish composition and weighting, a so-called WFP variable was included in the statistical analysis, indicating the ascending order of observations from WFP 1 to WFP 1,044 and including all subjects in the analysis.
The Virtual Nutri software, version 1.0,14 was used
in the nutritional assessment. In the nutritional as-sessment of the meal, energy intake, macronutrient percent energy as well as micronutrients such as iron, calcium, zinc, vitamin C and A were analyzed. Cho-lesterol and fibers were also studied. The choice of the micronutrients studied was based on their bio-availability and known association with public health conditions in Brazil.
The net dietary protein-calorie index (NDPcal%), which indicates the percentage of net protein over total calories in the menu, was calculated. The NDPcal is given by crude protein content multiplied by fac-tors included in MLE regulations and it should be at least 6% regardless of the job, which ensures adequate protein utilization.12
Before dish composition, subjects were asked to take off their shoes, coats or any clothing item that could be taken off, as well as heavy items they had in their pock-ets, and they were positioned erect with the ear-eye plane parallel to the floor (Frankfurt plane), eyes focused for-ward and arms relaxed.8 A Soenhle scale (manufactured
in Germany) with 150 kg capacity and 100 g accuracy and a infra-red reading Soenhle stadiometer with 1 cm accuracy were used. The Body Mass Index (BMI) was of people’s demands and social changes. It should be
underlined the relevance of nutritionists’ role and their need in heading the Food and Nutrition Units (FNU), acting as health promoters close to the large clientele of this growing industry.
Numerous WFP-affiliated eating places offer self-services and pay-by-weight self-self-services and they are widely available in both business and industrial fa-cilities. Therefore, the WFP clientele has taken con-trol over meal choice and its composition, which was prevented before when conventional menu and stand-ard buffet programs were in place. Yet being able to choose does not imply people will opt for a healthy meal where both energy and nutrient intake meet their needs and ensure that a healthy weight is maintained.
Improving workers’ nutritional status – regardless of food service available – is one of WFP’s goals and food education is aimed at encouraging companies to engage in an ongoing education process, incorpo-rating from the Brazilian diet positive changes and aspects of current food consumption. The purpose of the present study is to assess the existing meal model and food intake of the clientele served in WFP-affili-ated eating places.
M ETH O D S
Sampling was based on the official listing from the Ministry of Labor and Employment (MLE) of all WFP-affiliated eating places in Brasília, Federal District. MLE listing was also linked to the listing of all eating places registered in the 1st Regional Board of Nutrition
(RBN-1). FNUs were classified as low, medium and large-size according to the number of meals served (MLE data). After statistically calculating a single random sample at a 5% absolute error margin, a representative sample comprising 1,044 subjects of 52 FNUs, who attended WFP-affiliated eating places in Brasília, was estab-lished. A cross-sectional study was carried out and data were collected from October 2000 to September 2001.
Assessment of food intake was carried out during lunch time. First, before opening hours, the stand-ardization of mean weight of food served was con-ducted using FNU own cutlery. Three servings of each food were obtained using three different meas-ures: spoonful, medium, level spoon, or large, me-dium, and small size. FNU scales were used for food weighting and, when a scale was not available, an electronic precision scale with 2 kg maximum ca-pacity and 0.01 g accuracy was used.
!
Rev Saúde Pública 2005;39(2) www.fsp.usp.br/rsp
Assessment of lunch served in the WFP Savio KEO et al
calculated using the following formula: BMI = weight (kg)/height2 (m). The World Health Organization (WHO)
BMI classification was applied.17
The Epi Info software was used for creating data-base. Statistical data were presented as medians, means and standard deviations. The Chi-square (χ2)test was
used to analyze different variables by sex. The Mann-Whitney and Kruskal-Wallis tests were used to calcu-late nutrient medians. A 5% level of significance was set. When needed, multiple comparisons were per-formed using Bonferroni method. All data were dou-ble checked.
The study was approved by the Universidade de Brasília Human Research Ethics Committee accord-ing to the National Health Board Decree 196/96.2
RESU LTS
Table 1 shows that 88% of the study population aged between 20 and 50 years, 60% were men, and of them, most were married men aging less than 34 years.
More than 50% of the study population had an in-come greater than five minimum wages, 63% in women and 37% in men. Two-thirds had attended or completed high school, describing a population of good educa-tion level. There was no statistically significant
differ-ence of income distribution but lower schooling was more frequently seen among men. Excess weight was seen in both men and women, 48.1% and 35.1% re-spectively, and a higher prevalence of overweight and obesity was found among men.
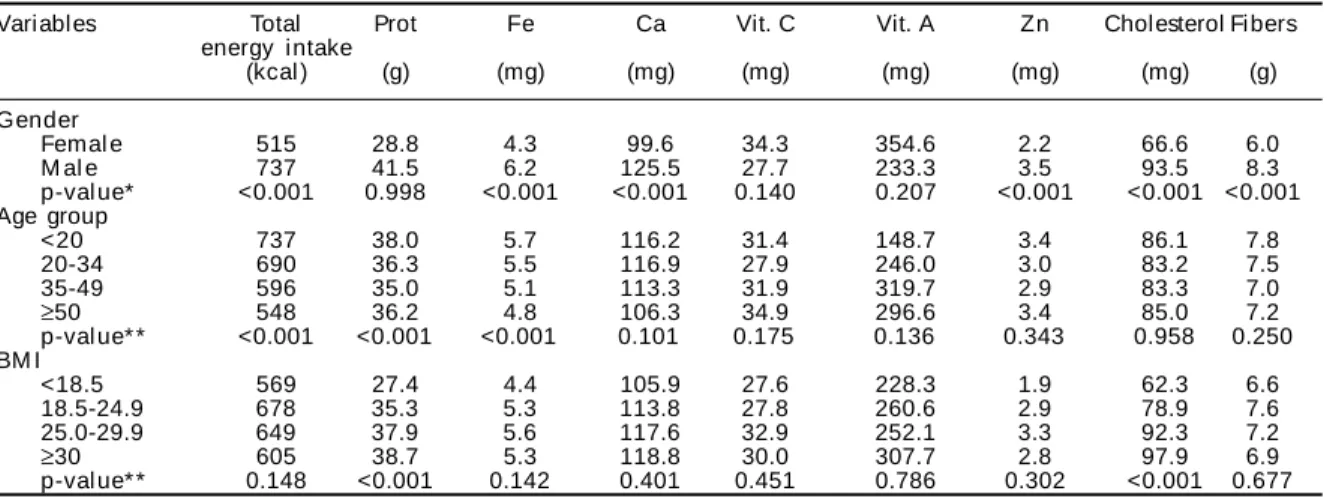
It was found that study subjects were regulars at lunch time of the eating places studied with mean attend-ance of 4.6 days a week and median of 5.0 days. Table 2 shows medians of nutrients studied that were ingested during lunch. Median energy intake was below the WFP recommendation, ranging from 1,200 to 1,600 kcal, a deficit of more than 800 kcal given the 1,400 kcal intake standard recommendation. Median energy intake was 515 among women and 737 among men.
Fiber intake by sex (Table 2) was statistically dif-ferent, ranging from 6.0 g to 8.3 g. In addition, iron, calcium, zinc, and cholesterol intake was lower among women (p<0.001). There were no significant differ-ences in protein, vitamin C and A intake.
The analysis by age group showed a reduction in total energy intake, proteins, and iron as age increased (p<0.001). Multiple comparisons of total energy and protein intake did not show significant differences except in the age group 35-49 years. As for iron in-take, a significant difference was found when com-paring the age group 35-49 years to 20-34 years. All
Table 1 - Socioeconomic characteristics, education and nutritional status of workers enrolled in WFP. Brasília, Brazil, 2000-2001.
Gender
Variables Femal e M al e Total p-val ue*
N % N % N %
Age group
<20 22 5.3 21 3.3 43 4.1 0.017
20-34 207 50.2 376 59.6 583 55.8
35-49 150 36.3 186 29.5 336 32.2
≥50 34 8.2 48 7.6 82 7.8
Total 413 100 631 100 1,044 100
M arital status
Partner 182 44.3 371 58.9 553 53.1 0.000
No partner 229 55.7 259 41.1 488 46.9
Total 411 100 630 100 1,041 100
Income* * *
<2 minimum wages 52 10.7 84 13.4 136 13.1 0.0829
2-4 minimum wages 100 24.5 184 29.3 284 27.3
5-6 minimum wages 44 10.8 89 14.1 133 12.8
7-8 minimum wages 39 9.5 57 9.1 96 9.3
≥9 minimum wages 174 42.5 214 34.1 388 37.4
Total 409 100 628 100 1,037 100
School i ng
0-4grade 24 5.8 37 5.9 61 5.8 <0.0001
5th-8th grades 65 15.7 162 25.7 227 21.7
High school 177 42.9 292 46.3 469 44.9
U ni versi ty 112 27.1 117 18.5 229 21.9
Graduate school 35 8.5 23 3.6 58 5.5
Total 413 100 631 100 1,044 100
BM I <18.5 17 4.1 12 1.9 29 2.8 0.0001
18.5-24.9 251 60.8 315 49.9 566 54.2
25.0-29.9 110 26.6 242 38.3 352 33.7
≥30.0 35 8.5 62 9.8 97 9.3
Total 413 100 631 100 1,044 100
*χ2 test
" Rev Saúde Pública 2005;39(2) www.fsp.usp.br/rsp
Assessment of lunch served in the WFP Savio KEO et al
other nutrient intake did not show any significant age difference.
In regard to the nutritional assessment of lunch and study population nutritional status (Table 2), lower energy intake was associated to subjects with BMI <18.5 kg/m² and BMI ≥30.0 kg/m². A small differ-ence was seen in different BMIs and it was of about 100 kcal between the lowest and the highest BMIs.
Median fiber intake was reduced from BMI <18.5 kg/m². Cholesterol and protein intake increased as BMI increased (p<0.0001). Bonferroni test showed a significant cholesterol difference in subjects with BMI 18.5-24.9 compared to BMI 25.0-29.9. Protein intake was significant different when comparing sub-jects with BMI ≥30 to those with BMI <18.5. There were no differences for all other nutrients.
Table 3 shows increased energy intake from pro-tein and reduced carbohydrate intake across age groups and BMIs (p<0.001). A significant difference was seen in energy intake from protein and carbohy-drates between subjects aging 35-49 years and those aging 20-34 years. The observed increased fat intake was not significant. It also shows a significant differ-ence by sex in energy intake from protein and carbo-hydrates, which was higher among men.
Table 4 illustrates that net protein percentage over total energy intake is frequently above 12% in all FNUs but it was remarkably higher in medium-sized units. The WFP recommendation is at least 6%.
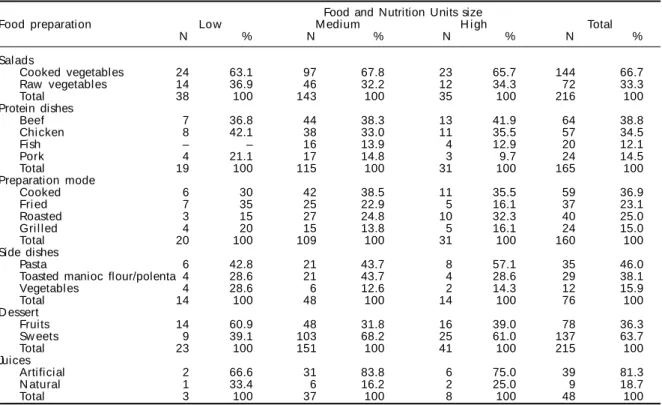
Table 5 underlines that menus prioritize salads made of cooked instead of raw vegetables in all units. As for protein food, beef and chicken are most fre-quently served and the former is more common in
medium and large-sized units. Regarding their prepa-ration, protein was more often cooked or fried.
Side dishes served were more often pasta (46%) and toasted manioc flour/polenta (38%), and less fre-quently (mostly fried) vegetables.
As desserts, sweets counted for more than 60%; only small-sized units served more fruits. On-site observa-tion of small-sized FNUs revealed a wider variety of fruits offered but sweets were available in larger amounts. Artificial juices accounted for more than 80% of beverage offered.
D ISCU SSIO N
Brazilian education has improved in the last dec-ade. According to the 2000 Demographic Census,7
more developed regions, such as the Midwestern region, have achieved better education levels,6 Table 2 - Lunch assessment of workers enrolled in Worker’s Food Program according to mean values of energy, macro and micro nutrients intake. Brasília, Brazil, 2000-2001.
Variables Total Prot Fe Ca Vit. C Vit. A Zn Cholesterol Fi bers energy i ntake
(kcal ) (g) (mg) (mg) (mg) (mg) (mg) (mg) (g)
Gender
Femal e 515 28.8 4.3 99.6 34.3 354.6 2.2 66.6 6.0
M al e 737 41.5 6.2 125.5 27.7 233.3 3.5 93.5 8.3
p-val ue* <0.001 0.998 <0.001 <0.001 0.140 0.207 <0.001 <0.001 <0.001 Age group
<20 737 38.0 5.7 116.2 31.4 148.7 3.4 86.1 7.8
20-34 690 36.3 5.5 116.9 27.9 246.0 3.0 83.2 7.5
35-49 596 35.0 5.1 113.3 31.9 319.7 2.9 83.3 7.0
≥50 548 36.2 4.8 106.3 34.9 296.6 3.4 85.0 7.2
p-val ue* * <0.001 <0.001 <0.001 0.101 0.175 0.136 0.343 0.958 0.250 BM I
<18.5 569 27.4 4.4 105.9 27.6 228.3 1.9 62.3 6.6
18.5-24.9 678 35.3 5.3 113.8 27.8 260.6 2.9 78.9 7.6
25.0-29.9 649 37.9 5.6 117.6 32.9 252.1 3.3 92.3 7.2
≥30 605 38.7 5.3 118.8 30.0 307.7 2.8 97.9 6.9
p-val ue* * 0.148 <0.001 0.142 0.401 0.451 0.786 0.302 <0.001 0.677 *M ann-W hitney test
**Kruskal-W allis test
Table 3 - Lunch assessment of w orkers enrolled in W FP according to their mean energy intake from macronutrients. Brasília, Brazil, 2000-2001.
Variables % kcal
Protei n Carbohydrate Lipid
Age group
<20 18.0 57.7 22.6
20-34 20.9 51.5 24.7
35-49 22.7 49.1 25.3
≥50 24.0 47.3 26.1
p-val ue* * <0.001 <0.001 0.316 BM I
<18.5 18.6 56.2 23.5
18.5-24.9 20.3 52.2 24.0
25.0-29.9 22.9 47.9 25.6
≥30.0 24.2 45.9 26.7
p-val ue* * <0.001 <0.001 0.144 Gender
Femal e 21.3 49.0 24.9
M al e 21.7 51.3 24.8
p-val ue* <0.001 <0.001 0.154 *M ann-W hitney test
#
Rev Saúde Pública 2005;39(2) www.fsp.usp.br/rsp
Assessment of lunch served in the WFP Savio KEO et al
which is corroborated in the present study. Moreo-ver, Veloso & Santana16 reported that WFP workers
had higher schooling when compared to those who are not enrolled in the program. The study findings showed, in Brasília, a higher proportion of women of higher schooling (78.5%) than men (68.4%). On the other hand, men are usually younger than women. More than 50% of the study population earned more than f ive minimum wages, 63% of women and 37% of men.
Overweight and obesity were more prevalent and evi-dent among men stressing the need of assessing factors, among others, related to their eating pattern. Data showed that 43% had excess weight, 48.1% in men and 35.1% in women. In the last decades, Brazil has also showed increasing prevalence of excess weight. Eating pattern changes and increased physical inactivity has been pointed out as contributing factors. A comparison be-tween the 1974/75 National Study of Familiar Expendi-tures (ENDEF) data with the 1989 National Study on Health and Nutrition (PNSN) data suggest overweight growth among men and women, 58% and 42%
respec-tively, and obesity growth of more than 100% in men and more than 70% in women. It has been evidenced a rapidly increase of obesity in men, though obesity is still more prevalent among women. Excess weight found in the PNSN was 27% in men and 38% in women, 33% in overall overweight.7
The nutritional analysis of lunch by age groups showed a reduction of median intake of some nutri-ents as age increased. In contrast, several adverse so-cial, biological and environmental factors have con-tributed, for instance, to increased protein intake by elder people.
There was also reduced energy intake from carbo-hydrates and proportional increased fat intake as age and BMI increased. This trend could be ex-plained by the fact that increasing life expectancy has paralleled with increased non-transmissible chronic diseases generally associated to inadequate eating habits and high fat intake. The association of diseases and excess weight indicate the need for nutritional prevention to avoid this problem.
Table 5 - Qualitative description of standard lunch menus according food preparation frequency and Food and Nutrition Units size. Brasília, Brazil, 2000-2001.
Food and Nutrition Units size
Food preparation Low M edi um H i gh Total
N % N % N % N %
Sal ads
Cooked vegetables 24 63.1 97 67.8 23 65.7 144 66.7
Raw vegetabl es 14 36.9 46 32.2 12 34.3 72 33.3
Total 38 100 143 100 35 100 216 100
Protein dishes
Beef 7 36.8 44 38.3 13 41.9 64 38.8
Chi cken 8 42.1 38 33.0 11 35.5 57 34.5
Fish – – 16 13.9 4 12.9 20 12.1
Pork 4 21.1 17 14.8 3 9.7 24 14.5
Total 19 100 115 100 31 100 165 100
Preparation mode
Cooked 6 30 42 38.5 11 35.5 59 36.9
Fri ed 7 35 25 22.9 5 16.1 37 23.1
Roasted 3 15 27 24.8 10 32.3 40 25.0
Gri l l ed 4 20 15 13.8 5 16.1 24 15.0
Total 20 100 109 100 31 100 160 100
Side dishes
Pasta 6 42.8 21 43.7 8 57.1 35 46.0
Toasted manioc flour/polenta 4 28.6 21 43.7 4 28.6 29 38.1
Vegetabl es 4 28.6 6 12.6 2 14.3 12 15.9
Total 14 100 48 100 14 100 76 100
D essert
Fruits 14 60.9 48 31.8 16 39.0 78 36.3
Sw eets 9 39.1 103 68.2 25 61.0 137 63.7
Total 23 100 151 100 41 100 215 100
Juices
Artificial 2 66.6 31 83.8 6 75.0 39 81.3
N atural 1 33.4 6 16.2 2 25.0 9 18.7
Total 3 100 37 100 8 100 48 100
Table 4 - Assessment of lunch NDPcal % of workers enrolled in WFP according to Food and Nutrition Units size. Brasília, Brazil, 2000-2001.
N D Pcal % FN U size
Low M edi um H i gh Total
M inimum 14.1 12.7 13.4 13.4
M ean 16.4 16.3 15.2 16.0
95% CI 14.1-18.79 14.24-18.36 13.86-16.54 13.94-18.06
$ Rev Saúde Pública 2005;39(2) www.fsp.usp.br/rsp
Assessment of lunch served in the WFP Savio KEO et al
REFEREN CES
1. Abreu ES. Restaurante “ por quilo” : vale quanto pesa? Uma avaliação do padrão alimentar em restaurantes de Cerqueira César, São Paulo, SP [dissertação]. São Paulo: Faculdade de Saúde Pública da Universidade de São Paulo; 2000.
2. Brasil. Ministério da Saúde. Conselho Nacional de Saúde. Comissão Nacional de Ética em Pesquisa. Resolução 196/96. Brasília (DF); 1966.
3. Freire RBM , Salgado RS. Avaliação de cardápios oferecidos a trabalhadores horistas. Mundo Saúde 1998;22(5):298-301.
High protein content was seen in the workers’ dish composition during lunch. But after assessing WFP menus in São Paulo, Gambardella4 found inadequate
protein and carbohydrate content in relation to total energy intake.
In the present study NDPcal% was calculated based on subject’s actual intake their preference for protein food was evidenced as NDPcal% in all FNUs was above the minimum 6% recommended in WFP. Other studies on NDPcal% were not based on subject’s ac-tual intake but either on intake estimation of the meal to be served, reporting only that calculated percent-ages were over 6% and could be as high as 10.5%.3
The study showed that pasta and meat were most com-monly included in the standard menu of self-service. Carbonated beverages were the first choice of drinking. The 1995-96 Survey on Family Income also showed an increased consumption of non-alcoholic beverages (car-bonated beverages).14 In Brasilia FNUs, artificial juice
was mostly consumed and usually served free.
The regular lunch served in FNUs confirmed rice and beans to be basic food items of Brazilian eating pattern, which corroborates Schieri15 and Mattos and
Martins9 findings. Evidencing a nationwide trend,
pay-by-weight self-service was the form of service found in 50 out of 52 units studied in Brasília.
Basic food, such as rice and beans, are major to fiber intake. This is important because other food served had low content of dietary fibers and raw vegetable salads and vegetable side dishes were also not often consumed. In contrast, pasta and flour-based side dishes were more often served as well as larger amounts of sweets as dessert. The National Study on Family Ex-penditures (ENDEF) had already identified in the 1970’s low fiber intake in the diet of Brazilians living in the capitals Rio de Janeiro, São Paulo, and Porto Alegre.9
According to data from the 1995-96 Survey on
Fam-ily Income,13 there has recently been a significant
increase in protein (beef and chicken) intake because of its low cost. This was also evidenced by the greater availability of such protein food in the study, espe-cially in medium- and large-sized units, most prob-ably due to their increased logistic and purchase ca-pacity. Abreu1 reported that most consumed food in
self-services in São Paulo is meat and pasta, similar to that found in this study.
Based on the study findings and bearing in mind the WFP goals, there is a need for developing actions to help monitoring the WFP impact through nutri-tional profiling of these clientele. The first step was the adoption of the lowest and the highest energy intake for main meals according to the workers’ level of physical activity and occupation.12
This study findings point out to the need of effec-tive food and nutritional education interventions pro-moting redirection of eating preferences and healthier food choices by FNU regulars. The program should strongly stress a more holistic approach where nutri-tional directives would be the starting point for ac-tual education actions to health promotion.
Workers view such programs as a means of pay com-pensation. However, these programs should also be seen as health promoters.
Thus, health promotion strategies to improve qual-ity of life should be encouraged. The Ministry of Health stated in the recent National Program on Food and Nutrition11 the need for further studies on
Brazil-ian eating pattern and, more specifically, on the popu-lation involved in government programs such as WFP.
These populations should be targeted in health promotion strategies. Nutritionists should act as educators and perform their specific tasks, working in FNUs to effectively fulfill their role together with health providers.
4. Gambardella AM D. O programa de alimentação do trabalhador frente às recomendações nutricionais para esse segmento específico da população: área metropolitana de São Paulo [dissertação] São Paulo: Faculdade de Saúde Pública, Universidade de São Paulo; 1990.
%
Rev Saúde Pública 2005;39(2) www.fsp.usp.br/rsp
Assessment of lunch served in the WFP Savio KEO et al
6. Instituto Brasileiro de Geografia e Estatística. Censo demográfico: tabulação avançada do censo demo-gráfico 2000. Resultados preliminares da amostra. Rio de Janeiro; 2002.
7. Instituto Nacional de Alimentação e Nutrição, Instituto de Pesquisa Econômica e Aplicada, Instituto Brasileiro de Geografia e Estatística. Pesquisa Nacional sobre Saúde e Nutrição; 1989. Condições nutricionais da população brasileira: adultos e idosos. Brasília (DF); 1991.
8. Jellife DB. Evaluación del estado de nutrición de la comunidad. Genebra: OMS; 1968. (Série de monografias, 53)
9. Mattos LL, Martins IS. Consumo de fibras alimenta-res em população adulta. Rev Saúde Pública 2000;34:50-5.
10. M azzon JA. Programa de alimentação do trabalha-dor: 25 anos de contribuições ao desenvolvimento do Brasil. São Paulo: Fundação Instituto de Administra-ção da Faculdade de Economia, AdministraAdministra-ção e Contabilidade da Universidade de São Paulo; 2001.
11. Ministério da Saúde. Política nacional de alimenta-ção e nutrialimenta-ção. Brasília (DF); 1999.
12. Ministério do Trabalho e Emprego. Programa de alimentação do trabalhador: legislação. 4º ed. Brasília (DF); 2001.
13. Monteiro CA, Mondini L, Costa RBL. Mudanças na composição e adequação nutricional da dieta familiar nas áreas metropolitanas do Brasil (1988-1996). Rev Saúde Pública 2000;34:251-8.
14. Philippi ST, Szarfarc SC, Latterza AR. Virtual Nutri [programa de computador]. Versão 1.0 for Windows. São Paulo: Faculdade de Saúde Pública da Universi-dade de São Paulo. Departamento de Nutrição; 1996.
15. Sichieri R. Epidemiologia da obesidade. Rio de Janeiro: Editora da Universidade do Rio de Janeiro; 1998. p. 140.
16. Veloso IS, Santana VS. Impacto nutricional do programa do trabalhador no Brasil. Rev Panam Salud Publica 2002;11(1)24-31.