Leticia M S CoutinhoI,II
Marcia ScazufcaII,III
Paulo R MenezesI,II
I Departamento de Medicina Preventiva. Faculdade de Medicina Universidade de São Paulo. São Paulo, SP, Brasil
II Núcleo de Epidemiologia. Hospital Universitário. Universidade de São Paulo. São Paulo, SP, Brasil
III Departamento de Psiquiatria. Faculdade de Medicina Universidade de São Paulo. São Paulo, SP, Brasil
Correspondence: Paulo Rossi Menezes
Departamento de Medicina Preventiva Faculdade de Medicina da Universidade de São Paulo
Av. Dr. Arnaldo 455
01246-903 São Paulo, SP, Brasil E-mail: [email protected]
Received: 11/27/2007 Revised: 5/13/2008 Approved: 6/4/2008
Methods for estimating
prevalence ratios in
cross-sectional studies
ABSTRACT
OBJECTIVE: To empirically compare the Cox, log-binomial, Poisson and logistic regressions to obtain estimates of prevalence ratios (PR) in cross-sectional studies.
METHODS: Data from a population-based cross-sectional epidemiological study (n = 2072) on elderly people in Sao Paulo (Southeastern Brazil), conducted between May 2003 and April 2005, were used. Diagnoses of dementia, possible cases of common mental disorders and self-rated poor health were chosen as outcomes with low, intermediate and high prevalence, respectively. Confounding variables with two or more categories or continuous values were used. Reference values for point and interval estimates of prevalence ratio (PR) were obtained by means of the Mantel-Haenszel stratifi cation method. Adjusted PR estimates were calculated using Cox and Poisson regressions with robust variance, and using log-binomial regression. Crude and adjusted odds ratios (ORs) were obtained using logistic regression.
RESULTS: The point and interval estimates obtained using Cox and Poisson regressions were very similar to those obtained using Mantel-Haenszel stratifi cation, independent of the outcome prevalence and the covariates in the model. The log-binomial model presented convergence diffi culties when the outcome had high prevalence and there was a continuous covariate in the model. Logistic regression produced point and interval estimates that were higher than those obtained using the other methods, particularly when for outcomes with high initial prevalence. If interpreted as PR estimates, the ORs would overestimate the associations for outcomes with low, intermediate and high prevalence by 13%, almost by 100% and fourfold, respectively.
CONCLUSIONS: In analyses of data from cross-sectional studies, the Cox and Poisson models with robust variance are better alternatives than logistic regression is. The log-binomial regression model produces unbiased PR estimates, but may present convergence diffi culties when the outcome is very prevalent and the confounding variable is continuous.
DESCRIPTORS: Cross-Sectional Studies. Estimation Techniques. Prevalence Ratio. Logistic Models. Comparative Study.
INTRODUCTION
ORs do not approximate well to PRs when the initial risk is high, and in these situations, interpreting ORs as if they were PRs may be inadequate.1,2,9,12
Some alternative statistical models that may directly estimate PRs and their confi dence intervals have been discussed in the literature.1,4,6,10,12,14 Cox, log-binomial and Poisson regression models have been suggested as good alternatives for obtaining PR estimates adjusted for confounding variables. Using data adapted from a cross-sectional study, Barros & Hirakata1 (2003) showed that these models yield adjusted PR estimates that are very similar to those obtained by means of the Mantel-Haenszel (MH) method.
The aim of the present study was to empirically compare the Cox, log-binomial, Poisson and logistic regression models with regard to estimating adjusted PRs, comparing their results with those obtained using the MH method.
METHODS
The data used came from a population-based cross-sec-tional study that had the aim of estimating the preva-lence of dementia and other mental health problems among elderly people (aged 65 years or older) who were living in an economically deprived area of the district of Butantã, in the city of Sao Paulo (SP), between May
2003 and April 2005.8 Standardized procedures were
used to assess cognitive functioning and psychiatric symptoms. Information on sociodemographic and socioeconomic characteristics was obtained. A total of 2,072 participants were included in the study.
Three outcomes were chosen: diagnoses of dementia, possible cases of common mental disorders (CMD) and self-rated poor health. Diagnoses of dementia were ob-tained by means of a procedure developed by the 10/66 Dementia Research Group, for use in population-based studies in developing countries, with a detailed assess-ment of the onset and course of deassess-mentia.7 Individuals were classifi ed as possible cases of CMD by means of the Self-Report Questionnaire (SRQ-20), a question-naire developed by the World Health Organization for studies in developing countries.10 The cutoff point used was 4/5, in accordance with the validation of the Brazilian version of the SRQ-20.9 Self-rated health was assessed using a single question (“On the whole, how would you classify your health over the last 30 days?”), with the following answer options: “very good”, “good”, “regular”, “poor” and “very poor”. These were then pooled, in order to classify participants as having self-rated good health (“very good” and “good”) or self-rated poor health (“regular”, “poor” and “very poor”). The three outcomes were chosen based on their prevalence (low for dementia, intermediate for CMD and high for self-rated poor health). Each outcome was associated with one main exposure and two potential
confounding factors. For the outcomes of dementia and CMD, the main exposure was educational level and the confounding variables were age and gender. For self-rated poor health, the main exposure was the presence of depressive episodes, diagnosed in accordance with the ICD-10 criteria for depression, and the confounding variables were income and gender.
In relation to previous studies, we extended the ap-plication of these methods to situations with two con-founding variables (some with more than two levels of exposure or measured as continuous values) in order to verify the point and interval PR estimates generated by each multivariate model. Outcomes of different frequencies were analyzed, in order to examine how, as the prevalence of the outcome increases, the Cox, log-binomial, Poisson and logistic models behave in relation to estimating PRs.
Reference values for the adjusted PR estimates and respective 95% confi dence intervals (95% CI), for the associations between each outcome and the respec-tive main exposure, were obtained by means of the Mantel-Haenszel stratifi cation, while controlling for the effects of the potential confounders. PR estimates with the respective 95% CI were then calculated using the Cox, log-binomial and Poisson regression models, and crude and adjusted ORs (with 95% CI) were also calculated using logistic regression. Next, for each out-come of interest, one confounding variable was tested as a continuous measurement. The Cox and Poisson regressions were performed by setting the follow-up time as one for all participants and using robust vari-ance estimators. The statistical software used for this study was Stata version 9.0.
The Cox regression model is usually used to analyze to-event data. In cross-sectional studies, no time-periods are observed, but if a constant risk period is assigned to all the individuals in the study, the hazard ratio estimated using Cox regression equals the PR, in the same way as with the Poisson regression. However, the use of Cox regression without any adjustment for analyzing cross-sectional studies can also lead to errors in estimating confi dence intervals, which may then be wider than they should be. The robust variance method may also be used in such situations.3
The log-binomial regression model is a generalized linear model in which the link function is the logarithm of the proportion under study and the distribution of the error is binomial. It directly models the prevalence ratio for dichotomous variables. However, there may be a lack of convergence when trying to provide parameter estimates. Normally, this problem is due to Newton’s method, which is used to fi nd a minimum or maximum for this function. This method may be unable to fi nd a maximum likelihood estimate when the solution is at the boundary of the restricted interval for the param-eter. Peterson & Deddens6 (2003) suggested the COPY method (a macro for the SAS software), which may provide an approximate estimates and standard errors
when the Proc Genmod command (generally used in
SAS for binomial distribution with a logarithmic link function) fails to converge.
Logistic regression has been widely used in epidemio-logical studies with binary outcomes to obtain unbiased OR estimates adjusted for one or more confounding variables. It is possible to calculate the PR from the OR estimate, with 95% CI, but the calculations are complex and require computing software to calculate variance
estimates using matrix modules.5
RESULTS
The outcome of dementia (low prevalence: 5.1%) showed statistically significant associations with educational level and age group, but not with gender (Table 1). The risk factor of educational level also showed statistically signifi cant associations with age group (p < 0.01) and gender (p < 0.01). There was some confounding relative to age group in estimating the association between educational level and prevalence of dementia, as shown by the MH stratifi cation (Table 2). Comparing the results from the different models consisting of the main exposure and one confounding variable with four exposure levels, the point estimates and respective 95% CI obtained using the Poisson, Cox and log-binomial models were very close to what was obtained using MH stratifi cation (Table 2), with differ-ences of one or two hundredths (second decimal place). The results observed when an extra potential confound-ing variable (gender) was added to the Cox, Poisson
and log-binomial models produced point estimates of 2 or 3 hundredths (second decimal place) lower than seen in the MH point estimate, and the 95% CI was narrower than the MH confi dence interval. Putting age as a continuous variable produced further adjustment for confounding, and the estimate for the association between educational level and dementia was no longer statistically signifi cant. Logistic regression produced a point estimate approximately 13% higher, with a wider 95% CI than what was obtained with the other regres-sion models, in all situations.
The outcome of CMD (intermediate prevalence: 37.8%) showed statistically signifi cant associations with edu-cational level, gender and age group (Table 1). There was some confounding due to gender and age group in estimating the association between educational level and risk of CMD, as shown by the MH stratifi cation (Table 3). Comparing the results from the different models, both in the situation consisting of the main exposure and one confounding variable (gender) with two exposure levels, and when adding an extra potential confounding variable (age group) with four exposure levels, the point estimates and respective 95% CI ob-tained using the Poisson, Cox and log-binomial models were identical to those obtained using MH stratifi cation (Table 3). When age was taken as a continuous variable, the Cox, Poisson and log-binomial models produced almost identical point estimates and respective 95% CI. Logistic regression produced point estimates almost 100% higher than those obtained using the other regres-sion models, with wider 95% CI.
DISCUSSION
A previous study1 had showed that in cross-sectional
studies, the Cox and Poisson regression models with robust variance and the log-binomial regression model generate adequate estimates for prevalence ratios and their confi dence intervals, regardless of the base
prevalence. In a recent study on this question, Peter-son & Deddens6 (2008) advocated, based on real and simulated data, that the Poisson regression gave better PR estimates for very frequent outcomes, in relation to the log-binomial regression model. However, these authors suggested that log-binomial regression would be the best method for intermediate prevalence.
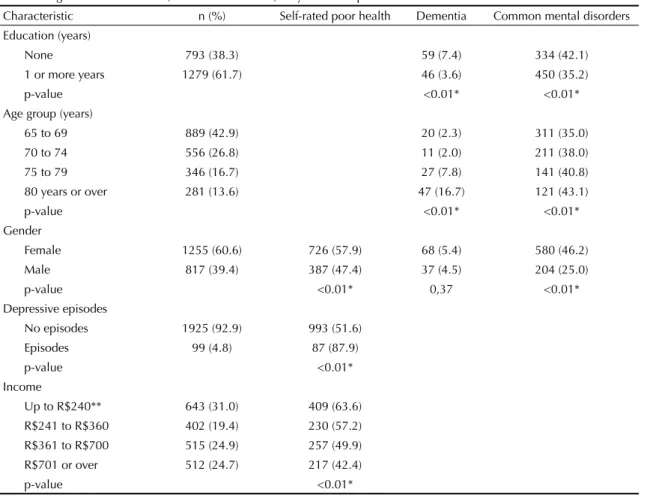
Table 1. Prevalence of self-rated poor health, dementia and common mental disorders according to the main exposure and confounding variables. São Paulo, Southeastern Brazil, May 2003 to April 2005.
Characteristic n (%) Self-rated poor health Dementia Common mental disorders
Education (years)
None 793 (38.3) 59 (7.4) 334 (42.1)
1 or more years 1279 (61.7) 46 (3.6) 450 (35.2)
p-value <0.01* <0.01*
Age group (years)
65 to 69 889 (42.9) 20 (2.3) 311 (35.0)
70 to 74 556 (26.8) 11 (2.0) 211 (38.0)
75 to 79 346 (16.7) 27 (7.8) 141 (40.8)
80 years or over 281 (13.6) 47 (16.7) 121 (43.1)
p-value <0.01* <0.01*
Gender
Female 1255 (60.6) 726 (57.9) 68 (5.4) 580 (46.2)
Male 817 (39.4) 387 (47.4) 37 (4.5) 204 (25.0)
p-value <0.01* 0,37 <0.01*
Depressive episodes
No episodes 1925 (92.9) 993 (51.6)
Episodes 99 (4.8) 87 (87.9)
p-value <0.01*
Income
Up to R$240** 643 (31.0) 409 (63.6)
R$241 to R$360 402 (19.4) 230 (57.2)
R$361 to R$700 515 (24.9) 257 (49.9)
R$701 or over 512 (24.7) 217 (42.4)
p-value <0.01*
Differences between the groups were assessed using chi-squared tests. * Signifi cant difference between the groups: p < 0.05.
** 1 US dollar = R$ 2.86.
Table 2. Prevalence ratio estimates and 95% confi dence intervals (95% CI) for the association between educational level and dementia, controlling for age group, age group and gender, and age and gender, using Mantel-Haenszel stratifi cation, Cox, Poisson, log-binomial and logistic regression models. São Paulo, Southeastern Brazil, May 2003 to April 2005.
Model
(Dementia, educational level and age group)
(Dementia, educational level and age group) + gender
(Dementia, educational level and age (continuous)) + gender Point
estimates 95% CI Point estimates 95% CI Point estimates 95% CI
Pr mantel-haenszel 1.47 1.01;2.15 1.50 1.02;2.19 -
-Pr robust cox 1.47 1.01;2.13 1.46 1.01;2.12 1.43 0.98;2.09
Pr robust poisson 1.47 1.01;2.13 1.46 1.01;2.12 1.43 0.98;2.09
Pr log-binomial 1.48 1.02;2.15 1.47 1.01;2.13 1.43 0.97;2.10
Or logistic regression 1.53 1.01;2.30 1.52 1.00;2.29 1.49 0.98;2.25
We explored the performance of these methods in rela-tion to different prevalences of outcomes of interest, more than one confounding variable and continuous covariates. We showed that the three methods generated correct point and interval estimates in all situations, although the log-binomial models presented conver-gence diffi culty in situations of very prevalent outcomes and continuous covariates. For the three outcomes investigated, the Cox and Poisson regression models presented identical PR estimates and 95% CI estimates, and they were very similar to those obtained using our reference (MH stratifi cation). The use of robust methods for variance estimation in the Cox and Poisson models corrected for the overestimation of the variance and produced adequate confi dence intervals. The Cox and Poisson models also behaved well in relation to continuous covariates.
The log-binomial regression models also behaved well in most of the situations tested, yielding point and in-terval estimates that were close to those obtained using MH stratifi cation. However, when the prevalence of the outcome was high, the log-binomial model produced
estimates closer to one than were those obtained using MH stratifi cation or using Cox and Poisson regression. Moreover, when one of the covariates was continuous, the log-binomial model presented convergence diffi cul-ties, as previously described.1,6
The OR estimates obtained using the logistic regres-sion models were close to the PR estimates when the outcome prevalence was low (dementia), although even then there was a tendency for the OR to be higher than the PR. In the situation of intermediate prevalence (CMD), the OR was almost twice the PR. In other words, if the OR were interpreted as a PR, it would seem that the relative increase in the risk of CMD for individuals with lower educational level was 23% higher than the risk for those with better educational level, instead of 12% higher, as shown by the PR. The ORs obtained when the prevalence was high (self-rated poor health) were four times higher than the PR estimates obtained using MH stratifi cation or using the Cox, Poisson and log-binomial models. This shows the inappropriateness of interpreting OR estimates as if they were PR estimates in these situations.
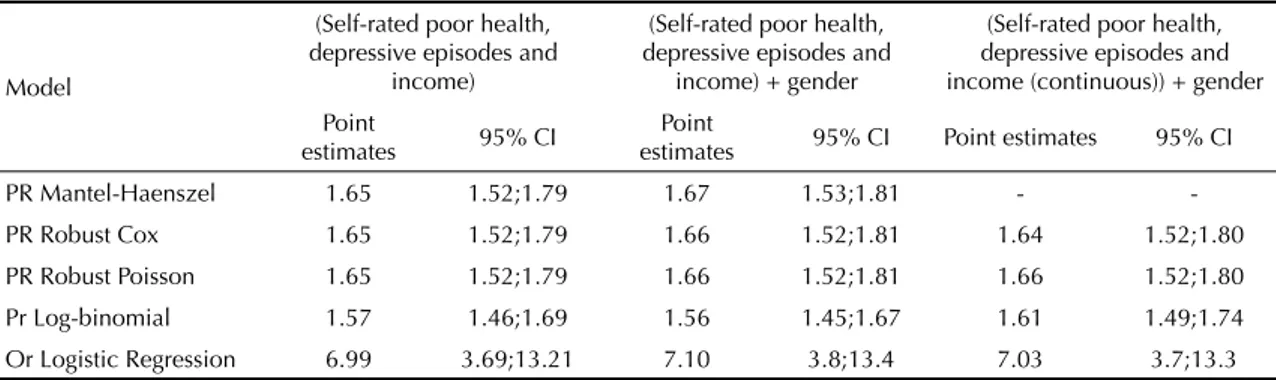
Table 4. Prevalence ratio estimates and 95% confi dence intervals (95% CI) for the association between depressive episodes and self-rated poor health, controlling for income level, income level and gender, and income and gender, using MH stratifi cation, Cox, Poisson, log-binomial and logistic regression models. São Paulo, Southeastern Brazil, May 2003 to April 2005.
Model
(Self-rated poor health, depressive episodes and
income)
(Self-rated poor health, depressive episodes and
income) + gender
(Self-rated poor health, depressive episodes and income (continuous)) + gender Point
estimates 95% CI
Point
estimates 95% CI Point estimates 95% CI
PR Mantel-Haenszel 1.65 1.52;1.79 1.67 1.53;1.81 -
-PR Robust Cox 1.65 1.52;1.79 1.66 1.52;1.81 1.64 1.52;1.80
PR Robust Poisson 1.65 1.52;1.79 1.66 1.52;1.81 1.66 1.52;1.80
Pr Log-binomial 1.57 1.46;1.69 1.56 1.45;1.67 1.61 1.49;1.74
Or Logistic Regression 6.99 3.69;13.21 7.10 3.8;13.4 7.03 3.7;13.3
Crude estimate: 1.72 (95% CI: 1.58 – 1.87). PR – prevalence ratio
Table 3. Prevalence ratio estimates and 95% confi dence intervals (95% CI) for the association between educational level and common mental disorders (CMD), controlling for gender, gender and age group, and gender and age, using MH stratifi cation, Cox, Poisson, log-binomial and logistic regression models. São Paulo, Southeastern Brazil, May 2003 to April 2005.
Model
(CMD, educational level and gender)
(CMD, educational level and gender) + age group
(CMD, educational level and gender) + age (continuous)
Point
estimates 95% CI
Point
estimates 95% CI
Point
estimates 95% CI
Pr mantel-haenszel 1.16 1.04;1.29 1.12 1.01;1.25 -
-Pr robust cox 1.16 1.04;1.29 1.12 1.01;1.25 1.12 1.01;1.25
Pr robust poisson 1.16 1.04;1.29 1.12 1.01;1.25 1.12 1.01;1.25
Pr log-binomial 1.16 1.04;1.29 1.12 1.01;1.25 1.12 1.00;1.24
Or logistic regression 1.30 1.07;1.57 1.23 1.01;1.49 1.22 1.00;1.48
1. Barros AJ, Hirakata VN. Alternatives for logistic regression in cross-sectional studies: an empirical comparison of models that directly estimate the
prevalence ratio. BMC Med Res Methodol. 2003;3:21.
DOI: 10.1186/1471-2288-3-21
2. Davies HT, Crombie IK, Tavakoli M. When can odds
ratios mislead? BMJ. 1998;316(7136):989-991.
3. Lin DY, Wei LJ. The robust Inference for the Cox
Proportional Hazards Model. J Am Stat Assoc.
1989;84(408):1074-8. DOI: 10.2307/2290085
4. McNutt LA, Wu C, Xue X, Hafner JP. Estimating the relative risk in cohort studies and clinical
trials of common outcomes. Am J Epidemiol.
2003;157(10):940-3. DOI: 10.1093/aje/kwg074
5. Oliveira NF, Santana VS, Lopes AA. Razões de proporções e uso do método delta para intervalos de
confi ança em regressão logística. Rev Saude Publica.
1997;31(1):90-9.
6. Petersen MR, Deddens JA. A comparison of two
methods for estimating prevalence ratios. BMC Med
Res Methodol. 2008;8:9. DOI: 10.1186/1471-2288-8-9
7. Prince M, Acosta D, Chiu H, Scazufca M, Varghese M, Dementia diagnosis in developing countries: a
cross-cultural validation study. Lancet.
2003;361(9361):909-17. DOI: 10.1016/S0140-6736(03)12772-9
8. Scazufca M, Menezes PR, Vallada HP, Crepaldi AL, Pastor-Valero M, Coutinho LMS, et al. High prevalence of dementia among older adults from poor
socioeconomic backgrounds in São Paulo, Brazil. Int
Psychogeriatrics. 2008;20(2):394-405. DOI: 10.1017/ S1041610207005625
9. Scazufca M, Menezes PR, Vallada H, Araya R. Validity of the self reporting questionnaire-20 in
epidemiological studies with older adults. Soc
Psychiatry Psychiatr Epidemiol. 2008; Sep 8. [Epub ahead of print].
10. Thompson ML, Myers JE, Kriebel D. Prevalence odds ratio or prevalence ratio in the analysis of cross
sectional data: what is to be done? Occup Environ
Med. 1998;55(4):272-7.
11. World Health Organization. A user’s guide to the Self-Reporting Questionnaire (SRQ). Geneva; 1994.
12. Zhang J, Yu KF. What’s the relative risk? A method of correcting the odds ratio in cohort studies of common
outcomes. JAMA. 1998;280(19):1690-1. DOI:
10.1001/jama.280.19.1690
13. Zocchetti C, Consonni D, Bertazzi PA. Relationship between prevalence rate ratios and odds ratios
in cross-sectional studies. Int J Epidemiol.
1997;26(1):220-3. DOI: 10.1093/ije/26.1.220
14. Zou G. A modifi ed poisson regression approach to
prospective studies with binary data. Am J Epidemiol.
2004;159(7):702-6. DOI: 10.1093/aje/kwh090
REFERENCES
Study funded by Wellcome Trust, UK.
Menezes PR and Scazufca M were partially funded by Conselho Nacional de Desenvolvimento Científi co e Tecnológico (CNPq; research productivity bursaries).
Article based on the master’s dissertation of LMS Coutinho, which was presented within the Postgraduate Sciences Program of the School of Medicine of the Universidade de São Paulo, in 2007.
The present study has some limitations. The associations in the three situations examined were not strong, thus making the estimates obtained using the various methods tested close to each other. Furthermore, the confounding effects were not pronounced, apart from the effect of age