Impact of the Demographic and
Educational Structure on Health
Outcomes: A Prospective Analysis for
the Portuguese Population
Maria Rosário Oliveira Martins, Inês Rodrigues and
Teresa Rodrigues
Introduction
The analysis of the recent demographic development of the Portuguese population reveals a marked change in its age structure, with a distinct aging process, resulting both from decreased levels of fertility and a progressive decrease in mortality levels, in both genders and in all age groups. Additionally, the contribution of migration to population growth and reproduction has substantially decreased, being now insufficient to ensure population growth and to counteract the aging, process. As a consequence, natural increase diminishes (Statistics Portugal, Demographic Indicators) and the population is increasingly aging. Between 1992 and 2011, the number of people aged 65 years and more increased by approximately 42%, accounting for 19.1% of the total population at the end of the period. It is clearly above the EU-27 average (17.5%) and only exceeded by Germany (20.6%), Italy (20.3%) and Greece (19.3%)1
. At the same time, the proportion of individuals who complete all higher levels of education rise in both genders and in all age-groups2
. Demographic ageing is a major challenge for political decision makers, due to its inevitable impact on social support, health care and the labor market. The population’s ageing changes its pattern of health status.
1 Eurostat, 2013.
In fact, among different structural, behavioural and psychosocial factors, age is associated with health status. Orfila, Ferrer, Lamarca and Alonso (2000)3
suggest that, in addition to an augmented death probability, increased age is also linked to a decline of self-reported health status. However, the same study also shows that the association between age and declining health status loses its significance when comorbidities are considered, suggesting that this decline is not due to chronological age in itself.
Education is a frequently studied socio-structural determinant of health4
, together with gender, income, occupation or marital status5
. Accounting for the combined influence of gender, age and education on the population’s health, the prospective study is an important contribution for informed health policies and health promotion. If, ageing individuals report a worsening health status but improved levels of education lead to better health status6
, the effects of these two processes on the population’s health might, to a greater or lesser extent, counterbalance each other.
The objective of this work was to produce projections for a set of indicators on health status and the Portuguese population’s use of health services for the period
3 Francesc Orfila, Montserrat Ferrer, Rosa Lamarca and Jordi Alonso, “Evolution of
self-rated health status in the elderly: Cross-sectional vs. longitudinal estimates”, Journal of Clinical
Epidemiology,53(2000), 563-570.
4 Adriënne E. J. M. Cavelaars, Anton E. Kunst, José J. M. Geurts, Roberta Crialesi, Liv
Grötvedt, Uwe Helmert, Eero Lahelma, Olle Lundberg, Jil Matheson, Andreas Mielck, Andreé Mizrahi, Arié Mizrahi, Niels Kr Rasmussen, Enrique Regidor, Thomas Spuhler, Johan P.
Mackenbach, “Differences in self-reported morbidity by educational level: a comparison of 11
Western European countries”, Journal of Epidemiology & Community Health, 52 (1998), 219-227; David M. Cutler and Adriana Lleras-Muney, “Education and Health: Evaluating Theories and
Evidence”, National Bureau of Economic Research Working Paper No. 12352 (Cambridge, MA,
USA, 2006); Filipa Castro Henriques, Teresa Ferreira Rodrigues and Maria Fraga O. Martins,
“Ageing, Education and Health in Portugal: Prospective from the 19th to the 21st Century”, Hygiea
Internationalis, 8: 1 (2009), 81–96; Giorgio Brunello, Margherita Fort, Nicole Schneeweis and
Rudolf Winter-Ebmer, “The Causal Effect of Education on Health: What is the Role of Health
Behaviors”, IZA Discussion Paper No. 5944 (Bonn, Germany, 2011).
5 Margaret Denton, Steven Prus and Vivienne Walters, “Gender differences in health: a
Canadian study of the psychosocial, structural and behavioural determinants of health”, Social
Science & Medicine, 58 (2004), 2585–2600.
6 Inez M.A. Joung , Anton E. Kunst, Evert van Imhoff and Johan P. Mackenbach,
“Education, aging, and health: to what extent can the rise in educational level relieve the future
health care burden associated with population aging in the Netherlands?” Journal of Clinical
Epidemiology, 53(2000), 955-963; Martijn Huisman, Anton E. Kunst and Johan P. Mackenbach,
“Socioeconomic inequalities in morbidity among the elderly; a European overview”, Social Science
& Medicine, 57 (2003), 861–873; Filipa Castro Henriques and Teresa Ferreira Rodrigues, “Essay on
Ageing and Health projections in Portugal”. Item 3 – Challenges and use of population projections
(2010). Joint Eurostat/UNECE Work Session on Demographic Projections (28-30 April 2010,
2011-2031, considering the expected changes in population structure by gender, age group and educational attainment.
Methods
This study consists of three main parts: (1) demographic projections by gender, age group and educational level, for the Portuguese population, for the period 2011-2031, (2) a study of the impact of age and education on the indicators of health status and health services utilization, and (3) the subsequent projection of these outcomes for the same period.
Demographic projections by gender, age group and educational level
A multistate demographic model 7
was used to produce demographic projections by gender, age group and educational attainment, at the national level, using discrete matrix equations8
. Each group of the population (by gender and age group) was divided into four categories according to the highest level of education completed:
1. No education/Primary Education: includes those who have not completed any formal education and those who have only completed the first cycle of basic education (first four year of schooling) or the second cycle (six years) of primary education;
2. Lower Secondary Education: includes those who completed all nine years of the lower secondary education;
3. Upper Secondary Education: includes those who completed the 12th year of education;
4. Higher Education: comprises those who completed some academic courses, achieving, at least, a degree of Bacharel (Bachelor) or Licenciado (Graduated). The model is based on the cohort component methodology adapted to a multidimensional population, assuming that the passage across levels of education can be described by a Markov process with finite state space and that the rates that
7 Frans Willekens, Description of the multistate projection model (Multistate model for
biographic analysis and projection). Deliverable D1 in Work Package 1. Bridging the micro-macro
gap in population forecasting – MicMac Project. Netherlands Interdisciplinary Demographic
Institute. (The Hague,The Netherlands, 2006).
8 Robert Schoen, “Population Models With Constant Rates” pp. 1–26 in Dynamic
Population Models. The Springer Series on Demographic Methods and Population Analysis
drive the population dynamics remain constant across each five-year projection period. Besides the estimation of transition probabilities between levels of education, by gender and age group, it was also needed to consider the existence of differentials regarding fertility, mortality and migration, by level of education. For this purpose, data from the 2001 and 2011 censuses, national projections produced by Statistics Portugal (Instituto Nacional de Estatística (INE), I.P.), the Labour Force Survey (INE, I.P.) and the 2010 Revision of the World Population Prospects (United Nations) were all used in order to estimate the necessary parameters.
The age- and education-specific survival ratios, fertility rates and transition probabilities estimates were disposed into a block Leslie matrix. This matrix was, together with a vector for net migration, used to estimate the number of individuals from each gender, age group and education level, by the end of each five-year projection period.
Two scenarios were considered, one where educational attainment prior to 2011 remains constant and another in which educational attainment will follow the trend observed over the last decade, being the trend in the state proportion modeled using continuation ratio models.
Impact of age and education on health status and health services utilization
The study of current differences in health status and health services utilization by age and educational level was based on the data from the fourth edition of the National Health Survey (4th NHS), a representative survey of the Portuguese population, planned and conducted by the Statistics Portugal and the National Institute of Health Dr. Ricardo Jorge (INSA), in collaboration with the Directorate-General of Health. The 4th NHS collected information on health status, health determinants, use of health services and sociodemographic characteristics of individuals, being the first edition to cover the entire national territory, including the Autonomous Regions of Azores and Madeira. The questionnaire was administered by direct interviews of a representative probability sample of the Portuguese population, between February 2005 and February 2006. The study population included individuals living in family housing units (therefore excluding people living in collective accommodations). A total of 41,193 individuals living in 15,239 family housing units were interviewed with a nationwide completion rate of 76%.
last three months and the use of prescribed medicines in the two weeks preceding the survey.
To study the differences in health status and health services utilization by age and educational level, logistic regression models 9
were separately estimated for each gender. Dummy variables referring to five-year age groups and levels of education were used as explanatory variables. Only individuals aged over 15 years were considered, since only cases when the answers were given by the respondent himself, and since the educational level cannot have a great impact on the health status and the use of health services among children. The same four categories were considered for educational attainment: No education/Primary; Lower Secondary; Upper Secondary and Higher Education. Both for the variables corresponding to age and to educational level, we used a deviation coding scheme, in which the effect of each class is compared with the average of all groups10
.
Projection of indicators of health status and health services utilization
In order to analyze the influence of education on the health status and the use of health services in the Portuguese population, results from the projections under the constant versus trend scenarios were compared.
We also considered two projection scenarios on the differences in health status and utilization of health services by level of education: a stable scenario, where it is assumed that the estimated differences based on the fourth edition of the NHS will remain constant throughout the period projection, and a variable scenario, in which these differences follow the changes observed between different editions of the NHS. To study the evolution of the differences over time, tests for structural change of the regression models were performed, considering the second and fourth editions of the NHS (conducted in 1995/1996 and 2005/2006, respectively). In cases where the variation in the impact of education was statistically significant, the corresponding coefficient at the start of the projection period (estimated using the most recent NHS) was multiplied by the same factor, to obtain the magnitude of differences observed 10 years later. Since the sample from the 1995/1996 edition of the NHS is only representative of the population from mainland Portugal, only these regions were considered in such calculations. Furthermore, due to the absence of data
9 David W. Hosmer and Stanley Lemeshow, Applied Logistic Regression (New Jersey, John
Wiley & Sons, 2004); Inez M.A. Joung , Anton E. Kunst, Evert van Imhoff and Johan P.
Mackenbach, “Education, aging, and health: to what extent can the rise in educational level relieve
the future health care burden associated with population aging in the Netherlands?” Journal of
Clinical Epidemiology, 53 (2000), 955-963.
10 Joseph F. Hair, Ralph E. Anderson, Ronald L. Tatham and William C. Black.
concerning the consumption of prescribed medicines in the two weeks preceding the survey on the 1995/1996 edition, the multiplication factors estimated for the existence of at least one medical consultation in the last three months were used.
The expected proportions of individuals in each category of the dependent variables, for each gender, age group and educational level, were applied to the estimated number of individuals in each of the strata defined by gender, age group and educational level, obtained from the demographic projections previously described.
Software
The methodology for producing the demographic projections was executed with Microsoft Office Excel 2010. The R software (version 2.13.1) was used to construct the necessary life tables, through the Life Tables library, and to model the trend for the schooling levels of the Portuguese population (VGAM library).
In the last two tasks, logistic regression models were fitted using IBM SPSS Statistics 19 software and Microsoft Office Excel 2010 was used to compute the estimates for proportions of ill-health and use of health services.
Results
The Portuguese population by gender, age and educational attainment
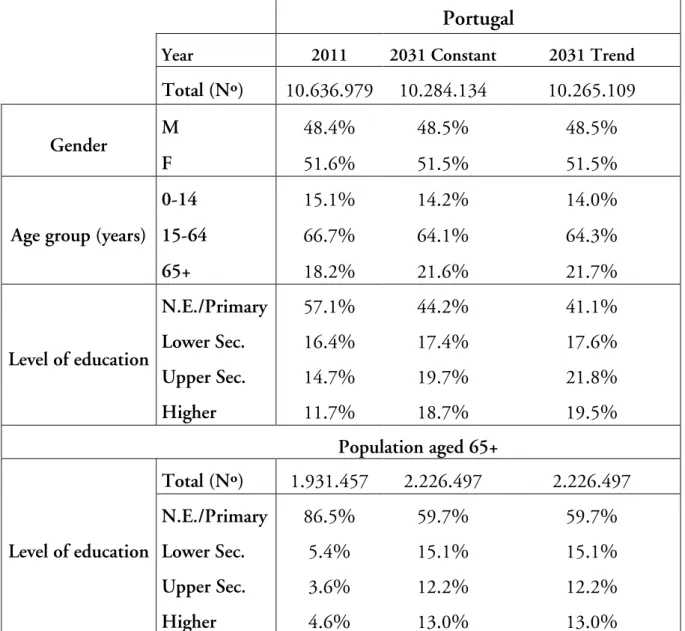
Concerning the results of demographic projections by educational attainment between the years 2011 and 2031, we can in both scenarios expect a decrease in the total number of residents in Portugal, from 10,636,979 to 10,284,134 inhabitants in the constant scenario or to 10,265,109 in the trend scenario. The age structure of the population is expected to change significantly, in relation to the baseline year: the proportion of individuals above 65 years is expected to increase to approximately 22%, while the proportion of children and young people under 15 years is projected to be slightly above 14%, by 2031.
Health improvements should be evident in the age group 15 to 64 years (figure 1), caused by the reduced proportion of those who did not complete the lower secondary level - from 39.4% in 2011 to approximately 25% by 2031 (26.65% under the constant scenario and 22.03% in the trend scenario).The percentage of individuals who have a ‘higher education course’ in the same group is also expected to rise from 16.4%. In the same figure, we see an increase in the total number of people aged 65 or over, together with a clear change in its educational structure: by 2031, 40.3% of individuals in this group should have completed at least lower secondary education, i.e. a rise of 26.8 percentage points compared to since 2011, whilst the percentage of people with higher education in 2011, is expected to increase from 4.6% to 13.04% by 2031 in both scenarios.
Table 1. Population structure by gender, age group and level of education, 2011 and 2031, by scenario
Portugal
Year 2011 2031 Constant 2031 Trend
Total (Nº) 10.636.979 10.284.134 10.265.109
Gender M 48.4% 48.5% 48.5%
F 51.6% 51.5% 51.5%
Age group (years)
0-14 15.1% 14.2% 14.0%
15-64 66.7% 64.1% 64.3%
65+ 18.2% 21.6% 21.7%
Level of education
N.E./Primary 57.1% 44.2% 41.1%
Lower Sec. 16.4% 17.4% 17.6%
Upper Sec. 14.7% 19.7% 21.8%
Higher 11.7% 18.7% 19.5%
Population aged 65+
Level of education
Total (Nº) 1.931.457 2.226.497 2.226.497
N.E./Primary 86.5% 59.7% 59.7%
Lower Sec. 5.4% 15.1% 15.1%
Upper Sec. 3.6% 12.2% 12.2%
Figure 1. Number of people aged 15-64 (left) and 65+ (right), by level of education, 2011-2031, Trend scenario
Source: Authors' calculations.
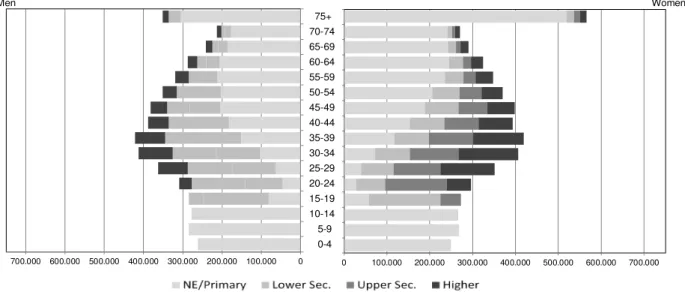
Figure 2. Portuguese population by gender, age group, and level of education, January 1st, 2011
Source: Statistics Portugal, annual Estimates of the Resident Population and authors' calculations.
The distribution of residents by all three variables – gender, age group and educational level – can be analyzed through the construction of multistate population pyramids. The comparison between the observed population structure in 2011 and that estimated for 2031 (figures 2, 3 and 4) indicates that the proportion of individuals who complete higher levels of education should increase in all age groups of both sexes, according to any of the scenarios.
2011
0 100.000 200.000 300.000 400.000 500.000 600.000 700.000
Women
0 100.000 200.000 300.000 400.000 500.000 600.000 700.000
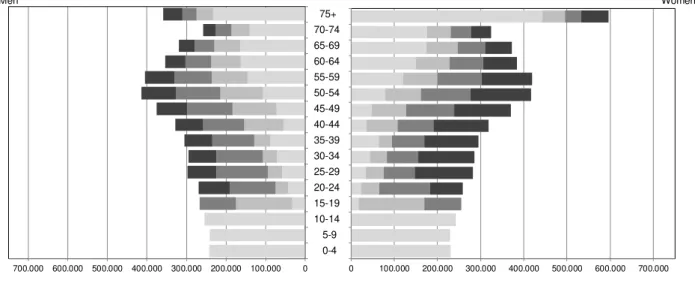
Figure 3. Portuguese population by gender, age group, and level of education, January 1st, 2031: Constant Scenario
Source: Authors' calculations.
Figure 4. Portuguese population by gender, age group, and level of education, January 1st, 2031: Trend Scenario
Source: Authors' calculations.
In all age groups, the percentage of men who never completed lower secondary education was slightly higher than for women (57.2% of men and 57% of women) in 2011, a situation that remains throughout the projection period, with 42.4% of men without completed lower secondary education, against 39.95% of women (trend scenario) by 2031. Among women, 13.6% had completed some level of higher education in 2011, a figure that is expected to approximately 23.4% by 2031, whereas among men this figure was only 9.7% in 2011 and should rise to 15.5% by 2031. Since the educational level of younger cohorts seems to continue to evolve positively,
0 100.000 200.000 300.000 400.000 500.000 600.000 700.000
Women 0 100.000 200.000 300.000 400.000 500.000 600.000 700.000 0-4 5-9 10-14 15-19 20-24 25-29 30-34 35-39 40-44 45-49 50-54 55-59 60-64 65-69 70-74 75+ Men
0 100.000 200.000 300.000 400.000 500.000 600.000 700.000
the transition to a higher level of education in the population becomes irreversible, and the proportion of elderly people with higher levels of education will continue to increase.
Health status and health services utilization, 2011-2031
Table 2. Adjusted odds ratios from logistic regressions on health factors
Gender Level of education
Health status (“fair”, “bad” or “very bad”)a
Chronic diseases
(≥1)b
Long term disabilities
(≥1)c
Medical consultations
(≥1)d
Use of prescribed medicinese
OR p OR p OR p OR p OR p
Male
NE/Primar
y 2,09** 0,00 1,19** 0,00 1,77** 0,00 0,82** 0,00 0,97 0,34
Lower Sec. 1,09 0,11 0,92 0,13 1,07 0,66 0,96 0,43 0,97 0,59
Upper Sec. 0,79** 0,00 0,86** 0,01 0,81 0,24 1,00 0,97 0,95 0,34
Higher 0,55** 0,00 1,06 0,38 0,65** 0,03 1,26** 0,00 1,12* 0,07
Female
NE/Primar
y 2,16** 0,00 1,21** 0,00 1,63** 0,00 0,94** 0,00 1,10** 0,02
Lower Sec. 1,16** 0,00 0,97 0,52 0,83 0,14 0,91** 0,03 0,91** 0,04
Upper Sec. 0,86** 0,00 0,91** 0,05 1,06 0,67 1,00 0,96 1,03 0,55
Higher 0,47** 0,00 0,93 0,17 0,70** 0,01 1,17** 0,00 0,97 0,55
a
n = 23839; b
n = 23840; c
n = 23840; d
n = 23831; e
n = 23837 ** p ≤ 0,05; * p≤ 0,10
Source: Authors' calculations.
The results from the logistic regression models based on data from the 4th NHS (table 2) suggest that the effect of education (adjusted for age) is observed mainly on the self-perception of health status, among both men and women. Generally, individuals who have completed higher education tend to classify their health status more positively, in relation to the entire population, and those who did not complete lower secondary education tend report worse figures. For the remaining indicators, the effect of education doesn’t seem to be so obvious.
of prescribed medicines seems to be more associated with educational levels among women than among men.
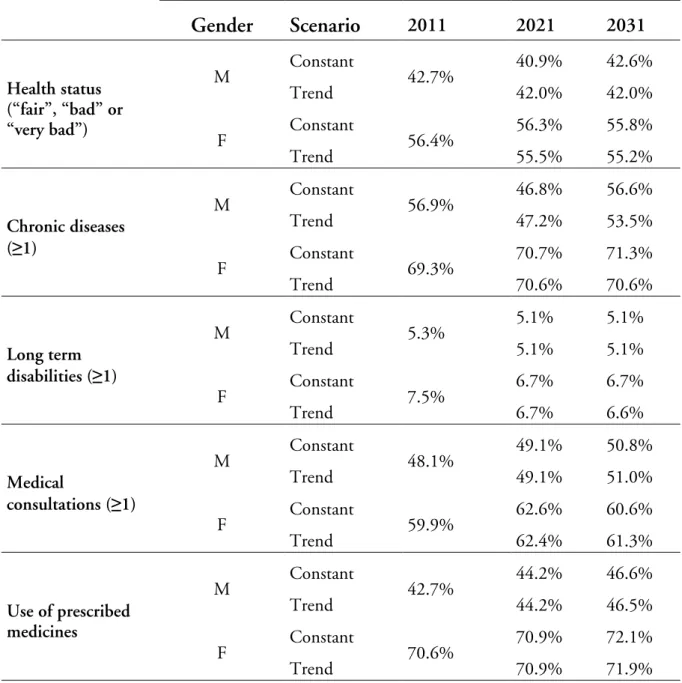
Table 3. Projected prevalence for each health indicator, by gender, 2011-2031, Portugal, Variable scenario
Gender Scenario 2011 2021 2031
Health status (“fair”, “bad” or “very bad”)
M Constant 42.7% 40.9% 42.6%
Trend 42.0% 42.0%
F Constant 56.4% 56.3% 55.8%
Trend 55.5% 55.2%
Chronic diseases (≥1)
M Constant 56.9% 46.8% 56.6%
Trend 47.2% 53.5%
F Constant 69.3% 70.7% 71.3%
Trend 70.6% 70.6%
Long term disabilities (≥1)
M Constant 5.3% 5.1% 5.1%
Trend 5.1% 5.1%
F Constant 7.5% 6.7% 6.7%
Trend 6.7% 6.6%
Medical
consultations (≥1)
M Constant 48.1% 49.1% 50.8%
Trend 49.1% 51.0%
F Constant 59.9% 62.6% 60.6%
Trend 62.4% 61.3%
Use of prescribed medicines
M Constant 42.7% 44.2% 46.6%
Trend 44.2% 46.5%
F Constant 70.6% 70.9% 72.1%
Trend 70.9% 71.9%
Source: Authors' calculations.
Figure 5. Projected prevalence for each health indicator, men (left) and women (right), 2011-2031, Portugal, Trend and Variable scenario
Source: Authors' calculations.
The major differences between the two scenarios are actually found for the presence of chronic diseases among both men and women. The proportion of individuals who classify their health status negatively, having some chronic disease or long-term disability, will continue to be considerably higher among women than among men. Gender differences are also reflected in the use of health services. Hence, the female dominance is particularly evident with regard to the use of prescribed medicines and the prevalence of chronic diseases. Figure 5 shows exactly these differences between men and women, considering the trend scenario for education.
Discussion
Demographic projections for the period 2011-2031 have been made for the Portuguese population by sex, age group and level of educational attainment. The multistate projection model was used in order to cover dynamics inherent to demographic behaviour. Besides the estimation of transition probabilities between levels of education, by gender and age group, it was also needed to consider the differentials regarding fertility, mortality and migration, by level of education. We established two scenarios, a constant and a trend scenario.
These demographic projections provided the basis for projecting the expected changes on the population health status and health care utilization. We found that the expected self-reported health status is the indicator that has the more obvious improvement, with an increase in the proportion of residents who rate their health as “fair”, “good" or “very good”, according to all scenarios and for both genders. This is also one of the indicators for which increasing levels of education (trend scenario) seem to have a greater impact, when compared to their maintenance (constant scenario). The same is true also, and even more obvious, to regarding the presence of
0,0% 10,0% 20,0% 30,0% 40,0% 50,0% 60,0% 70,0% 80,0% Health status (“fair”, “bad” or “very bad”)
Chronic
diseases (≥1) disabilities (≥1)Long term consultations Medical
(≥1) Use of prescribed medicines 0,0% 10,0% 20,0% 30,0% 40,0% 50,0% 60,0% 70,0% 80,0% Health status (“fair”, “bad” or “very bad”)
Chronic
diseases (≥1) disabilities (≥1)Long term consultations Medical
(≥1)
chronic diseases in both genders. We can consider this impact to be solidly positive, since the trend scenario results in lower prevalence of both individuals who classify their health status negatively as well as of those suffering from chronic diseases.
We may assume that, if increased longevity is accompanied by an increase in the number of years lived in good health, aging may not necessarily translate into the same growth of health expenditure. Improved health status will, in principle, be reflected in a lower use of health services and can consequently lead to lower health expenditure11
. Our results also indicate a future improvement in health status (particularly in self-reported health status and in the prevalence of long-term disabilities) due to a rising level of education in future generations, however, for the same reason a more extensive use of health services (medical consultations and use of prescribed medicines). In fact, as discussed by Frie, Eikemo and von dem Knesebeck (2010)12
, there is a positive association between having more years of education and the frequency to consult a doctor. Therefore, we might question whether, in the coming decades, the increased use of health services can lead to better health status, and lead to lower expenditure with health services.
Projecting the health status of a population is a complex and challenging task, given the difficulties associated with the estimation of changes in morbidity and* the measurement of health13
. The presented projections follow a “what if” approach, through the definition of different scenarios for the trends of educational levels and the differences between these levels in relation to health status and use of health services. Thus, the uncertainties are evident. Nevertheless, these projections are points of departure when estimating and getting prepared for the future impact of aging and education on the population’s health status, influencing the main demand for health services. These scenarios will have an impact upon health organization and health expenditures, the two major considerations for political and administrative decision making in the field of public health.
Maria Rosário O. Martins is a Full Professor at Instituto de Higiene e Medicina Tropical, Universidade NOVA de Lisboa, Portugal. She is researcher at UPMM- Unidade de Parasitologia e Microbiologia Médicas.
11 Bernd Rechel, Yvonne Doyle, Emily Grundy and Martin McKee, How can health systems
respond to population ageing? (Copenhagen, World Health Organization, Regional Office for
Europe, 2009); European Commission, The 2012 Ageing Report: Economic and budgetary projections
for the 27 EU Member States (2010–2060). European Economy, 2/2012 (Brussels, 2012).
12 Kirstin Grosse Frie, Terje Andreas Eikemo and Olaf von dem Knesebeck, “Education
and self-reported health care seeking behaviour in European welfare regimes: results from the European Social Survey”, International Journal of Public Health, 55 (2010), 217–220.
13 European Commission, The 2012 Ageing Report: Economic and budgetary projections
Inês Rodrigues is researcher at CEPESE - Centro de Estudos da População, Economia e Sociedade, Universidade do Porto.
Teresa Rodrigues is Professor of International Relations at the Department of Political Studies, Universidade NOVA de Lisboa, Portugal. She is a member of the board of IPRI - Instituto Português de Relações Internacionais (NOVA) and a researcher of CEPESE- Centro de Estudos de População, Economia e Sociedade - Universidade do Porto.
Acknowledgements
References
Brunello, Giorgio, Margherita Fort, Nicole Schneeweis and Rudolf Winter-Ebmer, “The Causal Effect of Education on Health: What is the Role of Health Behaviors”, IZA Discussion Paper No. 5944 (Bonn, Germany, 2011).
Cavelaars, Adriënne E. J. M., Anton E. Kunst, José J. M. Geurts, Roberta Crialesi, Liv Grötvedt, Uwe Helmert, Eero Lahelma, Olle Lundberg, Jil Matheson, Andreas Mielck, Andreé Mizrahi, Arié Mizrahi, Niels Kr Rasmussen, Enrique Regidor, Thomas Spuhler, Johan P. Mackenbach, “Differences in self-reported morbidity by educational level: a comparison of 11 Western European countries”, Journal of Epidemiology & Community Health, 52 (1998), 219-227. Cutler, David M. and Adriana Lleras-Muney, “Education and Health: Evaluating
Theories and Evidence”, National Bureau of Economic Research Working Paper No. 12352 (Cambridge, MA, USA, 2006).
Denton, Margaret, Steven Prus and Vivienne Walters, “Gender differences in health: a Canadian study of the psychosocial, structural and behavioural determinants of health”, Social Science & Medicine, 58 (2004), 2585–2600.
European Commission, The 2012 Ageing Report: Economic and budgetary projections for the 27 EU Member States (2010-2060). European Economy, 2/2012 (Brussels, 2012).
Frie, Kirstin Grosse, Terje Andreas Eikemo and Olaf Von Dem Knesebeck, “Education and self-reported health care seeking behaviour in European welfare regimes: results from the European Social Survey”, International Journal of Public Health, 55 (2010), 217–220.
Hair, Joseph F., Rolph E. Anderson, Ronald L. Tatham and William C. Black. Multivariate Data Analysis (Upper Saddle River, New Jersey, Prentice Hall, 1998).
Henriques, Filipa Castro and Teresa Ferreira Rodrigues, “Essay on Ageing and Health projections in Portugal”. Item 3 – Challenges and use of population projections (2010). Joint Eurostat/UNECE Work Session on Demographic Projections (28–30 April 2010, Lisbon, Portugal). Statistical Office of the European Union (EUROSTAT).
Henriques, Filipa Castro, Teresa Ferreira Rodrigues and Maria Fraga O. Martins, “Ageing, Education and Health in Portugal: Prospective from the 19th to the 21st Century” Hygiea Internationalis, 8: 1 (2009), 81–96.
Hosmer, David W. and Stanley Lemeshow, Applied Logistic Regression (New Jersey, John Wiley & Sons, 2004).
Huisman, Martijn, Anton E. Kunst and Johan P. Mackenbach, “ Socioeconomic inequalities in morbidity among the elderly; a European overview”, Social Science & Medicine, 57(2003), 861–873.
“Education, aging, and health: to what extent can the rise in educational level relieve the future health care burden associated with population aging in the Netherlands?”, Journal of Clinical Epidemiology, 53(2000), 955–963.
OECD, Education at a Glance: OECD Indicators 2012 (2012). Country Note Portugal.
Orfila, Francesc, Montserrat Ferrer, Rosa Lamarca and Jordi Alonso, “Evolution of self-rated health status in the elderly: Cross-sectional vs. longitudinal estimates”, Journal of Clinical Epidemiology, 53(2000), 563–570.
Rechel, Bernd, Yvonne Doyle, Emily Grundy and Martin McKee, How can health systems respond to population ageing? (Copenhagen, World Health Organization, Regional Office for Europe, 2009).
Schoen, Robert, “Population Models With Constant Rates” pp. 1–26 in Dynamic Population Models. The Springer Series on Demographic Methods and Population Analysis (Springer Netherlands, 2006).