Lucélia Justino BorgesI
Tânia R Bertoldo BenedettiI André Junqueira XavierII
Eleonora d’OrsiIII
I Programa de Pós-Graduação em Educação Física. Centro de Desportos. Universidade Federal de Santa Catarina. Florianópolis, SC, Brasil
II Universidade do Sul de Santa Catarina. Palhoça, SC, Brasil
III Programa de Pós-Graduação em Saúde Coletiva. Centro de Ciências da Saúde. Universidade Federal de Santa Catarina. Florianópolis, SC, Brasil
Correspondence: Lucélia Justino Borges Centro de Desportos
Universidade Federal de Santa Catarina Campus Universitário - Trindade 88040-900 Florianópolis, SC, Brasil E-mail: [email protected] Received: 10/16/2011 Approved: 3/4/2013
Article available from: www.scielo.br/rsp
Associated factors of depressive
symptoms in the elderly:
Epi
Floripa study
ABSTRACT
OBJECTIVE: To estimate the prevalence and associated factors of depressive symptoms in the elderly.
METHODS: Cross-sectional population based epidemiological study (The
EpiFloripa Elderly survey) was carried out in two stage clusters, census tracts and households, with1.656 elderly individuals in Florianópolis, SC. The prevalence of depressive symptoms (outcome) was obtained using Geriatric Depression Scale (GDS-15) and its associations with socio-demographic, health, behavioral and social variables were assessed. Crude and adjusted prevalence ratios (PR) with 95% confi dence intervals were calculated using Poisson regression.
RESULTS: Depressive symptoms were observed in 23.9% of the elderly individuals (95%CI 21.84;26.01). In the fi nal model, depressive symptoms were associated with: 5 to 8 years of schooling (PR = 1.50, 95%CI 1.08;2.08); one to four years of schooling (PR = 1.62, 95%CI 1.18;2.23) and no schooling (PR = 2.11, 95%CI 1.46;3.05); being in a worse fi nancial condition than at the age of 50 (PR = 1.33, 95%CI 1.02;1.74); cognitive impairment (PR = 1.45, 95%CI 1.21;1.75); perceiving their health to be regular (PR = 1.95, 95%CI 1.47;2.60) or poor (PR = 2.64, 95%CI 1.82;3.83); functional dependence (PR =1.83, 95%CI 1.43;2.33) and chronic pain (PR = 1.35, 95%CI 1.10;1.67). Factors with protective effects were: being in the 70 to 79 year old age group (PR = 0.77, 95%CI 0.64;0.93); physical activity in leisure time (PR = 0.75, 95%CI 0.59;0.94); participation in social or religious groups (PR = 0.80, 95%CI 0.64;0.99) and having sexual relations (PR = 0.70, 95%CI 0.53;0.94).
CONCLUSIONS: Adverse clinical situations, being socioeconomically disadvantaged and low social and sexual activity were associated with depressive symptoms in the elderly.
Elderly people often suffer from depression and it is highlighted as one of the most common and signifi cant psychiatric problems.2,8 According to a systematic
review, prevalence worldwide varies between 0.9% and 9.4% in those living in the community and 14% to 42% in those living in a care home.8 Brazilian
epidemiolo-gical studies carried out with the elderly show that the prevalence of depressive symptoms varies between 195 and 34% in the different regions of the country.4,5,10,15
The high prevalence of depression requires the atten-tion of health care professionals and managers, as this disease increases the likelihood of functional incapa-city in the elderly16 and constitutes a signifi cant public
health problem.
Among the factors linked to depression, the following stand out: being female,4,6 advanced age,6,9,12 low
levels of education4,9 and living alone.12 In addition to
the socio-demographic characteristics, which are well established in the literature, other factors are associated with depression, such as: smoking,9 comorbidities
(cardiovascular, endocrine, neurological, oncological diseases),24 high levels of medicine use,15 functional
incapacity,6,10 negative perception of own health,6,12
low levels of physical activity,5,18,22 suicidal thoughts,12
insomia,6,10 and a predominance of negative exchanges
in relationships with family and friends.23 These factors,
especially those that can be modifi ed, need to be further explored, taking into account cultural differences between countries and regional differences within those countries, as in Brazil.
Identifying the factors linked to the presence of depres-sive symptoms may help prevent depression among the elderly3 and give an opportunity to non-pharmacological
treatment strategies.
The aim of this study was to analyze the prevalence of factors associated with depressive symptoms in the elderly.
METHODS
A cross-sectional population and household based study, part of the EpiFloripa Elderly Survey, which took place between September 2009 and June 2010 in Florianópolis, SC, Southern Brazil.a The estimated
population of this municipality in 2009 was 408,163, with 10.8% aged 60 and over.b Florianópolis has the
highest municipal human development index in Brazil (HDI-M 0.86)c and life expectancy at birth in 2009 was
75.8 years.d
The following were assumed in calculating the general sample for the EpiFloripa Elderly Survey: a population of 44,460,b unknown outcome prevalence (50%), sample
error equal to four percentage points, 95% confi dence level and design effect equal to two. An additional 20% was added to cover the predicted losses, and another 15% in order to control confounding factors, giving a minimum sample size of 1,599 individuals.
The selection process for the sample was in two stages of clusters. In the fi rst stage, 80 of the 420 census tracts were systematically selected according to average monthly income of the head of the household (eight tracts in each income decile). In the second stage the units were the households, tracts with fewer than 150 residences were grouped together, and those with more than 500 residences (respecting the correspondent income decile) were divided, resulting in 83 census tracts.
Trained interviewers collected the data using a stan-dardized, pre-tested questionnaire in face to face interviews, using Personal Digital Assistants (PDAs). The consistence of the data was checked every week and quality control, via the telephone, used a reduced version of the questionnaire with a randomly selected 10% of the interviews.
The outcome was depressive symptoms, obtained using the Geriatric Depression Scale (GDS), which contains 15 questions. The cutoff point used was fi ve/six (not case/case).2
The independent variables were: age group (60 to 69; 70 to 79; and 80 and over); sex; marital status (married/living with partner; single; divorced/sepa-rated; widowed); self-reported skin color (white; dark skinned; black; yellow; indigenous); schooling (illiterate; one to four years of schooling; fi ve to eight years; nine to 11 years; 12 or more years of schooling); actual economic situation compared to that at age 50 (same; worse); per capita household income (1st
quar-tile ≤ R$ 327.50; 2nd quartile: > R$ 327.50 and ≤ R$
700.00; 3nd quartile: > R$ 700.00 and ≤ R$ 1,500.00;
a Universidade Federal de Santa Catarina. EpiFloripa: condições de saúde de adultos e idosos de Florianópolis. Florianópolis; 2009 [cited 2013 Ago 30]. Available from: http://www.epifl oripa.ufsc.br/
b Instituto Brasileiro de Geografi a e Estatística. Estimativas populacionais para o TCU. Estimativas da população para 1º de julho de 2009, segundo os municípios. Brasília; 2009 [cited 2010 Ago 8]. Available from: http://www.ibge.gov.br/home/estatistica/populacao/estimativa2009/ POP2009_DOU.pdf
c Programa das Nações Unidas para o Desenvolvimento. Atlas de desenvolvimento humano no Brasil (PNUD). Brasília (DF): 2003 [cited 2010 Ago 8]. Available from: http://www.pnud.org.br/IDH/Atlas2003.aspx?indiceAccordion=1&li=li_Atlas2003
d Instituto Brasileiro de Geografi a e Estatística. Síntese dos indicadores sociais: uma análise das condições de vida da população brasileira - 2010. Rio de Janeiro; 2010 [cited 2010 Ago 8]. Available from: http://www.ibge.gov.br/home/estatistica/populacao/condicaodevida/ indicadoresminimos/sinteseindicsociais2010/SIS_2010.pdf
4th quartile: > R$ 1,500.00); cognitive state, evaluated
using the Mental State Mini-test, considering level of schooling (no cognitive defi ciency, probable cognitive deficiency); alcohol consumption according to the Alcohol Use Disorders Identifi cation Test (Audit) (none, moderate, excessive consumption); smoking (never smoked, used to smoke; smoker); level of physical activity, assessed using the International Physical Activity Questionnaire (IPAQ) (physically active: who does 150 minutes or more physical activity per week; insuffi ciently active: who does less than 150 minutes per week);17 nutritional status, evaluated using Body
Mass Index (underweight; normal weight; overweight),e
height was measured using a portable stadiometer and weight using a digital scale accurate to 100 g; participation in a social or religious group in the last year (yes; no); frequency of monthly socializing with friends and relatives (yes [more than once a month]; no [once a month or less often]); ability to communicate using the internet defi ned as self- reported ability to use a computer to send and receive messages (yes; no); functional dependency, assessed using the scale of basic and instrumental activities in daily living (incapability/ diffi culty carrying out up to three activities; incapability/ diffi culty carrying out 4-15 activities);20 perception of
own health (very good/good; regular; bad/very bad); self-reported chronic pain on most days (yes; no). The following non-communicable chronic diseases reported by the elderly were tested: back or spinal pain, cancer, fi bromyalgia, bronchitis or asthma, arthritis/ rheumatism, diabetes, hypertension, other cardiovas-cular diseases, stroke or cerebral ischemia.
Poisson regression was used to assess the association between depressive symptoms and the independent variables. The criteria for insertion in the multivariate model was p < 0.20 and the criteria for the variable to be mantained in the model was p ≤ 0.05 in the Wald test. The fi rst variables to be tested in the adjusted analysis were sociodemographic variables, followed by health, behavioral and social variables. The multivariate analyses took into consideration sample design effect, incorporating weighting through the “syv” command in the Stata program, designed to analyze data from complex samples. The Stata statistical package, version 11.0 (Stata Corp. College Station, EUA), was used for the statistical analyses.
This research met all ethical requirements and was approved by the Ethics Committee for Human Research of the Universidade Federal de Santa Catarina (Process No. 352/2008). Participants in the study signed a consent form.
e Ministério da Saúde, Secretaria de Atenção à Saúde, Departamento de Atenção Básica. Protocolos do Sistema de Vigilância Alimentar e Nutricional – SISVAN na assistência à saúde. Brasília (DF); 2008. (Série B. Textos Básicos de Saúde).
RESULTS
The interviewers identifi ed 1,911 eligible residences and interviewed 1,705 elderly individuals, with a response rate of 89.2%. Forty-nine interviews in which responses were given by carers were excluded, leaving 1,656. The majority of variables tested scored good or excellent in the quality control (kappa values varying between 0.6 and 0.9).
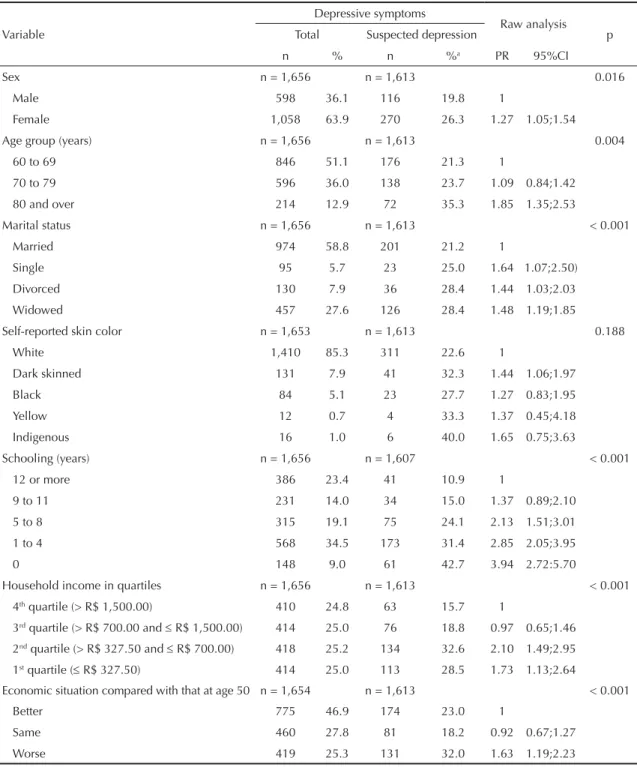
The sample was composed mainly of women (63.9%); 51.1% were aged between 60 and 69; 58.8% were married; 34.5% had up to four years of schooling and the mean per capita income was R$ 1,347.97. In the univariate analysis, women, those aged 80 and over and those who were illiterate or had a low level of schooling showed more depressive symptoms. Apart from skin color, the other sociodemographic variables proved to be associated with depressive symptoms in the raw analysis (Table 1).
The presence of depressive symptoms was higher among individuals with cognitive defi cit, those with higher functional dependency, those who had suffered a fall within the last year, those who experienced pain most days and those who perceived their own health to be very bad. Variables related to health, except for
fi bromyalgia and cancer, were linked with depressive symptoms in the raw analysis (Table 2).
Fewer depressive symptoms were observed in elderly individuals who reported having sexual relations, those who used the internet, those who reported high or moderate alcohol consumption, those who parti-cipated in social or religious groups, those who did leisure activities and those who had monthly contact with friends or relatives. Only smoking and body mass index were not linked to depressive symptoms in the raw analysis (Table 3).
In the fi nal multivariate model, a higher prevalence of depressive symptoms was linked to low levels of schooling, to being worse off than at age 50, the presence of cognitive defi ciency, negative perception of one’s own health, greater functional dependency and experiencing pain most days. Doing leisure activities, participating in social or religious groups and having sexual relations were linked to a lower prevalence of depressive symptoms. Age was inversely associated with depressive symptoms (Table 4).
DISCUSSION
in an epidemiological investigation carried out in Florianópolis in 2002, which detected a 19.7% level of depression among the elderly in the city.5
Important links were observed between symptoms of depression and socio-demographic, health, behavior and social variables. The literature highlights the association between depressive symptoms and socio-demographic
variables,4 indicating that social inequalities infl uence
living and health conditions and may contribute to the onset of these symptoms. Low levels of schooling, age and economic decline were the socio-demographic variables associated with depressive symptoms. Individuals with low levels of schooling are at higher risk of having depressive symptoms,4 indicating that
Table 1. Univariate analysis of depressive symptoms in the elderly according to socio-demographic variables. EpiFloripa Elderly
Survey. Florianópolis, SC, Southern Brazil, 2010.
Depressive symptoms
Raw analysis
Variable Total Suspected depression p
n % n %a PR 95%CI
Sex n = 1,656 n = 1,613 0.016
Male 598 36.1 116 19.8 1
Female 1,058 63.9 270 26.3 1.27 1.05;1.54
Age group (years) n = 1,656 n = 1,613 0.004
60 to 69 846 51.1 176 21.3 1
70 to 79 596 36.0 138 23.7 1.09 0.84;1.42
80 and over 214 12.9 72 35.3 1.85 1.35;2.53
Marital status n = 1,656 n = 1,613 < 0.001
Married 974 58.8 201 21.2 1
Single 95 5.7 23 25.0 1.64 1.07;2.50)
Divorced 130 7.9 36 28.4 1.44 1.03;2.03
Widowed 457 27.6 126 28.4 1.48 1.19;1.85
Self-reported skin color n = 1,653 n = 1,613 0.188
White 1,410 85.3 311 22.6 1
Dark skinned 131 7.9 41 32.3 1.44 1.06;1.97
Black 84 5.1 23 27.7 1.27 0.83;1.95
Yellow 12 0.7 4 33.3 1.37 0.45;4.18
Indigenous 16 1.0 6 40.0 1.65 0.75;3.63
Schooling (years) n = 1,656 n = 1,607 < 0.001
12 or more 386 23.4 41 10.9 1
9 to 11 231 14.0 34 15.0 1.37 0.89;2.10
5 to 8 315 19.1 75 24.1 2.13 1.51;3.01
1 to 4 568 34.5 173 31.4 2.85 2.05;3.95
0 148 9.0 61 42.7 3.94 2.72:5.70
Household income in quartiles n = 1,656 n = 1,613 < 0.001
4th quartile (> R$ 1,500.00) 410 24.8 63 15.7 1
3rd quartile (> R$ 700.00 and R$ 1,500.00) 414 25.0 76 18.8 0.97 0.65;1.46 2nd quartile (> R$ 327.50 and R$ 700.00) 418 25.2 134 32.6 2.10 1.49;2.95 1st quartile ( R$ 327.50) 414 25.0 113 28.5 1.73 1.13;2.64
Economic situation compared with that at age 50 n = 1,654 n = 1,613 < 0.001
Better 775 46.9 174 23.0 1
Same 460 27.8 81 18.2 0.92 0.67;1.27
Worse 419 25.3 131 32.0 1.63 1.19;2.23
Table 2. Univariate analysis of depressive symptoms in the elderly according to health variables. EpiFloripa Elderly Survey Florianópolis, SC, Southern Brazil, 2010.
Depressive symptoms
Raw analysis
Variable Total Suspected depression p
n % n %a PR 95%CI
Cognitive defi ciency n = 1,648 n = 1,613 < 0.001
No 877 53,2 160 18.5 1
Yes 771 46,8 224 30.2 1.76 1.44;2.15
Functional dependency n = 1,656 n = 1,613 < 0.001
0 to 3 ADLs 1,165 70,4 161 14.1 1
4 or more ADLs 491 29,6 225 47.4 3.68 3.06;4.42
Falls in the last year n = 1,656 n = 1,613 < 0.001
No 1,348 81,4 282 21.4 1
Yes 308 18,6 104 34.9 1.49 1.18;1.89
Taking medication n = 1,656 n = 1,613 0.007
No 178 10,7 18 10.3 1
Yes 1,478 89,3 368 25.6 1.97 1.20;3.23
Taking anti-depressive n = 1,656 n = 1,613 < 0.001
No 1,459 88,1 303 21.4 1
Yes 197 11,9 83 42.6 1.96 1.57;2.45
Perception of own health n = 1,656 n = 1,613 < 0.001
Good/Very good 848 51,2 80 9.7 1
Regular 642 38,8 194 31.1 3.09 2.34;4.09
Bad/Very bad 165 10,0 112 69.6 6.86 4.97;9.46
Experiences pain most days n = 1,656 n = 1,613 < 0.001
No 1,059 63,9 158 15.3 1
Yes 597 36,1 228 39.0 2.39 1.90;3.01
Self-reported morbidities
Back or spinal pain n = 1,655 n = 1,613 < 0.001
No 826 49,9 142 17.6 1
Yes 829 50,1 244 30.2 1.56 1.24;1.98
Arthritis or rheumatism n = 1,651 n = 1,608 < 0.001
No 1,089 66,0 208 19.7 1
Yes 562 34,0 175 31.8 1.67 1.35;2.05
Fibromyalgia n = 1,652 n = 1,610 0.134
No 1,591 96,3 361 23.3 1
Yes 61 3,7 24 40.7 1.42 0.89;2.24
Cancer n = 1,656 n = 1,613 0.067
No 1,506 90,9 345 23.5 1
Yes 150 9,1 41 28.7 1.32 0.98;1.78
Diabetes n = 1,656 n = 1,613 < 0.001
No 1.290 77.9 256 20.4 1
Yes 366 22.1 130 36.2 1.70 1.39;2.07
Bronchitis or asthma n = 1,656 n = 1,613 < 0.001
No 1.401 84.6 297 21.8 1
Yes 255 15.4 89 35.7 1.58 1.26;1.97
education is a protective factor against the onset of these symptoms.9 A higher level of education enables
the individual to increase their resources for dealing with stressful situations.4
Age as a protective factor in the fi nal model may be explained by the inclusion of the variable of functional dependency, suggesting that the effect of age on depres-sion can be modifi ed. Increased age is considered to be linked with experiencing different psychosocial episodes (deaths of relatives and friends, break up of conjugal relationships), as well as higher exposure to chronic illness.19 Another explanation is that suscepti-bility to depression and anxiety may decrease with age. Added to this is reduced emotional response and greater resilience when faced with stressful experiences.11
Being socio-economically disadvantaged increases the risk of depression, as highlighted in the literature.1 Becoming worse off is associated with depressive symptoms. It is not possible to say whether an indi-vidual becomes depressed due to worsening economic circumstances (fi nancial stability) or whether depres-sion throughout their life leads to this loss, as they become incapable of dealing with fi nancial and work situations. Social position may be inversely related with some depressive symptoms such as sadness, dwelling on the past and preferring to stay at home, indicating that socio-economic condition may contribute to the onset of these symtoms.19 On the other hand, a worsening economic situation may be triggered by depression, as it is related to cognition and to carrying out daily activities. Perfoming these activities may be compromised as depression increases the probability of functional incapacity among the elderly and may lead to dependence,16 creating a vicious circle.
Cognitive defi ciency and depressive symptoms are linked and are interrelated factors. Depression may lead to clinical dementia or dementia may evolve with the depressive symptoms.15 Cognitive defi ciencies may
improve when the patient is treated for depression.
The association between the outcome and chronic pain can be understood by the existence of a model of depression in the elderly that is mainly related to this type of pain. This indicates that the individual was not depressed before and begins experiencing depressive symptoms due to the chronic pain. In the case of osteoarthritis, the leading cause of pain in the elderly, depression can be expected in conjunction with pain and physical incapacity.14
Depressive symptoms are linked to self-perception of health, as has been seen in other investigations.6,12
Reporting one’s own health as being bad/very bad can be a depressive symptom, in some cases. Depression is a signifi cant marker of incapacity in the elderly, as it affects overall health and, consequently, functional capacity.6,10,15
Sexual function can be identifi ed as a health marker, observed in elderly individuals who have begun a process of functional decline, since maintaining an active sex life involves physical, mental and emotional and affective health, internal and external factors. Erectile dysfunction caused by peripheral vascular diseases, prostate surgery or diabetes may affect sexuality or the sex act itself.21 Erectile dysfunction is
strongly linked to depressive symptoms3 and affects
quality of life in the elderly. Improving these prob-lems may produce feelings of happiness, resulting in higher self-esteem, better social interaction, feelings of confi dence and competence.21 Improvements in these
aspects through sexual activity and the perception of sexual virility may contribute to reducing depressive feelings among men. Feelings of love, affection and companionship are the main, inherent aspects of sexual activity in women in old age,21 and perceiving these
feelings may contribute to depressive symptoms either not manifesting or decreasing.
Depression can be explained chemically as a decrease in the number of neurotransmitters released, which are responsible for producing hormones such as serotonin and endorphins. Sexual activity and physical activity7
have benefi cial effects for the health due to the release
Continuation
Hypertension n = 1,656 n = 1,613 < 0.001
No 683 41.2 120 18.1 1
Yes 973 58.8 266 28.0 1.65 1.34;2.04
Cardiovascular disease n = 1,656 n = 1,613 < 0.001
No 1.200 72.5 229 19.6 1
Yes 456 27.5 157 35.4 1.89 1.50;2.38
Stroke or cerebral ischemia n = 1,656 n = 1,613 < 0.001
No 1,527 92.2 330 22.2 1
Yes 129 7.8 56 44.1 2.21 1.78;2.76
of these hormones and provide feelings of well-being and pleasure; thus, it is a protective factor against developing depressive symptoms in both sexes. The other psycho-social benefi ts of doing physical activity, through social interaction, also stand out.18
There was a lower prevalence of depressive symptoms in the elderly who did leisure activities, corroborating other research.13,18,22 In a study in the South of Brazil,
physically active elderly had a 68% lower probability of having depressive symptoms compared with those who were not suffi ciently active.18 Research from the
Honolulu-Asia Aging Study (HAAS), which followed
the subjects for eight years, found that those elderly individuals who walked more than 0.25 miles per day (approximately 402 meters) were at lower risk of depressive symptoms.22 Taking into account only leisure
time physical activities, elderly individuals in Taiwan had a reduced risk of depressive symptoms after seven years of monitoring.13
Taking part in social groups proved to have a protective effect, signaling the importance of a social network in staying healthy and in preventing and/or treating depression in the elderly. However, it cannot be inferred that participating in social groups contributes to no
Table 3. Univariate analysis of depressive symptoms in the elderly according to social and behavioral variables. EpiFloripa
Elderly Survey. Florianópolis, SC, Southern Brazil, 2010.
Depressive symptoms
Raw analysis
Variable Total Suspected depression p
n % n %a RP 95%CI
Alcohol consumption n = 1,656 n = 1,613 0.002
Never 1,061 64,1 291 28.2 1
Moderate 315 19,0 49 15.9 0.60 0.40;0.88
High 280 16,9 46 16.9 0.59 0.42;0.84
Smoking n = 1,656 n = 1,613 0.815
Non-smoker 1,044 60,6 243 25.0 1
Ex-smoker 511 30,9 116 23.2 1.08 0.83;1.40
Smoker 141 8,5 27 19.4 0.98 0.57;1.68
Body Mass Index n = 1,627 n = 1,613 0.315
Normal weight 628 38,6 130 21.2 1
Underweight 137 8,4 34 25.6 1.32 0.90;1.94
Overweight 862 53,0 206 24.6 1.16 0.86;1.55
Physical leisure activities n = 1,656 n = 1,613 < 0.001 Insuffi ciently active 1,165 70,4 318 28.1 1
Active 491 29,6 68 14.1 0.48 0.38;0.62
Participating in social groups n = 1,656 n = 1,613 0.005
No 941 56,8 246 26.9 1
Yes 715 43,2 140 20.1 0.71 0.56;0.90
Monthly contact with relatives n = 1,653 n = 1,613 0.009
Yes 185 11,2 54 29.8 1
No 1,468 88,8 331 23.2 0.69 0.53;0.91
Monthly contact with friends n = 1,649 n = 1,613 < 0.001
Yes 280 17,0 99 37.1 1
No 1,369 83,0 284 21.2 0.56 0.47;0.67
Sexual relations n = 1,655 n = 1,613 < 0.001
No 925 55,9 278 31.0 1
Yes 730 44,1 108 15.1 0.43 0.31;0.59
Communicate using the internet n = 1,656 n = 1,613 < 0.001
No 1,313 79,3 360 28.2 1
Yes 343 20,7 26 7.7 0.34 0.22;0.52
depressive symptoms appearing, it may be that the fact of not having these symptoms contributes to participa-tion in these groups. In that case, participating in groups would be a marker of an individual without depression, i.e., elderly individuals who did not participate in
groups may be at higher risk of developing depressive symptoms, which prevents them from participating. It would be important to incentive those who do not attend this type of group to do so and assess the reasons for why this is not occurring.
Table 4. Multivariate adjusted analysis of depressive symptoms in the elderly according to socio-demographic, health, behavioral
and social variables. EpiFloripa Elderly Survey. Florianópolis, SC, Southern Brazil, 2010.
Variable Adjusted analysis
PR 95%CI p
Gender (n = 1,613)
Man 1
Woman 0.85 0.71;1.01 0.065
Age group (years) (n = 1,613)
60 to 69 1
70 to 79 0.77 0.64;0.93 0.006
80 and over 0.90 0.68;1.18 0.426
Schooling (years) (n = 1,607)
12 or more 1
9 to 11 1.01 0.65;1.57 0.958
5 to 8 1.50 1.08;2.08 0.015
1 to 4 1.62 1.18;2.23 0.003
0 2.11 1.46;3.05 < 0.001
Economic situation compared to that at age 50 (n = 1,613)
Better 1
Same 0.94 0.76;1.16 0.582
Worse 1.33 1.02;1.74 0.036
Cognitive defi cit (n = 1,613)
No 1
Yes 1.45 1.21;1.75 < 0.001
Perception of own health (n = 1,613)
Good 1
Regular 1.95 1.47;2.60 < 0.001
Bad 2.64 1.82;3.83 < 0.001
Functional dependency (n = 1,613)
0 to 3 AVDs 1
4 or more AVDs 1.83 1.43;2.33 < 0.001
Experience pain most days (n = 1,656)
No 1 0.004
Yes 1.35 1.10;1.67
Physical leisure activity (n = 1,613)
Insuffi ciently active 1 0.015
Active 0.75 0.59;0.94
Participating in social or religious groups (n = 1,656)
No 1 0.038
Yes 0.80 0.64:0.99
Sexual relations (n = 1,655)
No 1 0.018
Yes 0.70 0.53;0.94
A limitation of this study was its cross-sectional design, which meant that cause and effect relationships could not be defi ned. On the other hand, the high response rate contributed to its internal validity, decreasing the chance of systematic errors, and reproducibility was satisfactory. Using a large sample which is represen-tative of the municipality means the results can be extrapolated to the whole population.
Identifying the factors linked to depressive symptoms proved to be signifi cant, as this knowledge can support health care policies for the elderly in Florianópolis (prevention and treatment of depression, especially non-pharmacological strategies, such as programs promoting physical education) as well as contributing
to the discussion and understanding of depression in the elderly in Brazil and other countries. It is recom-mended that longitudinal studies be carried out, aiming to better understand the associated factors, in addition to conducting experimental research analyzing the behavior of modifi able factors and their relationship to depressive symptoms in the elderly.
ACKNOWLEDGEMENTS
Thanks to technicians at the Brazilian Institute of Geography and Statistics (IBGE) and the of Florianópolis, SC, for their help in carrying out the EpiFloripa Elderly Survey 2009/2010.
1. Almeida OP, Pirkis J, Kerse N, Sim M, Flicker L, Snowdon J, et al. Socioeconomic disadvantage increases risk of prevalent and persistent depression in later life. J Affect Disord. 2012;138(3):322-31. DOI:10.1016/j.jad.2012.01.021
2. Almeida OP, Almeida SA. Confi abilidade da versão brasileira da Escala de Depressão em Geriatria (GDS) versão reduzida.
Arq Neuro-Psiquiatr. 1999;57(2B):421-6. DOI:10.1590/S0004-282X1999000300013 3. Araujo AB, Durante R, Feldman HA, Goldstein I,
McKinlay JB. The relationship between depressive symptoms and male erectile dysfunction: cross-sectional results from the Massachusetts Male Aging Study.
Psychosom Med. 1998;60(4):458-65. 4. Batistoni SST, Neri AL, Cupertino APFB.
Medidas prospectivas de sintomas depressivos entre idosos residentes na comunidade.
Rev Saude Publica. 2010;44(6):1137-43. DOI:10.1590/S0034-89102010000600020
5. Benedetti TRB, Borges LJ, Petroski EL, Gonçalves LHT. Atividade física e estado de saúde mental de idosos. Rev Saude Publica. 2008;42(2):302-7. DOI:10.1590/S0034-89102008005000007
6. Castro-Costa E, Lima-Costa MF, Carvalhais S, Firmo JOA, Uchoa E. Factors associated with depressive symptoms measured by the 12-item General Health Questionnaire in Community-Dwelling Older Adults (The Bambuí Health Aging Study). Rev Bras Psiquiatr. 2008;30(2):104-9. DOI:10.1590/S1516-44462008005000007
7. Cunha GS, Ribeiro JL, Oliveira AR. Níveis de beta-endorfi na em resposta ao exercício e no sobretreinamento. Arq Bras Endocrinol Metab. 2008;52(4):589-98. DOI:10.1590/S0004-27302008000400004
8. Djernes JK. Prevalence and predictors of depression in populations of elderly: a review.
Acta Psychiatr Scand. 2006;113(5):372-87. DOI:10.1111/j.1600-0447.2006.00770.x
9. Gazalle FK, Lima MS, Tavares BF, Hallal PC. Sintomas depressivos e fatores associados em população idosa no Sul do Brasil. Rev Saude Publica. 2004;38(3):365-71. DOI:10.1590/S0034-89102004000300005
10. Hoffmann EJ, Ribeiro F, Farnese JM, Lima EWB. Sintomas depressivos e fatores associados entre idosos residentes em uma comunidade no norte de Minas Gerais, Brasil. J Bras Psiquiatr. 2010;59(3):190-7. DOI:10.1590/S0047-20852010000300004
11. Jorm AF. Does old age reduce the risk of anxiety and depression? A review of epidemiological studies across the adult life span. Psychol Med. 2000;30(1):11-22. 12. Kaneko Y, Motohashi Y, Sasaki H, Yamaji M. Prevalence
of depressive symptoms and related risk factors for depressive symptoms among elderly persons living in a rural Japanese community: a cross-sectional study. Community Ment Health J. 2007;43(6):583-90. DOI:10.1007/s10597-007-9096-5
13. Ku PW, Fox KR, Chen LJ. Physical activity and
depressive symptoms in Taiwanese older adults: a seven-year follow-up study. Prev Med. 2009;48(3):250-5. DOI:10.1016/j.ypmed.2009.01.006
14. Leite AA, Costa AJG, Lima BAM, Padilha AVL, Albuquerque EC, Marques CDL. Comorbidades em pacientes com osteoartrite: frequência e impacto na dor e na função física. Rev Bras Reumatol. 2011;51(2):118-23. DOI:10.1590/S0482-50042011000200002
15. Lima MTR, Silva RS, Ramos LR. Fatores associados à sintomatologia depressiva numa coorte urbana de idosos. J Bras Psiquiatr. 2009;58(1):1-7. DOI:10.1590/S0047-20852009000100001
16. Motl RW, Konopack JF, McAuley E, Elavsky S, Jerome GJ, Márquez DX. Depressive symptoms among older adults: long-term reduction after physical activity intervention. J Behav Med. 2005;28(4):385-94. DOI:10.1007/s10865-005-9005-5
17. Nelson ME, Rejeski WJ, Blair SN, Duncan PW, Judge JO, King AC, et al. Physical activity and public health in older adults: recommendation from the American College of Sports Medicine and the American Heart Association. Circulation. 2007;116(9):1094-105. DOI:10.1161/CIRCULATIONAHA.107.185650
This study was supported by the Conselho Nacional de Desenvolvimento Científi co e Tecnológico (CNPq – Process No. 569834/2008-2).
The authors declare that there are no confl icts of interest. Brazil. Rev Bras Psiquiatr. 2011;33(2):165-70. DOI:10.1590/S1516-44462011005000006
19. Rombaldi AJ, Silva MC, Gazalle FK, Azevedo MR, Hallal PC. Prevalência e fatores associados a sintomas depressivos em adultos do sul do Brasil: estudo transversal de base populacional.
Rev Bras Epidemiol. 2010;13(4):620-9. DOI:10.1590/S1415-790X2010000400007
20. Rosa TEC, Benício MHDA, Latorre MRDO, Ramos LR. Fatores determinantes da capacidade funcional entre idosos. Rev Saude Publica. 2003;37(1):40-8. DOI:10.1590/S0034-89102003000100008
21. Silva RMO. A sexualidade no envelhecer: um estudo com idosos em reabilitação. Acta Fisiatrica. 2003;10(3):107-12.
22. Smith TL, Masaki KH, Fong K, Abbott RD, Ross GW, Petrovitch H, et al. Effect of walking distance on 8-year incident depressive symptoms in elderly men with and without chronic disease: the Honolulu-Asia Aging Study. J Am Geriatr Soc. 2010;58(8):1447-52. DOI:10.1111/j.1532-5415.2010.02981.x
23. Stafford M, McMunn A, Zaninotto P, Nazroo J. Positive and negative exchanges in social relationships as predictors of depression: evidence from the English Longitudinal Study of Aging. J Aging Health. 2011;23(4):607-28. DOI:10.1177/0898264310392992
24. Teng CT, Humes EC, Demetrio FN. Depressão e comorbidades clínicas.