Screening for frailty in older
adults using a self-reported
instrument
Rastreamento de fragilidade em
idosos por instrumento autorreferido
I Programa de Pós-Graduação em
Enfermagem na Saúde do Adulto. Escola de Enfermagem. Universidade de São Paulo. São Paulo, SP, Brasil
II Departamento de Enfermagem
Médico-Cirúrgica. Escola de Enfermagem, Universidade de São Paulo. São Paulo, SP, Brasil
III Departamento de Medicina Social.
Faculdade de Medicina. Universidade de São Paulo. Ribeirão Preto, SP, Brasil
IV Departamento de Epidemiologia. Faculdade
de Saúde Pública. Universidade de São Paulo. São Paulo, SP, Brasil
Correspondence: Daniella Pires Nunes
Rua Cardeal Arcoverde, 388 apto.121 05408-000 São Paulo, SP, Brasil E-mail: [email protected] Received: 4/15/2014
Approved: 7/15/2014
Article available from: www.scielo.br/rsp
ABSTRACT
OBJECTIVE: To validate a screening instrument using self-reported assessment of frailty syndrome in older adults.
METHODS: This cross-sectional study used data from the Saúde, Bem-estar e Envelhecimento study conducted in Sao Paulo, SP, Southeastern Brazil. The sample consisted of 433 older adult individuals (≥ 75 years) assessed in 2009. The self-reported instrument can be applied to older adults or their proxy respondents and consists of dichotomous questions directly related to each component of the frailty phenotype, which is considered the gold standard model: unintentional weight loss, fatigue, low physical activity, decreased physical strength, and decreased walking speed. The same classiication proposed in the phenotype was utilized: not frail (no component identiied); pre-frail (presence of one or two components), and frail (presence of three or more components). Because this is a screening instrument, “process of frailty” was included as a category (pre-frail and frail). Cronbach’s α was used in psychometric analysis to evaluate the reliability and validity of the criterion, the sensitivity, the speciicity, as well as positive and negative predictive values. Factor analysis was used to assess the suitability of the proposed number of components.
RESULTS: Decreased walking speed and decreased physical strength showed good internal consistency (α = 0.77 and 0.72, respectively); however, low physical activity was less satisfactory (α = 0.63). The sensitivity and speciicity for identifying pre-frail individuals were 89.7% and 24.3%, respectively, while those for identifying frail individuals were 63.2% and 71.6%, respectively. In addition, 89.7% of the individuals from both the evaluations were identiied in the “process of frailty” category.
CONCLUSIONS: The self-reported assessment of frailty can identify the syndrome among older adults and can be used as a screening tool. Its advantages include simplicity, rapidity, low cost, and ability to be used by different professionals.
DESCRIPTORS: Aged. Frail Elderly. Physical Fitness. Motor Activity. Diagnostic Self Evaluation. Questionnaires, utilization. Validation Studies.
Daniella Pires NunesI
Yeda Aparecida de Oliveira DuarteII
Jair Lício Ferreira SantosIII
Frailty is a clinical syndrome with a signiicant impact on the lives of older adults, their families, and their social environment because it is a predictor of distinct adverse health outcomes10 and is associated with increased demand for social and health care services, signiicantly raising the costs of assistance.8
Frailty is also a dynamic condition that can improve or worsen over time. Among the various deinitions of frailty, two are more common: one is related to the accumulation of deicits, adding up the clinical condi -tions and diagnosed dysfunc-tions that compose the Frailty Index,22 while the other is the frailty phenotype proposed by Fried et al.11
Fried et al11 characterized frailty as decreased phys-iological reserves and increased vulnerability of
RESUMO
OBJETIVO: Validar instrumento de rastreamento por avaliação autorreferida da síndrome de fragilidade entre idosos.
MÉTODOS: Estudo transversal com dados do estudo Saúde, Bem-estar e Envelhecimento, realizado em São Paulo, SP. A amostra probabilística foi constituída por 433 idosos (idade ≥ 75 anos) avaliados em 2009. O instrumento autorreferido utilizado pode ser aplicado a idosos ou proxi-informantes e foi composto por questões dicotômicas relacionadas diretamente a cada componente do fenótipo de fragilidade considerado padrão-ouro: perda de peso não intencional, fadiga, baixa atividade física, redução de força e de velocidade de marcha. Manteve-se a classiicação proposta no fenótipo: não frágil (nenhum componente identiicado); pré-frágil (presença de um ou dois componentes) e frágil (presença de três ou mais componentes). Por tratar-se de instrumento de rastreamento, incluiu-se a categoria processo de fragilização (pré-frágil e frágil). Utilizou-se o coeiciente α de Cronbach na análise psicométrica para avaliar coniabilidade e validade de critério, sensibilidade, especiicidade e valores preditivos positivo e negativo. Para veriicar a adequação do número de componentes propostos, utilizou-se a análise fatorial.
RESULTADOS:Os componentes “redução de velocidade de caminhada” e “redução de força” apresentaram boa consistência interna (α = 0,77 e α = 0,72, respectivamente) e a “baixa atividade física” (α = 0,63) foi um pouco menos satisfatória. A sensibilidade e a especiicidade para identiicação dos pré-frágeis foram de 89,7% e 24,3% e dos frágeis, 63,2% e 71,6%, respectivamente. A categoria “processo de fragilização” identiicou, igualmente, 89,7% das pessoas em ambas as avaliações.
CONCLUSÕES:O instrumento de avaliação de fragilidade autorreferida é capaz de identiicar a síndrome entre as pessoas idosas, podendo ser utilizado como instrumento de rastreamento, tendo como vantagens ser simples, rápido, de baixo custo e aplicável por diferentes proissionais.
DESCRITORES: Idoso. Idoso Fragilizado. Aptidão Física. Atividade Motora. Autoavaliação Diagnóstica. Questionários, utilização. Estudos de Validação.
INTRODUCTION
individuals, impairing their homeostatic adaptation capacity because of internal and continuous processes expressed as a phenotype composed of ive measur -able components: unintentional weight loss, fatigue, decreased physical strength, decreased walking speed, and low physical activity.
The frailty phenotype has been investigated in different regions of the world; its prevalence varies between 5.0% and 20.0%, and its annual incidence is 7.0%.22 According to Fried et al,10 the syndrome may be revers-ible or may be delayed if diagnosed early.11,13
health condition were validated in different contexts and have been widely used in assessing health, particularly as screening tools, because of their practicality, range, speed, and low cost.1,2,16,20,21
Self-perception of frailty by the individuals themselves allows expanded screening for the syndrome and serves as an important tool in early diagnosis.
The present study aimed to validate a screening instru-ment for self-reported assessinstru-ment of frailty syndrome among older adults.
METHODS
This cross-sectional study used a database from the Saúde, Bem-estar e Envelhecimento (SABE – Health, Welfare, and Aging) study initiated in 2000 as a multi -center survey in seven urban -centers in Latin America and the Caribbean.18 In the city of Sao Paulo, SP, Southeastern Brazil, 2,143 older adults (cohort A00) of both sexes were selected by random sampling and interviewed in their homes.24 In 2006, 1,115 older adults from the irst cohort (cohort A06) were located and re-evaluated, and the assessment of the frailty pheno-type was introduced.10 The data were weighted to be representative of the population. The weights resulting from the sample design were added according to the strata represented (age and sex).
In 2008, on the basis of the distribution of the syndrome in the population in 2006, a subproject aimed at identi -fying the determining factors of frailty among longer-lived adults (≥ 75 years) was developed by moni -toring every six months for two years consecutively (2008 and 2009) using telephone and home evaluations. The inal sample consisted of 433 older adults who were re-interviewed in 2009, when frailty syndrome was assessed using the components proposed by Fried et al11 (considered the gold standard) at the same time when the questionnaire used for self-assessment was imple-mented for validation.
The frailty phenotype11 was obtained using the following measurable components:
• Unintentional weight loss: This was calculated on the basis of the difference in weight of older adults in 2008 and 2009 measured during home evalua -tions. Older adults who reported a weight loss of > 3 kg in 2009 received a positive score for frailty; • Handgrip strength: This was obtained using a Takei
Kiki Kogyio dynamometer (model TK 1201) and evaluated with the patient in a sitting position. Participants were asked to exert as much force as possible using their dominant arm twice in succes-sion. Only the higher strength value was conside -red, and this was adjusted for the body mass index
(in quartiles) and stratiied by sex. For each quartile, the handgrip strength was divided into quintiles, and the cutoff value for decreased strength was consi-dered the lowest quintile obtained (20.0% weaker); • Fatigue: Two questions from the Center for
Epidemiological Studies-Depression (CES-D) pro -posed by Fried et al11 were used and subsequently validated for Brazilian older adults by Batistoni et al.4 Participants who answered at least one question with “sometimes” or “most of the time” were included in this category and received a positive score for frailty; • Decreased walking speed: This was obtained using
the walking speed test on the basis of the Short Physical Performance Battery Assessing Lower Extremity Function.14 The results were adjusted for average height and sex and stratiied into quin -tiles. Older adults placed in the highest quintile in each stratum (20.0% slower) received a positive score for frailty;
• Low physical activity: This was assessed using the International Physical Activity Questionnaire (IPAQ) validated for the Portuguese language.5,6 The total amount of energy spent on activities for a week was calculated, stratiied by sex, and divi -ded into quintiles. Older adults placed in the lowest quintile (20.0% less active) received a positive score for frailty.
The classiication of frailty for both the instruments followed the proposal of Fried et al,11 in which frail individuals were those who received positive scores for three or more components, pre-frail individuals were those who received positive scores for one or two components, and non-frail individuals were those who did not present any of the components described.
The self-reported instrument (Table 1) considered the perception of older adults or their proxy informants with respect to the components of frailty syndrome. The answers to each component were compared with the results obtained using the Fried et al model10 to assess agreement. Subsequently, a new classiication called “frailty process” was created; this included all the older adults classiied as pre-frail and frail for detecting the magnitude of the syndrome in this population.
Cronbach’s α was used to analyze the internal consistency of the questions in the proposed instru-ment; values between 0.70 and 0.90 indicated good internal consistency, values < 0.70 indicated weak internal consistency, and values > 0.90 indicated very good internal consistency (possibly caused by item redundancy).26
instrument, provided that its accuracy (ability to iden-tify the syndrome) was maintained. Factor analysis examined the correlations between the proposed items and veriied whether the number of items could be decreased to a single dimension or variable (desig-nated factor) to which all the variables of the series were related, thereby assuming a one-dimensional char-acter.19 The components of the proposed instrument and the phenotype of Fried et al11 were submitted to prin-cipal component analysis using the Tetrachoric corre-lation matrix to identify the patterns of joint variation of the items and the variance individually explained by these factors. Orthogonal rotation was performed according to the varimax method7 so that the resulting factors would be as independent as possible. Items with values > 0.32 were considered to have high factor loading and those with values ≤ 0.32 were automati -cally excluded from analysis.
To validate the proposed instrument, the criterion that indicated the effectiveness of the model in predicting individual performance in speciic activities was used. In the present study, we used the concurrent criterion validity, which was obtained by the simultaneous appli-cation of two equivalent instruments: the phenotype model of Fried et al11 as the gold standard (obtained with objective measurements adapted from the SABE study) and the self-reported questionnaire. Measures of sensitivity, speciicity, positive predictive value (PPV),
negative predictive value (NPV), and area under the receiver operator characteristic (ROC) curve were used to assess the ability of the proposed instrument to correctly classify subjects when compared with the gold standard method.
The research was approved by the Research Ethics Committee of the Escola de Enfermagem of the Universidade de São Paulo (registered under 741/2008 dated 6/4/2008).
RESULTS
In 63.1% of the interviews, older adults were the only respondents, and in 36.9% of the cases (n = 52), the participation of proxy respondents was required either partially (auxiliary respondent) or completely (substi -tute respondent) because the older adults presented cognitive decline and/or functional and physical limi -tations that prevented them from answering the ques-tions. We attempted to verify the equivalence between the responses of older adults and those of the proxy respondents using analysis of sensitivity and speci-icity between the objective and subjective assess -ments of frailty.
Comparison of the responses from the older adults and proxy informants indicated greater sensitivity for both pre-frailty (93.0%) and frailty (75.6%) among
Table 1. Self-reported assessment of components of frailty syndrome among older adults. Sao Paulo, SP, Southeastern Brazil, 2009.
Frailty Questions and answers
Weight loss
(In this component, older adults who reported a loss of > 3 kg received a po-sitive score)
In the last 12 months, did you lose weight without going on any diet?
If yes, how many kilograms did you lose? Between 1 kg and 3 kg
More than 3 kg No
Decreased strength In the last 12 months, do you feel weaker or think your strength has decreased?
Yes No
Decreased walking speed Do you think that you are walking more slowly than you did 12 months ago?
Yes No
Low physical activity Do you think that you are currently performing less physical activity than you did 12 months ago?
Yes No Self-reported fatigue
(Older adults who responded “some-times” or “most of the time” to at least one of these questions received a posi-tive score)
In the past week, how often did you feel that you could not perform daily activi-ties (you started something but could not finish)?
Never or rarely (less than 1 day) A few times (1 - 2 days) Sometimes (3 - 4 days) Most of the time
In the past week, how often did the performance of your routine activities require a major effort?
the proxy informants when compared with the self-reported assessments. However, the responses from the older adults showed a higher speciicity (72.9%). With regard to concordance, analysis of the ROC curve indi -cated that both assessments (proxy and self-reported) correctly classiied the evaluated subjects (61.1% and 64.6%, respectively). This was considered to be an indicator of equivalence between the results, permitting the inclusion of proxy respondents in the inal sample.
The study population was predominantly women (65.4%) and individuals living with other people (79.2%). The mean age was 85.7 years (SD = 5.1), and the mean level of education was < 3 years (59.6%). With regard to health conditions, 63.5% reported the presence of two or more diseases, 65.8% reported dificulty in at least one activity of daily living, 43.3% required a care -giver, 26.1% had cognitive decline, and 18.5% experi -enced depressive symptoms. In the evaluation of frailty syndrome using the phenotype model of Fried et al,11 the study group included 17.1% non-frail individuals, 45.9% pre-frail individuals, and 37.0% frail individuals, with the latter two groups accounting for 82.9% of the older adults in the frailty process (Table 2).
Analysis of internal consistency indicated that decreased walking speed and handgrip strength had Cronbach’s α values of 0.77 and 0.72, respectively, indicating good internal consistency. In addition, the Cronbach’s α value for low physical activity was a little less satisfactory (0.63) whereas the α values for self-reported fatigue and weight loss were unsatisfac-tory (0.37 and 0.31, respectively). In view of these results, we aimed to verify the possibility of decreasing the number of components in the self-reported assess-ment of frailty using factor analysis, provided that the patients could successfully diagnose the syndrome.
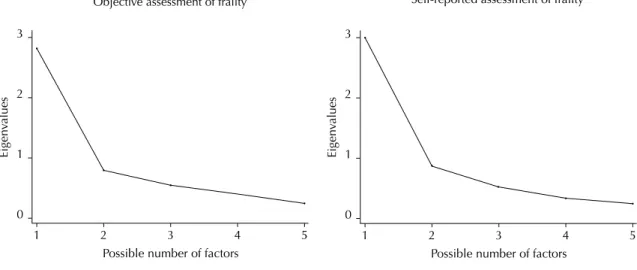
Factor analysis of the components of the model proposed by Fried et al11 was performed to initially verify its performance and then compare this model with the proposed instrument for assessing the possi-bility of decreasing the number of components. This analysis indicated a regular correlation between decreased walking speed and decreased handgrip strength (r = 0.637), weight loss (r = 0.570), and reported fatigue (r = 0.424). Low physical activity showed a low correlation with weight loss (r = 0.253) and decreased handgrip strength (r = 0.329). Decreased handgrip strength showed a good correlation with weight loss (r = 0.545). Decreased walking speed was the component with the highest factor loading (FL) (FL = 0.854), i.e., its contribution to the composition of the syndrome using this evaluation was 85.4%. The components that followed were decreased handgrip strength (FL = 0.796), weight loss (FL = 0.746), fatigue (FL = 0.696), and low physical activity (FL = 0.639). Figure 1 shows the presence of a single factor with a
Table 2. Number and percentage of older adult individuals
according to demographic characteristics and health conditions. Sao Paulo, SP, Southeastern Brazil, 2009.
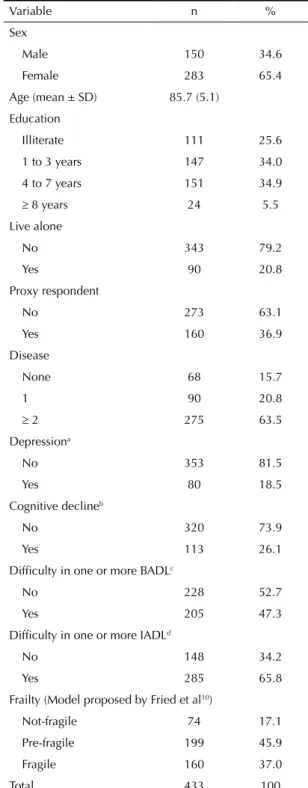
Variable n %
Sex
Male 150 34.6
Female 283 65.4
Age (mean ± SD) 85.7 (5.1)
Education
Illiterate 111 25.6
1 to 3 years 147 34.0
4 to 7 years 151 34.9
≥ 8 years 24 5.5
Live alone
No 343 79.2
Yes 90 20.8
Proxy respondent
No 273 63.1
Yes 160 36.9
Disease
None 68 15.7
1 90 20.8
≥ 2 275 63.5
Depressiona
No 353 81.5
Yes 80 18.5
Cognitive declineb
No 320 73.9
Yes 113 26.1
Difficulty in one or more BADLc
No 228 52.7
Yes 205 47.3
Difficulty in one or more IADLd
No 148 34.2
Yes 285 65.8
Frailty (Model proposed by Fried et al10)
Not-fragile 74 17.1
Pre-fragile 199 45.9
Fragile 160 37.0
Total 433 100
a Depression: Score > 5 points in the geriatric depression
scale was considered positive.
b Cognitive decline: Mini Mental State Examination (MMSE) ≤ 18 points.
c BADL: basic activities of daily living (eating, dressing,
toileting, bathing, moving from bed to chair, and walking across a room).
d IADL: instrumental activities of daily living (taking
higher eigenvalue (2.81), which distinguishes it from four other possible factors, accounting for 56.3% of the total possible variance. This indicates a correlation between components (items), suggesting that the model proposed by Fried et al11 represented a one-dimensional framework, in which each component contributed in a particular manner to the results, each with its own speciic weight and therefore unable to be excluded.
Subsequently, analysis was conducted using the compo-nents of the proposed instrument for assessing the main-tenance of this property. Low physical activity showed a good correlation with decreased handgrip strength (r = 0.750), decreased walking speed (r = 0.668), and fatigue (r = 0.564). Decreased handgrip strength showed a good correlation with decreased walking speed (r = 0.655) and fatigue (r = 0.638), whereas weight loss showed a low correlation with the other items evaluated. Similar to the model of Fried et al,11 the proposed instru-ment was composed of a single factor that included all components and accounted for 60.5% of the total vari -ance with an eigenvalue of 3.02, which was higher than the gold standard and thereby yielded a very good explan-atory power for the evaluated phenomenon.
The component that most contributed to self-reported assessment of frailty was handgrip strength, with the highest factor loading (FL = 0.892), followed by low physical activity (FL = 0.864), decreased walking speed (FL = 0.827), and fatigue (FL = 0.783). Although weight loss presented lower factor loading (FL = 0.428), its permanence in the composition of the framework was necessary.
The obtaining of the instrument containing five self-reported components was followed by concurrent validation, which indicated that low physical activity showed good sensitivity (71.2%), speciicity (50.3%),
and PPV (69.1%). Decreased walking speed and hand -grip strength had higher sensitivity (79.0% and 77.7%, respectively), while weight loss had higher speciicity (80.1%) and a good NPV (72.9%) (Table 3).
Among older adults classiied as frail in the objective assessment, 74.4% were also classiied as frail in the self-reported assessment. Among those classiied as pre-frail in the objective assessment, 54.3% were classiied as frail in the self-reported assessment. The sensitivity and speciicity of the proposed instrument were 89.7% and 24.3%, respectively, among the pre-frail group, and 63.2% and 71.6%, respectively, among the frail group, indicating the perception of older adult subjects even in the early stages of the frailty process (Figure 2). Considering the need for early identiication of indi -viduals who are most vulnerable to frailty, we used the “frailty process” (pre-frail and frail individuals) in both the models. It was observed that 89.7% of the older adults were classiied in this category in both assess -ments, with only 10.3% false negatives. In the preci -sion measurements, the frailty process showed PPV of 85.2% and area under the ROC curve of 72.0%, indicating that the proposed instrument classified > 70.0% of the older adults in a correct, rapid, and simple manner.
DISCUSSION
The instrument proposed for self-reported assessment of frailty showed satisfactory levels of reliability and sensi-tivity. Two of the ive components showed good internal consistency (handgrip strength and walking speed), one was less satisfactory (low physical activity), and the remaining two (weight loss and fatigue), despite low coeficients, were fundamental for the one-dimensional
Figure 1. Eigenvalues of the objective and self-reported assessment of frailty components among older adults. Sao Paulo, SP,
Southeastern Brazil, 2009.
0 1 2 3
1 2
Possible number of factors
Eigen
va
lues
3 4 5
0 1 2 3
1 2
Possible number of factors
Eigen
va
lues
3 4 5
Figure 2. Distribution of the percentage of older adult individuals according to objective and self-reported assessment of frailty. Sao Paulo, SP, Southeastern Brazil, 2009.
70.0
60.0
50.0
40.0
30.0
20.0
10.0
0.0
Non-fragile Pre-fragile
Objetive assessment of frailty
Fragile 80.0
90.0 100
Self-reported assessment of fr
ailty (%)
24.3
12.0
8.1 17.5
Fragile 74.4
33.7 54.3
47.3 28.4
Pre-fragile
Non-fragile
frailty framework obtained in factor analysis because these components presented high factor loading and good correlation with each other and therefore could not be removed from the instrument (Figure 1).
Although frailty syndrome involves a triad (neuroen-docrine dysregulation, neuromuscular changes, and immune dysfunction), it includes a one-dimensional framework according to the phenotype model proposed by Fried et al.11 This characteristic, essential in Fried’s model, was maintained in the proposed instrument.
The unintentional weight loss seems to be due to energy dysregulation generated by neuroendocrine and muscu-loskeletal disorders, malnutrition, inlammation, cata -bolic diseases, and decreased muscle mass.12,27 Older adult individuals tend to associate weight loss without a speciic cause with poor health conditions; there -fore, they do not tend to admit its occurrence. Several studies have shown that weight is underestimated in
both younger3,15 and older populations.20,21 Xue et al27 investigated the initial manifestations and develop-ment of the frailty phenotype to assess the risk of its components and to understand its natural history and observed that weight loss was the least frequent compo-nent among older adults.
Low physical activity, decreased walking speed, and decreased handgrip strength presented higher sensi-tivity and PPV and were more easily diagnosed because they signiicantly interfered with the performance of activities of daily living. The one-dimensionality of the framework may explain the higher prevalence of these components when compared with the result obtained using the phenotype model. This becomes even more important when functional dependency is present.9,10,25
Considering the one-dimensionality of the framework and the subjectivity of the responses, we included a variable designated “frailty process”. For a screening
Table 3. Distribution of the precision measurements from comparing the components of objective and self-reported assessment
of frailty components among older adults. Sao Paulo, SP, Southeastern Brazil, 2009.
Components of assessing frailty syndrome
Sensibility Specificity PPV NPV
% % % %
Decreased walking speed 79.0 31.4 56.4 57.1
Decreased handgrip strength 77.7 34.9 44.7 69.8
Low physical activity 71.2 50.3 69.1 52.8
Unintentional weight loss 19.7 80.1 26.7 72.9
instrument, the identiication of groups vulnerable to the syndrome is more important than accuracy. Therefore, the identiication of older adults in the process of becoming frail (pre-frail and frail groups) in a given territory would allow health care strategies targeting this group to be reorganized and would also provide a more accurate assessment and diagnosis of the syndrome and possible associated factors. This would allow the establishment of targeted, eficient, and accurate treatment strategies.
Compared with the phenotype model of Fried et al,11 the proposed instrument categorized 89.7% of the older adults with an acceptable error rate, particularly false negatives (10.3%). Older adults classiied as false negatives were those considered frail using the pheno-type model and non-frail in the self-reported assess-ment. This classiication was low in comparison with another study using self-reported questions.14 Older adults identiied as false negatives responded to the interviews personally, were longer-lived, lived alone, and had better health (i.e., fewer functional limitations), better self-reported health, and fewer depressive symp-toms. Considering this proile, it can be inferred that older adults themselves did not feel the progression of the syndrome because their health condition was better.
Another characteristic of the proposed instrument was the possibility of including the data provided by proxy respondents, thereby expanding the evalu-ation spectrum, particularly for more disabled indi-viduals. Typically, one of the limitations of subjective
information involves the use of proxy respondents, who are often used in epidemiological studies when the research subjects are unable to provide self-reported information because of functional or cognitive limita-tions. The decision to include proxy respondents often has the advantage of increasing the number of cases available for evaluation and achieving a more represen-tative group of subjects with the condition of interest.17 One limitation of the present study involves its cross-sectional design, which precluded the assessment of the predictive validity of the self-reported instrument for adverse outcomes, including functional decline, rate of hospitalization, and death.
The proposed instrument was reliable and valid for assessing frailty syndrome in primary health care and may contribute to the early identiication of older adults who are more vulnerable to frailty, including those who have more dificulty in accessing health care services or who live far from care facilities, particularly in rural areas. This instrument can be extensively used, allowing health care services targeting older adults to be reorganized in each territory. Because of its easy implementation and simple and direct questions, it does not require the use of resources for the acquisition of equipment or speciic training, and it can be managed by any multidisciplinary professional team in a short time and in different locations. Its large-scale use can allow the importance of frailty syndrome among older adult populations to be estimated at the national level in major and minor centers as well as in urban and rural areas.
1. Avila-Funes JA, Gutierrez-Robledo LM, Rosales PDL. Validity of height and weight self-reported in Mexican adults: results from the national health and ageing study. J Nutr Health Aging. 2004;8(5):355-61. DOI:10.1590/S1517-86922008000200009
2. Barreto PS, Greig C, Ferrandez AM. Detecting and categorizing frailty status in older adults using a self-report screening instrument.
Arch Gerontol Geriatr. 2012;54(3):e249-54. DOI: 10.1016/j.archger.2011.08.003
3. Basterra-Gortari JB, Bes-Rastrollo M, Forga LI, Martínez JA, Martínez-González MA. Validación del índice de masa corporal auto-referido en la Encuesta Nacional de Salud. An Sist Sanit Navar. 2007;30(3):373-81. DOI:10.4321/S1137-66272007000500006
4. Batistoni SST, Neri AL, Cupertino APFB. Validade da escala de depressão do Center for Epidemiological Studies entre idosos brasileiros.
Rev Saude Publica. 2007;41(4):598-605. DOI:10.1590/S0034-89102007000400014
5. Benedetti TRB, Mazo GZ, Barros MV. Aplicação do Questionário Internacional de Atividade Física para avaliação do nível de atividades físicas de mulheres
idosas: validade concorrente e reprodutibilidade teste/ reteste. Rev Bras Cienc Mov. 2004;12(1):25-33.
6. Benedetti TRB, Antunes PC, Rodriguez-Añez CR, Mazo GZ, Petroski EL. Reprodutibilidade e validade do Questionário Internacional de Atividade Física (IPAQ) em homens idosos.
Rev Bras Med Esporte. 2007;13(1):11-6. DOI:10.1590/S1517-86922007000100004
7. Comrey AL, Lee HB. Interpretation and application of factor analytic results. In: Comrey AL, Lee HB. A first course in factor analysis. 2. ed. Hillsdale: Lawrence Erlbaum, 1992.
8. Fassbender K, Fainsinger RL, Carson M, Finegan BA. Cost trajectories at the end of life: the Canadian experience. J Pain Symptom Manage. 2009;38(1):75-80. DOI:10.1016/j.jpainsymman.2009.04.007
9. Ferrucci L, Guralnik JM, Studenski S, Fried LP, Cutler Jr GB, Walston JD. Designing randomized, controlled trials aimed at preventing or delaying functional decline and disability in frail, older persons: a consensus report. J Am Geriatr Soc. 2004;52(4):625-34. DOI:10.1111/j.1532-5415.2004.52174.x
Research supported by the Fundação de Amparo à Pesquisa do Estado de São Paulo (FAPESP – registered under 2009/06910-3 – through a master’s fellowship awarded to Nunes DP).
Based on a master’s thesis of Nunes DP, titled: “Validação da avaliação subjetiva de fragilidade em idosos no município de São Paulo: Estudo SABE (Saúde, Bem estar e Envelhecimento)”, presented to the Postgraduate Program in Public Health at the Faculdade de Saúde Pública of the Universidade de São Paulo, in 2011.
The authors declare no conflict of interest. 10. Fleg JL, Morrell CH, Bos AG, Brant LJ, Talbot
LA, Wright JG, et al. Accelerated longitudinal decline of aerobic capacity in healthy older adults. Circulation. 2005;112(5):674-82. DOI:10.1161/CIRCULATIONAHA.105.545459
11. Fried LP, Tangen CM, Walston J, Newman AB, Hirsch C, Gottdiener J. et al. Frailty in older adults: evidence for a phenotype. J Gerontol A Biol Sci Med Sci.
2001;56(3):M146-56. DOI:10.1093/gerona/56.3.M146
12. Fried LP, Walston JM. Frailty and failure to thrive. In: Hazard WR, Blass JP, Halter JB, Ouslander JG, Tinetti ME. Principles of Geriatric Medicine and Gerontology. 5.ed. New York: McGraw-Hill; 2003. p.1487.
13. Gill TM, Gahbauer EA, Allore HG, Han L. Transitions between frailty states among community-living older persons. Arch Intern Med. 2006;166:418-23. DOI:10.1001/archinte.166.4.418
14. Guralnik JM, Simonsick EM, Ferrucci L, Glynn RJ, Berkman LF, Blazer DG, et al. A short physical performance battery assessing lower extremity function: association with self-reported disability and prediction of mortality and nursing home admission. J Gerontol.
1994;49(2):M85-94. DOI:10.1093/geronj/49.2.M85
15. Hebert R, Bravo G, Korner-Bitensky N, Voyer L. Predictive validity of a postal questionnaire for screening community-dwelling elderly individuals at risk of functional decline. Age Ageing. 1996;25(2):159-67. DOI:10.1093/ageing/25.2.159
16. McAdams MA, Van Dam RM, Hu FB. Comparison of self-reported and measured BMI as correlates of disease markers in U.S.adults. Obesity (Silver Spring).
2007;15(1):188-96. DOI:10.1038/oby.2007.504
17. Nelson LM. Proxy respondents in epidemiologic research. Epidemiol Rev. 1990;12:71-6.
18. Palloni A, Peláez M. Histórico e natureza do estudo. In: Lebrão ML, Duarte YAO. O projeto SABE no Brasil: uma abordagem inicial. Brasília (DF): Organização Pan-Americana da Saúde; 2003. p.33-44.
19. Pasquali L. Psicometria: teoria dos testes na psicologia e na educação. Petrópolis: Vozes; 2003.
20. Peixoto MRG, Benício MHDA, Jardim PCBV. Validade do peso e da altura auto-referidos: o estudo de Goiânia. Rev Saude Publica. 2006;40(6):1065-72. DOI:10.1590/S0034-89102006000700015
21. Rech CR, Petroski EL, Böing O, Babel Jr RJ, Soares MR. Concordância entre as medidas de peso e estatura mensuradas e autorreferidas para o diagnóstico do estado nutricional de idosos residentes no sul do Brasil. Rev Bras Med Esporte. 2008;14(2):126-31. DOI:10.1590/S1517-86922008000200009
22. Rockwood K, Mitnitski AB, MacKnight C. Some mathematical models of frailty and their clinical implications. Rev Clin Gerontol. 2002;12(2):109-17. DOI:10.1017/S0959259802012236
23. Santos-Eggimann B, Cuenoud P, Spagnoli J, Junod J. Prevalence of frailty in middle aged and older community-dwelling Europeans living in 10 countries.
J Gerontol A Biol Sci Med Sci. 2009;64(6):675-81. DOI:10.1093/gerona/glp012
24. Silva NN. Processo de amostragem. In: Lebrão ML, Duarte YAO. O projeto SABE no Brasil: uma abordagem inicial. Brasília (DF): Organização Pan-Americana da Saúde; 2003. p.47-58.
25. Snih SA, Markides KS, Ottenbacher KJ, Raji MA. Hand grip strength and incident ADL disability in elderly Mexicans Americans over a seven-year period. Aging Clin Exp Res. 2004;16(6):481-6. DOI:10.1007/BF03327406
26. Streiner DL, Norman GR. Health measurement scales. 3. ed. Oxford: Oxford University Press; 2003.