Factors Affecting Growth of Tengmalm
’
s Owl
(
Aegolius funereus
) Nestlings: Prey
Abundance, Sex and Hatching Order
Markéta Zárybnická1*, Jan Riegert2, Lucie Brejšková1, JiříŠindelář1, Marek Kouba1, Jan Hanel1, Alena Popelková1, Petra Menclová1, Václav Tomášek1, KarelŠťastný1
1Department of Ecology, Faculty of Environmental Sciences, Czech University of Life Sciences Prague, Prague, Czech Republic,2Department of Zoology, Faculty of Science, University of South Bohemia in České Budějovice,České Budějovice, Czech Republic
Abstract
In altricial birds, energy supply during growth is a major predictor of the physical condition and survival prospects of fledglings. A number of experimental studies have shown that nestling body mass and wing length can vary with particular extrinsic factors, but between-year observational data on this topic are scarce. Based on a seven-between-year observational study in a central European Tengmalm’s owl population we examine the effect of year, brood size, hatching order, and sex on nestling body mass and wing length, as well as the effect of prey abundance on parameters of growth curve. We found that nestling body mass varied among years, and parameters of growth curve, i.e. growth rate and inflection point in particular, increased with increasing abundance of the owl’s main prey (Apodemusmice,
Microtusvoles), and pooled prey abundance (Apodemusmice,Microtusvoles, andSorex
shrews). Furthermore, nestling body mass varied with hatching order and between sexes being larger for females and for the first-hatched brood mates. Brood size had no effect on nestling body mass. Simultaneously, we found no effect of year, brood size, hatching order, or sex on the wing length of nestlings. Our findings suggest that in this temperate owl popu-lation, nestling body mass is more sensitive to prey abundance than is wing length. The lat-ter is probably more limited by the physiology of the species.
Introduction
In altricial birds, phenotypic characteristics of nestlings such as body mass and wing length can affect sibling competition [1,2], nestlings’survival [3,4] and at which age each individual fledges [5]. During the post-fledgling period, the body characteristics affect fledgling survival, behavioural performance and recruitment into the breeding population [6–8]. Energy supply, which is determined by natural food availability and parental effort [9,10], is the main factor determining individual fledglings’body mass [3,4,11–13] and enhances feather growth [13–
15]. In species where asynchronous hatching seems to be an adaptation to unpredictable OPEN ACCESS
Citation:Zárybnická M, Riegert J, Brejšková L,
ŠindelářJ, Kouba M, Hanel J, et al. (2015) Factors Affecting Growth of Tengmalm’s Owl (Aegolius funereus) Nestlings: Prey Abundance, Sex and Hatching Order. PLoS ONE 10(10): e0138177. doi:10.1371/journal.pone.0138177
Editor:Aaron W. Reed, University of Missouri Kansas City, UNITED STATES
Received:May 6, 2015
Accepted:August 27, 2015
Published:October 7, 2015
Copyright:© 2015 Zárybnická et al. This is an open access article distributed under the terms of the
Creative Commons Attribution License, which permits unrestricted use, distribution, and reproduction in any medium, provided the original author and source are credited.
Data Availability Statement:All relevant data are within the paper and its Supporting Information files.
Funding:This study was supported by the Czech University of Life Sciences Prague (CIGA Grant No. 20144203).http://ga.czu.cz/. The funders had no role in study design, data collection and analysis, decision to publish, or preparation of the manuscript.
changes in food supply, the youngest nestling usually dies first due to its poor body condition (i.e. brood reduction theory; [16–20]). This effect is more pronounced during food scarcity [16,19,21]. Simultaneously, nestlings from enlarged broods usually reach a lower body mass and shorter wings compared to those from smaller broods, due to increased sibling competi-tion [22–25]. Moreover, the larger sex usually grows faster than the smaller sex and reaches a higher body mass [26–29]. However, across bird species, particular factors can play different roles. For example, the body condition of Montagu’s harrierCircus pygargusfledglings does not vary according to sex and food abundance [30], the larger sex of marsh harrierCircus aeru-ginosusnestlings has no reduction effect on the smaller sex [28], and brood size in common gracklesQuiscalus quisculahas no effect on nestling body mass [31]. Moreover, despite the rea-sonable amount of existing experimental studies on the differential quantity and quality of fledglings, observational studies remain scarce.
The Tengmalm’s owlAegolius funereusis a nocturnal avian predator with a wide Holartic breeding range [32], feeding mainly on voles in northern areas, and voles and mice in temper-ate areas [33–36]. As in other raptors and owls, eggs are laid at an interval of 1–2 days, and incubation begins after the first or second egg has been laid. Consequently, the nestlings hatch asynchronously and the youngest nestlings usually suffer from a higher mortality risk due to a combination of starvation and sibling aggression [32,37]. The nestlings stay on the nest usually 32 days (range 27−38 days) from hatching [5]. In Tengmalm’s owl, reversed size dimorphism
reaches approximately 30–40% in terms of body mass during the breeding season due to female body reserves for egg production and successful incubation, although the difference is only 4% in body mass and 2.5% in wing length outside the breeding season [38,39]. Hipkiss et al. [3] found that female nestlings in northern populations attained 5% higher asymptotic mass than males, and that experimentally fed nestlings were heavier than control nestlings, suggesting that the females’larger size gave them a competitive advantage against their male siblings dur-ing food scarcity. On the other hand, Kouba et al. [5] demonstrated that wing length is impor-tant measurement of individual quality in Tengmalm’s owl young because it determines the duration of the nestling period (i.e., duration of stay of individual nestlings at the nest box from hatching to fledging). However, between-year observational data on this topic are scarce, as well as no long-term study has focused on the effect of extrinsic factors such as prey abundance, brood size, hatching order, and sex on body mass and wing length in nestlings of raptors in general and Tengmalm’s owl in particular.
In this study, we analyse a seven-year observational data on nestling conditions from a central European population of the Tengmalm’s owl. Specifically, we examine the effect of year, brood size, hatching order, and sex on nestling body mass and wing length, as well as the effect of prey abundance on parameters of growth curve. We hypothesise that (i) body mass and wing length of nestlings (controlled for age) vary among years due to between-year variation in prey abun-dance, and growth parameters (i.e. asymptote, inflection point, and growth rate) increase with prey abundance, (ii) nestlings in smaller broods, as well as (iii) early-hatched brood-mates, attain a higher body mass and wing length (both controlled for age) than nestlings in larger broods and later-hatched brood-mates, and (iv) females attain a higher body mass than males, but not longer wings. To support our results, we also compare main growth parameters (asymptote, inflection point and growth rate) among years, hatching order groups and sexes.
Materials and Methods
Ethics statement
02-OOP/8751/02, 530/758 R/08-Abt/UL, 01220/LP/2008, and 48429/ENV/14-2831/630/14). Owl chicks were handled and ringed under the Ringing Centre of the National Museum in Prague permit No. 329 and 942. Maximum effort was made to reduce handling time.
Study area
The study was conducted in the northern part of the Czech Republic (50°N, 13°E), on the Ore Mountain plateau (elevation: 730–960 m a. s. l.; area: ca 100 km2), from 2006 to 2014, except 2007 (blood of nestlings not available) and 2013 (no nestlings hatched). The study site is charac-terized by a mosaic of small patches of mature Norway SprucePicea abiesforests, fragments of young secondary forests, and open areas with no trees; such a pattern resulted from significant impacts of air pollution towards the end of the 20th century (for details see [40]). In this study site, Tengmalm’s owls breed mainly in nest boxes (>90% of breeding pairs), as naturally
occur-ring cavities for nesting are scarce [40]. The nest boxes were evenly distributed within the study area, and their numbers varied between 116 and 212 (mean ± SE; 159.3 ± 11.5) in different years.
Field procedures
Each year, all nest boxes were inspected from the onset of the breeding period (late March) to the end of the breeding period (July) in intervals of one to three weeks to detect new breeders. Nest boxes found to be occupied were subsequently revisited at a sufficient frequency to assess the number of eggs, hatchlings and hatching date (± 1 day). During the study period of 2006–
2014 (except 2007 and 2013) we found a total of 116 nesting attempts from which 301 nestlings hatched. We weighed, measured and identified the sex of a total of 137 nestlings from 43 nests (Table 1). Owl nestlings were measured at age from 1 to 42 days after hatching (n = 418 mea-surements). Each nestling was measured and weighted on average 3.1-times (SE = 0.1, n = 137 nestlings) during its stay on the nest. The body mass and wing length of the nestlings were measured usually at intervals between one to two weeks. The nestlings were mostly identified according to their rings. When they were too small to be ringed, they were identified according to colour marks under wings or on legs. Number of measurements was during early phases of ontogeny lower compared to late phases (mean chick age during measurement was 21.4 days, SE = 0.4). This was a consequence of tactful research approach during early phase of nestling ontogeny when female often exhibit disturbed behaviour, especially during cold days. Blood samples for molecular sexing (see below) were taken from each nestling by brachial vein punc-ture under the wing, around 14–21 days after hatching.
Prey abundance
The abundance of small mammals was assessed using snap-traps (baited with flour roasted on bacon). Trapping was carried out at the beginning of June each year by setting up snap-traps in
Table 1. Prey abundance index (expressed by number of trapped individuals per 100 trap nights) of separate prey groups, number of nests and number of nestlings measured in each study year.Means (per one hectare trapping area or nest)±SE are shown.
Year Apodemusmice Microtusvoles Sorexshrews Pooled prey abundance No. nests No. nestlings per nest
2006 0.00 0.28±0.16 0.00 0.28±0.16 9 3.33±0.29
2008 0.64±0.24 0.09±0.09 0.18±0.18 0.92±0.37 6 3.17±0.48
2009 0.28±0.00 0.64±0.24 0.00 0.92±0.24 7 2.00±0.22
2010 3.49±1.30 1.93±0.64 0.09±0.09 5.51±1.88 6 5.83±0.75
2011 0.00 0.18±0.09 0.00 0.18±0.09 5 2.00±0.55
2012 1.56±0.60 0.28±0.16 0.28±0.16 2.11±0.72 2 5.00±0.00
2014 0.28±0.28 0.09±0.28 0.09±0.09 0.46±0.24 8 2.38±0.46
three one-hectare areas (11 × 11 trap grid; span of 10 m). The traps were left out for three days and checked every morning. We calculated the abundance index of small mammals as the number of captured individuals per 100 trap nights in each trapping area. All captured mam-mals (n = 186 individuals, 7 years) were identified to species level and grouped into three prey categories according to the Tengmalm’s owl diet:Microtusvoles (field voleM.agrestis, com-mon voleM.arvalisand European pine voleM.subterraneus),Apodemusmice (yellow-necked mouseA.flavicollisand wood mouseA.sylvaticus), andSorexshrews (common shrewS. ara-neusand pygmy shrewS.minutus) (for details see [34,41]).
Laboratory work
Sex identification from blood samples was carried out using molecular biology techniques involving PCR with primers related to the CHD gene [42]. Genomic DNA from blood samples was extracted by alkaline lysis following a neutralization step [43]. A small amount (3–5μl) of
blood suspension in 96% ethanol was briefly spun down, alcohol was decanted and samples were dried out at room temperature. Into each sample, 50μl of alkaline lysis buffer (25 mM
NaOH, 0.2 mM disodium EDTA, pH 12) was added and heated to 96°C for 10 min. The sam-ples were then cooled down on ice and 50μl of neutralization buffer (40 mM Tris-HCl, pH 5)
was added. As a template for PCR, 1–2μl of mixture was used. Alternatively, the Chelex100
Resin (BioRad) DNA extraction method can also be used [44]. The 150μl of 5% Chelex100
solution in sterile water was mixed in a microcentrifuge tube with the blood sample, briefly vortexed and incubated at 56°C for 30 min. After another vortexing followed an 8 min incuba-tion step at 96°C, and samples were then vortexed again. The final step was centrifugaincuba-tion at 10 000 g for 10 min. The supernatant was directly used as a template for PCR. Each PCR reaction was performed in 20μl. We used the primers 2550F(5'-GTTACTGATTCGTCTACGAGA-3')
and 2718R (5'-ATTGAAATGATCCAGTGCTTG-3'), as described by Fridolfsson and Ellegren [42]. The PCR mastermix was prepared according to the Taq DNAPolymerase (NewEngland Biolabs) manufacturer’s guidelines. The PCR conditions were optimized to initial denaturation for 5 min at 95°C, followed by 29 cycles of denaturation at 95°C for 30 s, annealing at 60°C for 40 s, an extension at 72°C for 1 min 10 s, and a final extension at 72°C for 5 min. At the end of the PCR program, the amplified samples were loaded into wells on agarose gel (1% w/v) stained with ethidium bromide. Bands along the DNA molecular marker were detected and photo-graphs taken under UV light. In Tengmalm’s owl, this pair of primers produces a single Z-band (700 bp) in males, and Z- (700 bp) and W- (1200 bp) Z-bands in females [45].
Statistical analyses
anova command, starting with comparison of first model with factor with null model without factors. We used forward selection, factors were added to the model based on Akaike’s infor-mation criterion (AIC) using Akaike’s weights. Percentages of variability explained by the tested factors were computed as the ratio between decrease of deviance of each model and pre-vious model. We also show the values of the Chi-squared statistic. Because body mass was not meaningful to show standing alone, we present results of above mentioned analysis as body mass increase per day (g/day). Post-hoc comparisons of changes in daily increase of body mass among years and hatching order categories were calculated in R software using glht function.
To support above mentioned models, we also calculated growth and showed parameters for each year, hatching order group and sex using logistic growth curves fitted by non-linear regression based on the formulay=A/ (1 + e ^ (−K× (x−Ti)) (Starck and Ricklefs [47],
whereyis nestling body mass,xis nestling age,Ais an asymptotic—maximal—value,Kis growth rate, andTiis the inflexion point). Iterations were carried out using non-linear estima-tion in Statistica v. 12. 9 [48]. Using this software, we also calculated linear regressions for par-ticular relationships between the above-mentioned parameters of the growth curve and prey abundance (Microtusvoles,Apodemusmice, and pooled prey abundance index, which includedMicrotusvoles,Apodemusmice andSorexshrews). We present all relevant data used in the analyses in (S1 Dataset).
Results
The abundance index of the most frequent prey groups of Tengmalm’s owl in our study area varied among years:Apodemusmice were the most abundant prey group overall and had the most pronounced between-year fluctuations (mean ± SE; 1.14 ± 1.57 individuals per 100 trap nights), followed byMicrotusvoles (0.48 ± 0.59 individuals per 100 trap nights), andSorex
shrews (0.14 ± 0.18 individuals per 100 trap nights) (Table 1).
We found that nestling body mass, controlled for age, significantly varied among study years, hatching order groups and sexes (Table 2). Daily increase of body mass among years var-ied between 4.4 and 6.5 (mean ± SE, 5.4 ± 0.2, Post-hoc Tukey test, minimal p<0.01 between
maximum and minimum in the years 2008 and 2011, respectively). Within a brood, the older nestlings reached a larger daily body mass increase (min-max: 5.2–5.5, mean ± SE; 5.4 ± 0.1, Post-hoc Tukey test, minimal p = 0.07 between first and last age categories). Body mass increase was higher in females compared to males (5.7 ± 0.1 and 5.2 ± 0.1, respectively). These results can be also supported by comparing growth parameters between above mentioned cate-gories; early hatched young showed higher asymptote and inflexion point, and lower growth rate than late hatched young (Table 3). Similarly, females reached higher asymptote and inflec-tion point, and lower growth rate than males (Table 3). After hatching (1–3 d after hatching), females were on average 2.1 g (n = 11 individuals) heavier than males, and they were also 8.2 g (n = 52 individuals) heavier during the fledging period (i.e., 30–36 d after hatching;Fig 1). Brood size was not recommended to be added to the model using the AIC criterion. Similarly,
Table 2. Effects of the tested factors on nestling body mass, based on Gaussian GLMM models with nestling age as covariate and nestling individual and nest as random factors (n = 137 nestlings from 43 broods).Explained variability is shown in cumulative way.
Model Explained variability (%) DF Chi p
Mass ~ Year 0.6 236 24.1 <0.01
Mass ~ Year + Sex 0.7 235 7.3 <0.01
Mass ~ Year + Sex + Hatching order group 0.9 233 8.3 0.02
no factor was recommended to be added to the model when nestling wing length was a depen-dent variable.
Further analyses on growth parameters showed that growth rate was positively correlated withApodemusmouse index (regressions, n = 7 years: beta = 0.979,F= 114.25, p<0.01;Fig 2A),Microtusvole index (beta = 0.862,F= 14.464, p = 0.01;Fig 2B) and pooled prey abun-dance index (beta = 0.980,F= 119.94, p<0.01;Fig 2C). Inflection point was positively
corre-lated withApodemusmouse index (beta = 0.799,F= 8.818, p = 0.03;Fig 2D) and pooled prey abundance index (beta = 0.864,F= 14.764, p = 0.01;Fig 2F). No relationship was found between inflection point andMicrotusvole index (beta = 0.521,F= 1.862, p = 0.23;Fig 2E) or
Sorexshrew index (beta = 0.645,F= 3.556, p = 0.12), nor growth rate andSorexshrew index (beta = 0.314,F= 0.546, p = 0.50). Finally, the yearly asymptote of body mass was not related to the abundance of any prey group index (Apodemusmice, beta =−0.22,F= 0.244, p = 0.64; Microtusvoles, beta =−0.16,F= 0.14, p = 0.73;Sorexshrews, beta = 0.058,F= 0.017, p = 0.90;
pooled prey abundance index, beta =−0.30,F= 0.486, p = 0.52).
Discussion
Body mass
In accordance with our first hypothesis, we found that the body mass of nestlings controlled for age varied among years. Simultaneously, the yearly growth rate and inflection point increased (i.e., nestlings grew faster and for a longer period) with increasing prey abundance index. This effect was most pronounced during the peak years ofApodemusmice andMicrotus
voles. No relationship was found between the asymptote of nestling body growth (i.e. maximal nestling mass) and prey abundance index. Eldegard & Sonerud [10] documented that supple-mental feeding led to parental allocation of food for self-maintenance rather than to higher body mass of Tengmalm’s owl nestlings. On the other hand, Hipkiss et al. [3] showed that the asymptote of Tengmalm’s owl nestling body mass increased in experimentally fed broods, but no relationship was found between the rate of mass gain and food supplementation. In this light, Kouba et al. [49] demonstrated that Tengmalm’s owl parents produced nestlings with
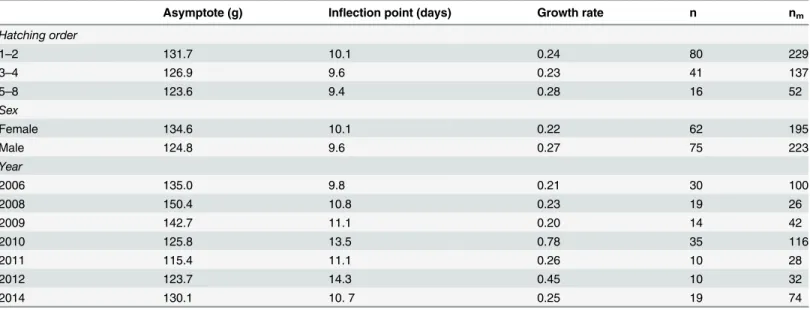
Table 3. Parameters of the growth curve for Tengmalm’s owl nestlings related to year, hatching order and the sex of nestlings.The asymptote (maximal body mass), inflection point and growth rate are shown (n = number of nestlings measured; nm= number of measurements).
Asymptote (g) Inflection point (days) Growth rate n nm
Hatching order
1–2 131.7 10.1 0.24 80 229
3–4 126.9 9.6 0.23 41 137
5–8 123.6 9.4 0.28 16 52
Sex
Female 134.6 10.1 0.22 62 195
Male 124.8 9.6 0.27 75 223
Year
2006 135.0 9.8 0.21 30 100
2008 150.4 10.8 0.23 19 26
2009 142.7 11.1 0.20 14 42
2010 125.8 13.5 0.78 35 116
2011 115.4 11.1 0.26 10 28
2012 123.7 14.3 0.45 10 32
2014 130.1 10. 7 0.25 19 74
different body mass during a two-year period with extremely different prey abundance ( Apode-musmouse peak compared to a poor rodent year), but Valkama et al. [16] found that the body condition (expressed by residuals of the regression between body mass and wing length) of fledged Tengmalm’s owlets was not associated with the phase of the vole cycle. Similarly incon-sistent results were documented in other owl species, e.g. supplementary food resources have been found to affect the growth rate of little owlAthene noctua, burrowing owlAthene cunicu-lariaor Ural owlStrix uralensisnestlings [4,12,19], however, the body condition of Montagu’s harrierCircus pygargusduring fledging (expressed by the difference between measured body mass and the asymptotic body mass) did not vary according to vole cycles [30]. We suggest that the body mass of the Tengmalm’s owl nestlings in a temperate areas varies under natural prey abundance, but other factors, such as clutch size adjustment by females [50,51], the feed-ing effort of males [52,53], or variable environmental conditions (e.g. the night length which can limit foraging time of owls, as well as the level of interspecific competition with other vole-eating predators [50,54]), may play important roles.
The body mass of nestlings can be affected by brood size. For example, Eurasian kestrel
Falco tinnunculusnestlings showed increased mortality and reduced growth rate when broods were experimentally enlarged, even when parents increased their hunting effort [22]. Similarly,
Fig 1. Relationships between the growth rate of Tengmalm’s owl nestlings and prey abundance index (number of individuals per 100 trap nights) of Apodemus mice (a), Microtus voles (b) and index of pooled prey abundance (c), and the relationship between the inflection point of Tengmalm’s owl nestlings and prey abundance index of Apodemus mice (d), Microtus voles (e) and index of pooled prey abundance (f).Lines denote curves fitted by regression.
experimental brood enlargement in barn owlTyto albaled to increased nestling mortality and decreased body mass of the surviving male and female nestlings [24]. Also, in a northern popu-lation of Tengmalm’s owl, nestlings in larger broods suffered from higher mortality and fledg-lings from larger broods tended to reach a lower mass than those in reduced or control broods [16,55]. We found no effect of brood size on nestling body mass in the natural environments of this temperate Tengmalm’s owl population, thus rejecting our second hypothesis. Tengmalm’s owl females in temperate areas adjusted their clutch size better than females in northern areas, where prey availability is less predictable, which can lead to a clutch size larger than optimal and increased nestling mortality [50]. In light of the mentioned effect of latitude, we suggest that no effect of brood size on nestling body mass was found in our study population because females adjusted their clutch and brood size depending on prey availability.
In agreement with our third hypothesis, we found that early-hatched nestlings reached a larger body mass, and showed higher asymptote and inflection point, compared to late-hatched nestlings. Similarly, in Montagu’s harrier, Arroyo et al. [30] found the poorest fledgling condition in the youngest nestlings. Also, in other owl species (e.g., little owl, burrowing owl, Ural owl), hatching order has been found to affect growth rate [4,12,19]. In our study, late-hatched nestlings suffered from poor body condition, supporting that hatching asynchrony in Tengmalm’s owl is an adaptive way to optimize brood size under varying environmental conditions (see also [16]).
In keeping with our fourth hypothesis, we found that female nestlings reached a higher body mass than male nestlings during their time in the nest, and thus a higher asymptote and inflexion point was found in females compared to males. This finding corresponds with the results of Hipkiss et al. [3], who suggested that the female’s larger size gives them a competitive advantage over their male siblings during fights over food items [56].
Wing length
Despite adult female Tengmalm’s owls having slightly longer wings than males, no male-female difference in wing length was found in nestlings. Similarly, in marsh harrierCircus aeruginosus, Krijgsveld et al. [28] found no difference between the sexes in wing length, although female fledglings were heavier than males. Our results also agree with the finding of Hipkiss et al. [3] that juvenile Tengmalm’s owl females require more time to fully develop their wings than males. Furthermore, we found no effect of year, brood size, hatching order or prey abundance index on the wing length of nestlings. These findings are in contrast to the two-year study per-formed in the same study area by Kouba et al. [49], in which owl parents produced nestlings with longer wings during anApodemuspeak year (2010), compared to a poor rodent year (2011). In our seven-year dataset (2006–2014, excluding 2007 and 2013), we recorded no occurrence of extremely high prey abundance, except in one year (2010). The disunity of these results indicates that wing length can differ under extremely different food conditions, but the differences are not pronounced when food availability is relatively stable. This finding is quite unexpected, because the individual duration of nestling periods is related to wing length rather than body mass, sex, prey abundance index or weather conditions [5].
Conclusions
No factor affected wing length growth, while the body mass of nestlings controlled for age var-ied among years, hatching order groups and sexes. Growth parameters were affected by prey
Fig 2. Logistic growth curve for body mass of male (n = 75 individuals) and female (n = 62 individuals) Tengmalm’s owl nestlings.Open circles and black line represent males; filled circles and grey line represent females. Formula for females:y= 134.62 / (1 + e^ (−0.22 × (x−10.19))); formula for males:
y= 124.80 / (1 + e^ (−0.27 × (x−9.61))).
abundance and also differed between sexes and with hatching order. Thus, the body mass of nestlings seems to be more sensitive than wing length to environmental factors. The latter is probably controlled more by the physiology of the species.
Supporting Information
S1 Dataset. Relevant data used in the analyses.
(PDF)
Acknowledgments
We are grateful to V. Bejček, F. Sedláček, J. Zima, J. Vilímová, and P.Šímová for their assistance
in the field. This study was supported by the Czech University of Life Sciences Prague (CIGA Grant No. 20144203).
Author Contributions
Conceived and designed the experiments: MZ. Performed the experiments: MZ JR. Analyzed the data: JR MZ. Contributed reagents/materials/analysis tools: MZ JS MK JH AP PM VT KS. Wrote the paper: MZ JR. DNA analyses: LB.
References
1. Gottlander K (1987) Parental feeding behavior and sibling competition in the pied flycatcherFicedula hypoleuca. Ornis Scan 18: 269–276.
2. Fujioka M (1985) Sibling competition and siblicide in asynchronously hatching broods of the cattle egret Bubulcus ibis. Anim Behav 33: 1228–1242.
3. Hipkiss T, Hörnfeldt B, Eklund U, Berlin S (2002) Year-dependent sex-biased mortality in supplemen-tary-fed Tengmalm's owl nestlings. J Anim Ecol 71: 693–699.
4. Perrig M, Grüebler MU, Keil H, Naef-Daenzer B (2014) Experimental food supplementation affects the physical development, behaviour and survival of Little OwlAthene noctuanestlings. Ibis 156: 755–
767.
5. Kouba M, BartošL, Korpimäki E, Zárybnická M (2015) Factors affecting the duration of nestling period
and fledging order in Tengmalm’s owl (Aegolius funereus): effect of wing length and hatching sequence. PLoS ONE 10: e0121641. doi:10.1371/journal.pone.0121641PMID:25793880
6. Verboven N, Visser ME (1998) Seasonal variation in local recruitment of great tits: the importance of being early. Oikos 81: 511–524.
7. Naef-Daenzer B, Widmer F, Nuber M (2001) Differential post-fledging survival of great and coal tits in relation to their condition and fledging date. J Anim Ecol 70: 730–738.
8. Naef-Daenzer B, Grüebler MU (2008) Post-fledging range use of Great TitParus majorfamilies in rela-tion to chick body condirela-tion. Ardea 96: 181–190.
9. Zárybnická M (2009) Parental investment of female Tengmalm's owlsAegolius funereus: correlation with varying food abundance and reproductive success. Acta Ornithol 44: 81–88.
10. Eldegard K, Sonerud GA (2010) Experimental increase in food supply influences the outcome of within-family conflicts in Tengmalm’s owl. Behav Ecol Sociobiol 64: 815–826.
11. Santangeli A, Hakkarainen H, Laaksonen T, Korpimäki E (2012) Home range size is determined by habitat composition but feeding rate by food availability in male Tengmalm’s owls. Anim Behav 83: 1115–1123.
12. Karell P, Pietiainen H, Siitari H, Pihlaja T, Kontiainen P, Brommer JE (2009) Parental allocation of addi-tional food to own health and offspring growth in a variable environment. Can J Zool 87: 8–19. 13. Kouba M, BartošL,Šťastný K (2013) Differential movement patterns of juvenile Tengmalm's owls
(Aegolius funereus) during the post-fledging dependence period in two years with contrasting prey abundance. PLoS ONE 8: e67034. doi:10.1371/journal.pone.0067034PMID:23843981
15. Granbom M, Smith HG (2006) Food limitation during breeding in a heterogeneous landscape. Auk 123: 97–107.
16. Valkama J, Korpimäki E, Holm A, Hakkarainen H (2002) Hatching asynchrony and brood reduction in Tengmalm's owlAegolius funereus: the role of temporal and spatial variation in food abundance. Oeco-logia 133: 334–341.
17. Lack D (1954) The natural regulation of animal numbers. London: Clarendon Press.
18. Roulin A (2002) Short- and long-term fitness correlates of rearing conditions in Barn OwlsTyto alba. Ardea 90: 259–267.
19. Haley KL, Rosenberg DK (2013) Influence of food limitation on reproductive performance of burrowing owls. J Raptor Res 47: 365–376.
20. Massemin S, Korpimäki E, Pöyri V, Zorn T (2002) Influence of hatching order on growth rate and resting metabolism of kestrel nestlings. J Avian Biol 33: 235–244.
21. Wiebe KL, Korpimäki E, Wiehn J (1998) Hatching asynchrony in Eurasian kestrels in relation to the abundance and predictability of cyclic prey. J Anim Ecol 67: 908–917.
22. Dijkstra C, Bult A, Bijlsma S, Daan S, Meijer T, Zijlstra M (1990) Brood size manipulations in the kestrel (Falco tinnunculus)—effects on offpring and parental survival. J Anim Ecol 59: 269–285.
23. Korpimäki E, Rita H (1996) Effects of brood size manipulations on offspring and parental survival in the European kestrel under fluctuating food conditions. Ecoscience 3: 264–273.
24. Roulin A, Ducrest AL, Dijkstra C (1999) Effect of brood size manipulations on parents and offspring in the barn owlTyto alba. Ardea 87: 91–100.
25. Musgrove AB, Wiebe KL (2014) Northern Flickers increase provisioning rates to raise more but poorer quality offspring when given experimentally enlarged broods. Auk 131: 571–582.
26. Anderson DJ, Reeve J, Gomez JEM, Weathers WW, Hutson S, Cunningham HV, et al. (1993) Sexual size dimorphism and food-requirements of neslting birds. Can J Zool 71: 2541–2545.
27. Townsend HM, Maness TJ, Anderson DJ (2007) Offspring growth and parental care in sexually dir-norphic Nazca boobies (Sula granti). Can J Zool 85: 686–694.
28. Krijgsveld KL, Dijkstra C, Visser GH, Daan S (1998) Energy requirements for growth in relation to sex-ual size dimorphism in marsh harrierCircus aeruginosusnestlings. Phys Zool 71: 693–702.
29. Lok T, Overdijk O, Piersma T (2014) Interpreting variation in growth of Eurasian Spoonbill chicks: disen-tangling the effects of age, sex and environment. Ardea 102: 181–194.
30. Arroyo BE, De Cornulier T, Bretagnolle V (2002) Parental investment and parent-offspring conflicts dur-ing the postfledgdur-ing period in Montagu's harriers. Anim Behav 63: 235–244.
31. Maddox JD, Weatherhead PJ (2012) Discrepancy between factors affecting nestling growth and sur-vival and maternal success in Common Grackles. J Field Ornithol 83: 17–25.
32. Mikkola H (1983) Owls of Europe. Calton: Poyser.
33. Korpimäki E (1988) Diet of breeding Tengmalm's owlsAegolius funereus: long-term changes and year-to-year variation under cyclic food conditions. Ornis Fenn 65: 21–30.
34. Zárybnická M, Riegert J,Šťastný K (2013) The role ofApodemusmice andMicrotusvoles in the diet of the Tengmalm’s owl in Central Europe. Pop Ecol 55: 353–361.
35. Zárybnická M, Riegert J,Šťastný K (2011) Diet composition in the Tengmalm's OwlAegolius funereus: a comparision of camera surveillance and pellet analysis. Ornis Fenn 88: 147–153.
36. Zárybnická M (2009) Activity patterns of male Tengmalm’s owls,Aegolius funereusunder varying food conditions. Folia Zool 58: 104–112.
37. Newton I (1979) Population ecology of raptors. Berkhamsted: Poyser.
38. Hipkiss T (2002) Sexual size dimorphism in Tengmalm's owl (Aegolius funereus) on autumn migration. J Zool 257: 281–285.
39. Korpimäki E (1990) Body mass of breeding Tengmalm's OwlsAegolius funereus: seasonal, between-year, site and age-related variation. Ornis Scan 21: 169–178.
40. Zárybnická M, Riegert J,Šťastný K (2015) Non-native spruce plantations represent a suitable habitat
for Tengmalm's Owl (Aegolius funereus) in the Czech Republic, Central Europe. J Ornithol 156: 457–
468.
41. Zárybnická M, Riegert J, Kouba M (2015) Indirect food web interactions affect predation of Tengmalm's Owls Aegolius funereus nests by Pine MartensMartes martesaccording to the alternative prey hypoth-esis. Ibis 157: 459–467.
43. Truett GE, Heeger P, Mynatt RL, Truett AA, Walker JA, Warman ML (2000) Preparation of PCR-quality mouse genomic DNA with hot sodium hydroxide and tris (HotSHOT). Biotechniques 29: 52–54. PMID:
10907076
44. Walsh PS, Metzger DA, Higuchi R (1991) Chelex 100 as a medium for simple extraction of DNA for PCR-based typing from forensic material. Biotechniques 10: 506–513. PMID:1867860
45. Hörnfeldt B, Hipkiss T, Fridolfsson AK, Eklund U, Ellegren H (2000) Sex ratio and fledging success of supplementary-fed Tengmalm's owl broods. Mol Ecol 9: 187–192. PMID:10672162
46. R Development Core Team (2011) R: A language and environment for statistical computing. Vienna, Austria: R Found Stat Comp.
47. Starck JM, Ricklefs RE (1998) Avian growth and development. Evolution within the altricial-precocial spectrum. New York: Oxford University Press.
48. StatSoft I (2013) STATISTICA (data analysis software system), version 12.
49. Kouba M, BartošL,Šťastný K (2014) Factors affecting vocalization in Tengmalm's owl (Aegolius funer-eus) fledglings during post-fledging dependence period: scramble competition or honest signalling of need? PLoS ONE 9: e95594. doi:10.1371/journal.pone.0095594PMID:24760102
50. Zárybnická M, Sedláček O, Salo P,Šťastný K, Korpimäki E (2015) Reproductive responses of
temper-ate and boreal Tengmalm’s OwlAegolius funereuspopulations to spatial and temporal variation in prey availability. Ibis 157: 369–383.
51. Korpimäki E, Hakkarainen H (1991) Fluctuating food-supply affects the clutch size of Tengmalm's owl independent of laying date.Oecologia 85: 543–552.
52. Zárybnická M, Sedláček O, Korpimäki E (2009) Do Tengmalm’s Owls alter parental feeding effort under varying conditions of main prey availability? J Ornithol 150: 231–237.
53. Zárybnická M, Vojar J (2013) Effect of male provisioning on the parental behavior of female Boreal OwlsAegolius funereus. Zool Stud 52: 36.
54. Zárybnická M, Korpimäki E, Griesser M (2012) Dark or short nights: differential latitudinal constraints in nestling provisioning patterns of a nocturnally hunting bird species. PLoS ONE 7: e36932. doi:10. 1371/journal.pone.0036932PMID:22615850
55. Korpimäki E (1988) Costs of reproduction and success of manipulated broods under varying food con-ditions in Tengmalm's owl. J Anim Ecol 57: 1027–1039.