Surveillance of the Incidence of
Non-Communicable Diseases (NCDs) with Sparse
Resources: A Simulation Study Using Data
from a National Diabetes Registry, Denmark,
1995
–
2004
Ralph Brinks1,2*, Annika Hoyer1, Sandra Landwehr3
1German Diabetes Center, Institute for Biometry and Epidemiology, Duesseldorf, Germany,2University Hospital Duesseldorf, Hiller Research Unit for Rheumatology, Duesseldorf, Germany,3University Hospital Duesseldorf, Department for Statistics in Medicine, Duesseldorf, Germany
*ralph.brinks@ddz.uni-duesseldorf.de
Abstract
We propose two new methods to estimate secular trends in the incidence of a chronic dis-ease from a series of prevalence studies and mortality data. One method is a direct inver-sion formula, the second method is a least squares estimation. Both methods are validated in a simulation study based on data from a diabetes register. The results of the validation show that the proposed methods may be useful in epidemiological settings with sparse resources, where running a register or a series of follow-up studies is difficult or impossible.
Introduction
In 2010, more than 65% of all global deaths were caused by non-communicable diseases (NCDs) such as cancer, cardiovascular and chronic respiratory diseases, diabetes and neurolog-ical disorders [1]. Compared to 1990, not only did the absolute number of NCD-attributable deaths rise from 27 to 35 million, but the proportion of deaths attributable to NCDs also rose (1990: 57%).
The enormous and increasing burden of NCDs have attracted the highest political councils, which, for instance, led to a resolution of the United Nations’General Assembly [2]. The reso-lution demands strengthening of country-level surveillance systems for risk factors, determi-nants of health and health outcomes. This includes national surveillance of the prevalence and incidence of NCDs. Surveillance of prevalence alone is not always reasonable. The prevalence of a chronic disease may even increase though the incidence remains unchanged. The rise in prevalence may be due to improved survival of prevalent cases, which in turn may be due to improved disease treatment. Thus, surveillance of theincidenceof NCDs is necessary as well. Secular trends of NCD incidences are especially important because they indicate changes in the risk profile of the population under consideration. Moreover, surveillance of temporal changes
OPEN ACCESS
Citation:Brinks R, Hoyer A, Landwehr S (2016) Surveillance of the Incidence of Non-Communicable Diseases (NCDs) with Sparse Resources: A Simulation Study Using Data from a National Diabetes Registry, Denmark, 1995–2004. PLoS ONE 11(3): e0152046. doi:10.1371/journal.pone.0152046
Editor:Dena L. Schanzer, Public Health Agency of Canada, CANADA
Received:August 29, 2015
Accepted:March 8, 2016
Published:March 29, 2016
Copyright:© 2016 Brinks et al. This is an open access article distributed under the terms of the
Creative Commons Attribution License, which permits unrestricted use, distribution, and reproduction in any medium, provided the original author and source are credited.
Data Availability Statement:Data are from a previous publication: Carstensen B, Kristensen JK, Ottosen P, Borch-Johnsen K. The Danish National Diabetes Register: Trends in Incidence, Prevalence and Mortality. Diabetologia. 2008;51(12):2187-2196.
of the incidence may be helpful to judge effectiveness of population-based prevention pro-grams, e.g., tobacco control programs in the US [3].
Common ways to detect secular trends in the incidence are to either performing a series of follow-up studies or to run a register. Both approaches may be expensive and time consuming. Furthermore, they both may lead to a variety of practical problems. As an example, consider a follow-up study where the people contracting the outcome, i.e., the cases, may feel stigmatized. This is likely to lead to a loss of follow-up among the the group of cases, possibly at a higher percentage than in the non-cases. In contrast, a series of cross-sectional studies can sometimes be easier to accomplish—and may lead to more valid estimates. An example of a periodically published summary of cross-sectional studies is the Diabetes Atlas of the International Diabe-tes Federation [4].
In [5] we described a method in which two cross-sectional studies combined with mortality information can be used to estimate the incidence of a chronic disease. Here we take this approach further and describe how a series of cross-sections can examine possible trends in the incidence of NCDs without the need to run a disease register and without a series of follow-up studies.
The next section introduces the necessary theoretical background for the methods. In the third section the theory is applied to data from a diabetes register in Denmark. The register observed an increasing incidence of diabetes between 1995 and 2004. We show that the trend is detectable using a sequence of prevalence and mortality data. The prevalence data can be obtained by cross-sectional studies and the mortality data may originate from official vital sta-tistics and, for example, from case-control studies. The use of costly and lengthy follow-up studies is not always necessary.
Illness-Death Model
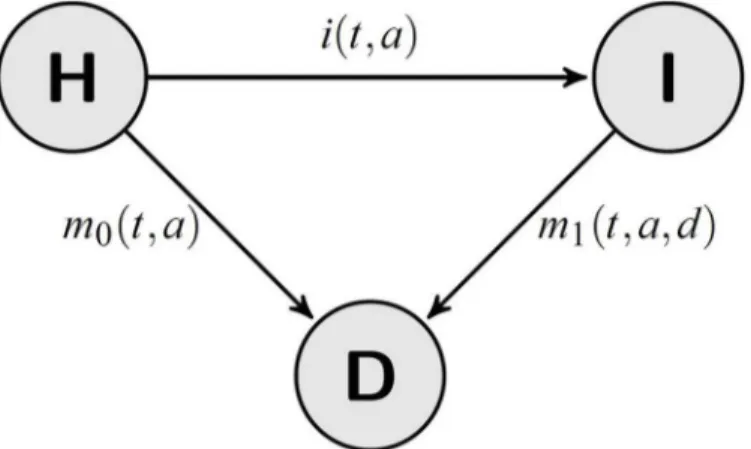
In modeling chronic (irreversible) diseases, the three-state model (compartment model) inFig 1is often used. This model is often called theillness-death model(IDM) [6] and dates back to at least 1951 [7]. The role of the IDM in biostatistics can hardly be valued enough. For example, it contributed to the development of the famous Kaplan-Meier estimator in survival and failure time analysis [8].
Let the number of persons in the statesHealthy (H)andIll (I)of the IDM be denoted byS
andC, respectively. There are historical reasons for using the terminologiesS(susceptibles)
Fig 1. Chronic disease model with three states and the corresponding transition rates.People in the stateHealthy (H)are healthy with respect to the disease under consideration. After onset of the disease, they transition to the stateIll (I).
doi:10.1371/journal.pone.0152046.g001 Competing Interests:The authors have declared
andC(cases). The transition intensities (synonym: rates) between the states are: the incidence rateiand the mortality ratesm0andm1of healthy and diseased persons, respectively. These
rates and the numbersSandCgenerally depend on the calendar timet, the ageaand in the case of the mortalitym1also on the durationdof the disease. Although the following
deriva-tions hold true ifm1depends ond[5], for ease of notation we assume hereinafter thatm1is
independent fromd.
In [9] we showed how the ratesi,m0, andm1, are related to the age-specific prevalence pðt;aÞ ¼ Cðt;aÞ
Sðt;aÞþCðt;aÞ:If we consider only chronic diseases acquired after birth, i.e.,p(t, 0) = 0 for
all timest, then, for differentiable ratesi,m0, andm1, the age-specific prevalencep(t,a) is the
unique solution of a partial differential equation (PDE) and the associated initial condition:
ð@tþ@aÞp¼ð1 pÞ i p m
1 m0
ð Þ
ð Þ ð1Þ
pðt;0Þ ¼0: ð2Þ
Here, the notation@x¼ @
@x; x2 ft;ag;has been used. The partial differential Eqs (1) and (3) use the assumption that the persons who immigrate into or emigrate from the considered population have the same disease prevalence as the resident population. If this assumption does not hold true, the partial differential equation becomes slightly more complicated [9].
Typically, the mortality ratem0for the healthy persons is not known, but the general
mor-talitym=pm1+ (1−p)m0, and the relative mortalityR¼m1m0are known. Therefore,Eq (1) becomes
ð@tþ@aÞp¼ð1 pÞ i m p Rð 1Þ
p Rð 1Þ þ1
: ð3Þ
Note that the fraction on the right-hand side of the PDEEq (3)is thepopulation attributable risk (PAR), which describes the proportion of deaths attributable to the chronic disease [10].
Direct estimation of the age-specific incidence
Eqs (1) and (3) can be solved for the incidence rate. Forp(t,a)6¼1 it holds
iðt;aÞ ¼ð@tþ@aÞpðt;aÞ
1 pðt;aÞ þpðt;aÞðm1ðt;aÞ m0ðt;aÞÞ
¼ð@tþ@aÞpðt;aÞ
1 pðt;aÞ þmðt;aÞ
pðt;aÞðRðt;aÞ 1Þ pðt;aÞðRðt;aÞ 1Þ þ1:
ð4Þ
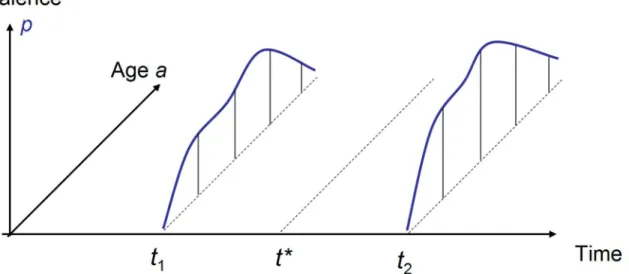
These equations have an important consequence: they make it possible to estimate the age-specific incidence rate from two prevalence studies. Consider the situation where the age-spe-cific prevalencep(t,a) is given for two points in timet=t1andt=t2, wheret1<t2. Assume
further that the general mortalitymand the relative mortalityRare given at some timet?
wheret1<t?<t2. This situation is depicted inFig 2.
Least squares estimation of the age-specific incidence
In epidemiological applications thep(t,a) are sampled at discrete agesak,k= 1,. . .,K.
Further-more, we assume that we know the general mortality ratemand the relative mortalityRat some timet?wheret1<t?<t2.
Typically, thep(tj,ak),j= 1, 2,k= 1,. . .,K, are subject to sampling uncertainty. Letσjk
denote the standard error ofp(tj,ak).
For a moment let us assume that we knowpatt?, and that we have a“guess”of the age-spe-cific incidencei(g)(t?,). Then, we can use the PDEEq (3)to approximatepatt2by
p t2;ajiðgÞ ¼: p t?
;a h2
ð Þ þh2ð@tþ@aÞp t
?
;a h2ji ðgÞ
ð5Þ
whereh2=t2−t?and¼
:
denotes thefirst order approximation. The values of the partial deriva-tive (@t+@a)pare calculated by the right-hand side of the associatedEq (3).
Similarly, we can approximatepatt1:
p t1;ajiðgÞ ¼: p t?
;a h1
ð Þ h1ð@tþ@aÞp t
?
;a h1ji ðgÞ
ð6Þ
whereh1=t?−t1.
Asi(g)was based on an initial guess, the calculated values forp(tj,a|i(g)),j= 1, 2, are likely to deviate from the measured valuesp(tj,ak).
Therefore, define the sum of the standardized squared errorX2(i(g)) as
X2 iðgÞ
≔ X
j;k
jpðtj;akÞ pðtj;akji
ðgÞÞj2
s2
jk
: ð7Þ
Then, estimation of the incidenceican be written in terms of a minimization problem:
i¼arg min iðgÞ0 X
2 iðgÞ
: ð8Þ
Thus,iis the weighted least squares solution, which minimizes the squared deviation between the estimated and measuredpint1andt2. Underlying this minimization approach is
Fig 2. Two age courses of the prevalence surveyed att1andt2are necessary to estimate the age-specific incidence at some point in timet?.
the idea that the errorp(tj,ak)−p(tj,ak|i(g)) is approximately normally distributed with a mean
of zero and a standard deviationσjk[11].
So far, we have assumed that we knowpat timet?, which is not the case if we have only data from two cross-sections att1andt2. In this case, we can approximatep(t?,a) using
pðt?
;aÞ ¼: h2 h1þh2
pðt1;a h1Þ þ h1 h1þh2
pkðt2;aþh2Þ:
By applying the direct or the least squares estimators of the incidence consecutively for a series of cross-sections att1<t2< <tn, we are able to estimate trends in the incidence. This is shown in the next section.
Validation of the Method: Diabetes in Denmark
Based on data from the Danish Diabetes Register, we first simulate a sequence of cross-sec-tional studies for the years 1995–2004. Next, we estimate the age-specific incidence rates by repetitively applying the methods described above to the simulated prevalence data. We assume that the general mortality in the population (m) and the relative mortalityR¼m1
m0are known. Finally, the incidence rate used as input for the simulation—we will call it the“true incidence”—and the estimated incidence are compared in terms of the absolute relative error.
Simulation of a series of cross-sections
The data used for the simulation are based on a complete survey of physician diagnosed diabe-tes (type 1 and type 2 diabediabe-tes) in the Danish population (n>5 million) [12]. For this valida-tion task we confine ourselves to the male populavalida-tion aged30. We do not use individual-level data, only (aggregated) rate and prevalence data as published in [12]. The starting point is the prevalence of diabetes on January 1, 1995. Due to the imposed age restriction, the initial conditionEq (2)changes to:
pð1995;aÞ ¼p0ðaÞ; a30; ð9Þ
wherep0is the age-specific prevalence in 1995.
The incidence rate for 2004 is described in detail for all age groups in the article by Carsten-sen et al. [12]. For the years 1995–2003 the authors report a yearly increase of 5.3% per year (relative to the rate in 2004). This means that in 2003, the incidence rate was 95.0% (1/1.053) of the rate in 2004. The growth rate of 5.3% per year is an average across all age groups. Similarly, the mortality ratesm0andm1of the non-diabetic and diabetic male population, respectively,
are reported for 2004. The average reductions form0andm1are 2.5% and 3.9% per year,
respectively. In simulating the prevalence, we approximate the rates reported in 2004 and assume that the reported annual changes hold forallages30. This is necessary because the age-specific change rates are not reported. Further details are provided inS1 Text.
Having the initial condition and the ratesi,m0andm1at hand, we solve the PDEEq (1)
with initial conditionEq (9)by numerical integration. This is performed by a Runge-Kutta method (routinerk4in thedeSolvepackage for the statistical softwareR). As result we obtain the age-specific prevalencesp(1996,a),p(1997,a),. . .,p(2004,a).
Estimating the incidence from the cross-sections
After calculating the age course of the prevalences in the years 1996–2004, we estimate the mid-year age-specific incidence (denotedt= 1995.5, 1996.5,. . ., 2003.5) by successively
apply-ing Eqs (4) and (8) to pairs of consecutive years. For example, the incidence fort= 2003.5 is estimated by the age-specific prevalences in 2003 and 2004.
The mortality data (m,R) necessary for the application of Eqs (4) and (8) are assumed to be known for the validation study. We can calculate the relative mortalityRbyR¼m1
m0and the mortalitymof the general population bym=pm1+ (1−p)m0, and use these as the input for
the algorithms.
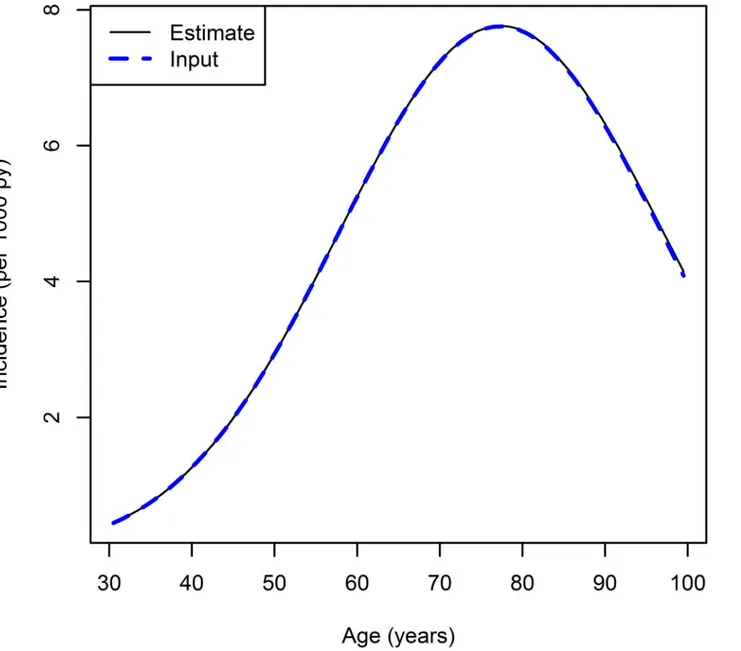
Fig 4shows the estimated age-specific incidence fort= 1995.5 compared to the“true inci-dence”, which was used as input for the simulation. Both methods, direct estimation and least
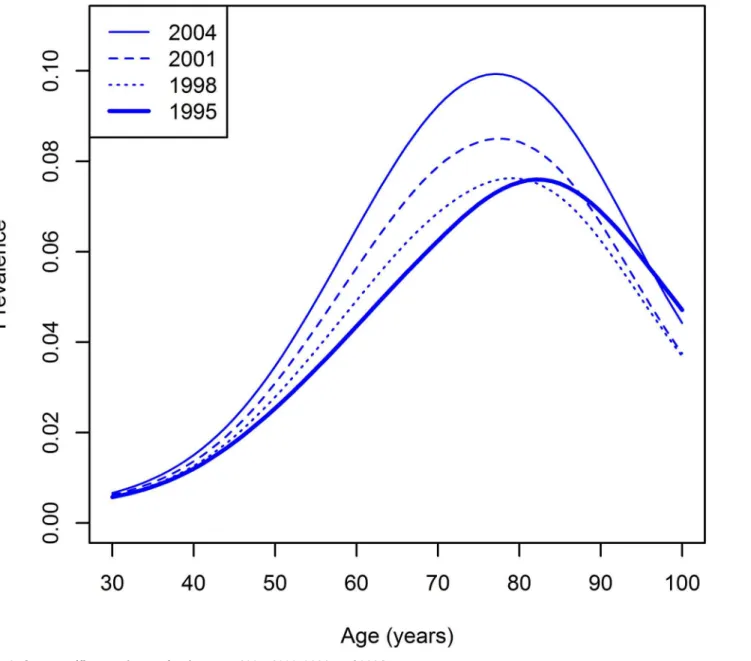
Fig 3. Age-specific prevalences for the years 1995, 1998, 2001, and 2004.
squares estimation (withσ
jk= 1), yield the same results. Visually, the curves are in nearly per-fect agreement.
To quantify the deviation between the“true”and the estimated incidence, we calculate the absolute relative error. For each of the yearly estimates from 1995.5 to 2003.5, the median and maximum relative error over all agesa= 30.5, 31.5,. . ., 99.5 are calculated. The results are
shown inTable 1. Note that the units inTable 1are per 100,000, which means that the overall maximum of the absolute relative error is below 0.9 percent.
If we compare the results of the direct and the least squares method inTable 1, we see that both methods lead to the same relative errors. Indeed, both methods yield very similar (but not equal) estimates for the age-specific incidence. There are two reasons for the similarity. First, there is no sampling uncertainty. As the main difference between the methods is the possible weighting of the prevalences with different sampling uncertainties (measured byσ2inEq (7)),
Fig 4. Age-specific incidence rate fort= 1995.5: true (dashed line) and estimated incidence (solid).
both methods should yield similar results. Second, the prevalence is sampled in steps of one year in the age- and time-dimension. Hence, the impact of the discretization errors of the par-tial derivative (@t+@a)pin Eqs (4), (5) and (6) is small.
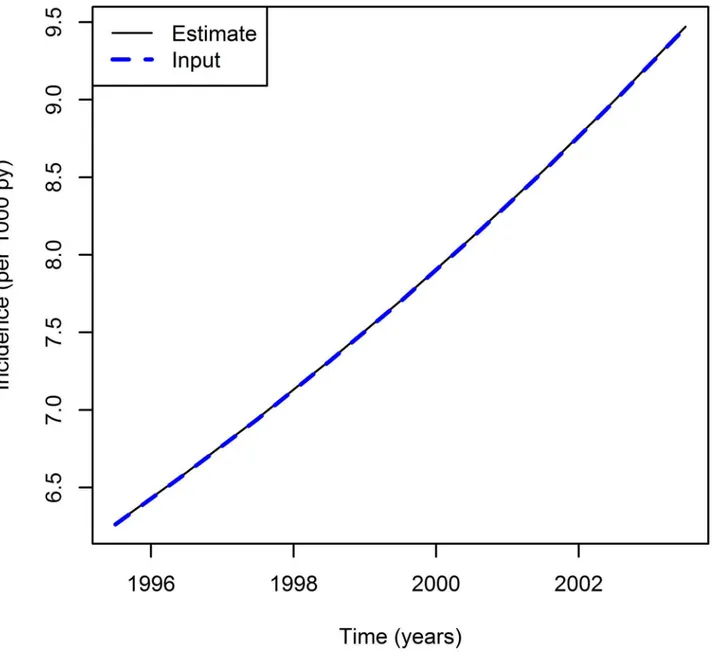
The incidence chosen as input data increases by 5.3% per year. Now, we examine whether this trend can be detected by the estimation methods. For illustration, we compare the data for agea= 65.5.Fig 5shows the estimated incidence and the true incidence fort= 1995.5, 1996.5,
. . ., 2003.5. Again, both methods direct and least squares estimates yield the same results—
visually there is no difference between the two curves.
Hence, we may conclude that the estimation method is capable of accurately detecting the trend in the incidence—just by using the data from the prevalence studies and the mortality.
Estimating the incidence in the presence of sampling error
So far, the sampling errorsσjkwere assumed to be equal. This means that each measurementp (tj,ak) gets the same weight when minimizingX2inEq (7). However, in real surveys the sam-pling of the age groups may be different. In a representative sample of a population, for instance, the sampling scheme is chosen with respect to the age distribution of the underlying population. This may lead toσjkbeing different from each other. An example is given as part
fromS1 File(TestCase1_A). In this test case we assume age groups of length five years with a decreasing sample size in the higher age groups. The age-specific prevalence is calculated as in the previous section. Then, additive binomial noise is superimposed on the calculated preva-lence to mimic sampling uncertainty. The additive binomial noise for yearjand age groupkis assumed to have a mean of zero and the variance given by:
s2
jk¼
½1 pðt
j;akÞpðtj;akÞ
njk
: ð10Þ
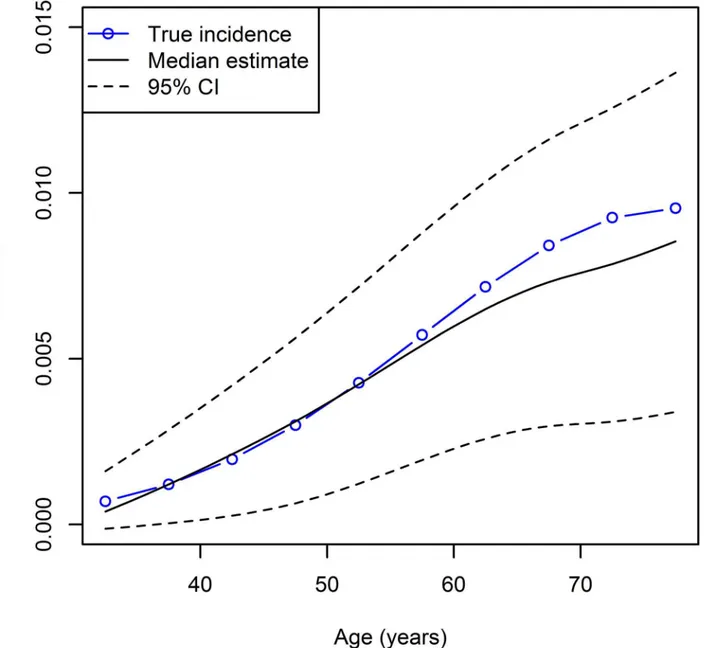
Then, the prevalence distorted by the additive noise serves as an input for the estimation method. To cope with the sampling uncertainty, a bootstrap technique is applied [13]. For each ofB= 2000 bootstraps with binomial noise, we apply the direct incidence estimation. If we then plot the estimated incidences, we obtain the result shown inFig 6. The true incidence (blue line) is compared to the median of the 2000 bootstrap estimates (solid black line) and the 95% confidence bounds (dashed black line).
For more details and further test cases the reader may refer toS2 TextandS1 File.
Table 1. Absolute relative errors of the incidence estimates (per 105).Median and maximum refer to all age-specific estimates for the corresponding point in time (t?
).
Direct method Least squares method (σjk= 1)
Timet? Median Maximum Median Maximum
1995.5 97 819 97 819
1996.5 94 658 94 658
1997.5 91 550 91 550
1998.5 88 478 88 478
1999.5 85 428 85 428
2000.5 83 394 83 394
2001.5 81 371 81 371
2002.5 79 354 79 354
2003.5 77 343 77 343
Discussion and Conclusions
This work presents two novel methods for deriving trends in incidence from a sequence of prevalence studies are presented. The first method, calleddirect estimationis based on repeti-tively applying a previously published algorithm [5]. The second method is based on a least squares approach and has not been published previously. Both methods lead to the same results when perfect measurements (i.e., those without sampling uncertainties) are assumed. However, real surveys typically face sampling uncertainties. These uncertainties may be included into the least squares estimation, giving more weight to those measurements that have a higher accuracy. Alternatively, direct estimation can address statistical uncertainties by using resampling techniques as described in the previous paragraph.
Both methods, the direct and the least squares estimation, are based on a differential equa-tion, which has shown superiority over other approaches for estimating the incidence from
Fig 5. Incidence rate for the age groupa= 65.5 over calendar timet: true (dashed line) and estimated incidence (solid line).
prevalence data [14]. The differential equation used in this work does not depend on assump-tions about the transition rates. Hence, the estimation methods may be callednon-parametric. The only (implicit) assumption is that the people who immigrate into or emigrate from the considered population have the same prevalence as the resident population. In situations where this assumption is violated, the differential equation must take additional terms for migration into account [9].
A simulation study based on the data from the Danish National Diabetes Register shows that both methods provide very accurate estimates of the age-specific incidence rates for a sequence of cross-sectional studies. This makes it possible to derive secular trends in the inci-dence. Incidence trends are especially important because they can indicate substantial changes
Fig 6. Age-specific incidence rates fort= 1996.5 based on the direct estimation andB= 2000 bootstraps. True (blue line) and estimated incidence (black lines): median (solid line) and 95% confidence bounds (dashed).
of the risk profile in the population under consideration. With a view to the tremendous effort required to collect incidence data, this method may offer an alternative to the costly follow-up studies that would otherwise be required.
Apart from the sequence of prevalence studies, the new method requires age- and time-spe-cific mortality data. First, we need the overall mortality for the population. Second, we need the relative mortality. While the overall mortality is often available from official vital statistics or death registries, the relative mortality, i.e. the ratio of the mortality rates of healthy and dis-eased persons, requires evidence from epidemiological studies. For example, case-control stud-ies are capable of estimating the relative mortality [15]. Similarly, nested case-control studies can be used for this purpose [16]. Case-control studies provide an effective opportunity to esti-mate the relative mortality, because they can be conducted with relatively low effort compared to other study types [10]. Although the partial differential equation the estimation methods are based upon can be formulated in terms of the excess mortality (m1−m0, seeEq (1)), the
equiv-alent differentialEq (3)in terms of the mortality rate ratio (m1/m0) and the overall mortality
(m) has practical advantages: Rate ratios are more likely to be generalizable from one popula-tion to another than rate differences [17]. Furthermore, estimates of the overall mortality in a population, i.e., the general mortality, are more easily obtainable than disease-specific death rates (such asm1). Note that all mortality rates in this work do not take the cause of death into
account. The rates refer to all-cause mortality in a specific subset of the population. For instance,m0is the overall mortality rate in the non-diabetic population.
Several extensions and modifications of the methods are possible. Changes in the age sam-pling can easily be made to the provided R scripts inS1 File. There are no restrictions on high or low age groups. Differences in covariates such as sex or education may be treated by stratifi-cation. The inclusion of covariates directly into the differential equations is subject to further research and is beyond the scope of this article.
Although the validation study uses data about diabetes, the methods are applicable to any disease where the underlying illness-death model inFig 1is able to capture important aspects of the disease. These comprise all diseases with incomplete cures, i.e., an elevated mortality once having contracted the disease. Examples are cardiovascular disease, cancer and rheumatic diseases. The model may be useful even in infectious diseases with incomplete cures, such as HIV.
A strength of the method proposed in this manuscript is that it does not require individual data, for example, the time of onset of a chronic disease. If these additional data are available, e.g., from electronic health records, other methods are preferable as summarized in the review of Keiding [18].
Although the treatment and impact of uncertainty in the prevalence data is discussed exten-sively in this article, a limitation may be seen in the fact that we have not considered the effect of uncertainty or errors in the mortality data. Studying the impact of errors in the mortality data and their interplay with errors in the prevalence data on the incidence estimates is subject to future work.
A typical application of the method is the conversion of a sequence of cross-sectional sur-veys that aimed to examine the age-specific prevalence of a chronic disease (or another irre-versible health related state) into a sequence of incidence data. The method requires relatively low effort and therefore may be useful in settings with sparse resources.
Supporting Information
S1 Text. Detailed description of generating the input data for the validation.
S2 Text. Description of the source code.To allow independent validation of the results of this article and to advocate the reproducibility of algorithms and computational experiments, the scripts that produced the results of this article are available as supporting information. In addi-tion, scripts for generating test data and making estimates from a sequence of prevalence stud-ies are provided. All scripts can be used with the free statistical software R (The R Foundation for Statistical Computing).
(DOC)
S1 File. Source code.The zip file contains the source files as described inS2 Text. After unzip-ping please refer to thereadme.txtfile.
(ZIP)
Author Contributions
Developed the methods, drafted the text, and made the programming: RB. Critically revised the text, gave important intellectual contributions and final approval of the version to be pub-lished: RB AH SL.
References
1. Lozano R, Naghavi M, Foreman K, Lim S, Shibuya K, Aboyans V, et al. Global and regional mortality from 235 causes of death for 20 age groups in 1990 and 2010: a systematic analysis for the Global Bur-den of Disease Study 2010. The Lancet. 2012; 380(9859):2095–2128. doi:10.1016/S0140-6736(12) 61728-0
2. United Nations’General Assembly. Resolution 66/2: Political Declaration of the High-level Meeting of the General Assembly on the Prevention and Control of Non-communicable Diseases; 2011.
3. Barnoya J, Glantz S. Association of the California tobacco control program with declines in lung cancer incidence. Cancer Causes & Control. 2004; 15(7):689–695. doi:10.1023/B:CACO.0000036187.13805. 30
4. Federation ID. IDF Diabetes Atlas, 7th edition. International Diabetes Federation, Brussles; 2015.
5. Brinks R, Landwehr S. A new relation between prevalence and incidence of a chronic disease. Mathe-matical Medicine and Biology. 2015; 32(4):425–435. doi:10.1093/imammb/dqu024PMID:25576933
6. Kalbfleisch J, Prentice R. The Statistical Analysis of Failure Time Data. 2nd ed. John Wiley & Sons; 2002.
7. Fix E, Neyman J. A simple stochastic model of recovery, relapse, death and loss of patients. Human Biology. 1951; p. 205–241. PMID:14880165
8. Kaplan EL, Meier P. Nonparametric estimation from incomplete observations. Journal of the American Statistical Association. 1958; 53(282):457–481. doi:10.1080/01621459.1958.10501452
9. Brinks R, Landwehr S. Age-and time-dependent model of the prevalence of non-communicable dis-eases and application to dementia in Germany. Theoretical Population Biology. 2014; 92:62–68. doi: 10.1016/j.tpb.2013.11.006PMID:24333220
10. Hennekens CH, Buring JE, Mayrent SL. Epidemiology in Medicine; 1987.
11. Draper NR, Smith H. Applied Regression Analysis. Wiley Series in Probability and Statistics. Wiley; 2014.
12. Carstensen B, Kristensen JK, Ottosen P, Borch-Johnsen K. The Danish National Diabetes Register: Trends in Incidence, Prevalence and Mortality. Diabetologia. 2008; 51(12):2187–2196. doi:10.1007/ s00125-008-1156-zPMID:18815769
13. Efron B, Tibshirani RJ. An introduction to the bootstrap. CRC Press, Boca Raton, FL; 1994.
14. Landwehr S, Brinks R. A comparative study of prevalence-based incidence estimation techniques with application to dementia data in Germany. Statistics in medicine. 2015; Epub ahead of print. PMID: 26376995
15. Pearce N. What does the odds ratio estimate in a case-control study? International Journal of Epidemi-ology. 1993; 22(6):1189–1192. doi:10.1093/ije/22.6.1189PMID:8144304
17. Breslow N, Day N. Statistical Methods in Cancer Research: Volume 1: Analysis of Case Control Stud-ies. International Agency for Research in Cancer: Lyon, France; 1980.
