Socioeconomic Position, Type 2 Diabetes and
Long-Term Risk of Death
Else-Marie Dalsgaard1*, Mette V. Skriver2, Annelli Sandbaek1, Mogens Vestergaard1,3
1Department of Public Health, Section for General Practice, Aarhus University, Denmark,2Department of Public Health, Section for Health Promotion and Health Services, Aarhus University, Denmark,
3Department of Public Health, Section for General Practice and Research Unit for General Practice, Aarhus University, Denmark
Abstract
Background
Both socioeconomic position (SEP) and type 2 diabetes have previously been found to be associated with mortality; however, little is known about the association between SEP, type 2 diabetes and long-term mortality when comorbidity is taken into account.
Methods
We conducted a population-based cohort study of all Danish citizens aged 40-69 years with no history of diabetes during 2001-2006 (N=2,330,206). The cohort was identified using na-tionwide registers, and it was followed for up to 11 years (mean follow-up was 9.5 years (SD: 2.6)). We estimated the age-standardised mortality rate (MR) and performed Poisson regression to estimate the mortality-rate-ratio (MRR) by educational level, income and co-habiting status among people with and without type 2 diabetes.
Results
We followed 2,330,206 people for 22,971,026 person-years at risk and identified 139,681 individuals with type 2 diabetes. In total, 195,661 people died during the study period; 19,959 of these had type 2 diabetes. The age-standardised MR increased with decreasing SEP both for people with and without diabetes. Type 2 diabetes and SEP both had a strong impact on the overall mortality; the combined effect of type 2 diabetes and SEP on mortality was additive rather than multiplicative. Compared to women without diabetes and in the highest income quintile, the MRR’s were 2.8 (95%CI 2.6, 3.0) higher for women with type 2 diabetes in the lowest income quintile, while diabetes alone increased the risk of mortality 2.0 (95%CI 1.9, 2.2) times and being in the lowest income quintile without diabetes 1.8 (95%CI 1.7,1.9) times after adjusting for comorbidity. For men, the MRR’s were 2.7 (95%-CI 2.5,2.9), 1.9 (95%(95%-CI 1.8,2.0) and 1.8 (95%(95%-CI 1.8,1.9), respectively.
a11111
OPEN ACCESS
Citation:Dalsgaard E-M, Skriver MV, Sandbaek A, Vestergaard M (2015) Socioeconomic Position, Type 2 Diabetes and Long-Term Risk of Death. PLoS ONE 10(5): e0124829. doi:10.1371/journal.pone.0124829
Academic Editor:Dena L. Schanzer, Public Health Agency of Canada, CANADA
Received:August 13, 2014
Accepted:March 19, 2015
Published:May 5, 2015
Copyright:© 2015 Dalsgaard et al. This is an open access article distributed under the terms of the Creative Commons Attribution License, which permits unrestricted use, distribution, and reproduction in any medium, provided the original author and source are credited.
Data Availability Statement:Data are owned by Statistics Denmark (http://www.dst.dk/en). The authors accessed the data through permission from Statistics Denmark. Individual-level data is only available upon request to Statistics Denmark, pending approval.
Conclusion
Both Type 2 diabetes and SEP were associated with the overall mortality. The relation between type 2 diabetes, SEP, and all-cause mortality was only partly explained by comorbidity.
Introduction
Type 2 diabetes is a major public health problem; its incidence is rising and the mortality from diabetes is high [1]. The prevalence of type 2 diabetes is higher among people with a lower so-cioeconomic position (SEP) than among people with a higher SEP [2,3], and the burden of complications increases with declining SEP [4]. It has been suggested that both personal factors and structural factors may explain why the burden of type 2 diabetes is higher among people with a lower SEP [5].
A few studies have compared the association between SEP and mortality in people with type 2 diabetes and people without type 2 diabetes [6–9]. These studies found that the all-cause mortality increases with decreasing SEP in both groups, but the strongest association was seen in people without diabetes. The excess absolute mortality among people with lower SEP and type 2 diabetes constitutes a major public health burden [8,9]. In Denmark, the relative income disparity is low, diabetes care is well-organized, and access to the health care system is free of charge. In this Danish context, we conducted a nationwide cohort study in which we aimed at examining the association between SEP, type 2 diabetes and the long-term mortality while tak-ing comorbidity into account.
Materials and Methods
We conducted a population-based cohort study based on nationwide Danish registers. All peo-ple with no history of diabetes aged 40–69 years between 1 January 2001 and 31 December 2006 were identified from the Danish Civil Registration System [10].
Type 2 diabetes
Incident cases of diabetes throughout the period 1 January 2001 to 31 December 2009 were identified from the Danish National Diabetes Register (NDR) [11]. Cases were identified as having diabetes if they fulfilled at least one of the following criteria: 1) registered in the Nation-al Patient Register [12] with a diagnosis of diabetes defined according to the diagnostic codes of the 10thedition of the International Classification of Diseases (ICD-10): DE10-14, DH36.0, DO24 (excluding DO24.4), or ICD8: 249 or 250; 2) registered in the National Health Service Registry [14] with chiropody (patients with diabetes), five blood glucose measurement within one year, or two blood glucose measurements per year in five consecutive years; or 3) registered in the Danish National Prescription Registry [14] with two redemptions of glucose-lowering drugs recorded within six months or a second purchase of prescribed insulin. The NDR [11] does not distinguish between type 1 and type 2 diabetes. As we included only people registered after the aged of 40 years in the NDR, we regard our population to have type 2 diabetes.
Socioeconomic position
SEP was measured in terms of educational level, income level, and cohabitation status. The data were collected from the Danish Integrated Database for Labour Market Research [15] for
the year before the case entered the study. Educational level was categorised according to UNESCO’s International Standard Classification of Education [16], and educational levels were divided into three groups according to the years of schooling: 1) low educational level:
10 years, 2) middle educational level:>10 and15 years, and 3) high educational level:
>15 years. Income level was categorised according to the OECD-modified equivalence-weighted
income scale [17]; in this scale, the first adult in the household is given the weight 1, the second adult the weight 0.5, and each child the weight 0.3. Income level was divided into three groups: the lowest 20% of the income earners, the medium 60% of the income earners, and the highest 20% of the income earners. Cohabitation status was derived from the Danish Civil Registration System [10] and categorised into two groups: cohabiting people and people living alone.
Mortality
We collected information on mortality before 31 December 2011 from the Danish Civil Regis-tration System [10].
Covariates
We collected information on age and sex from the Danish Civil Registration System [10] and hospital discharge diagnoses from the Danish National Patient Register [13]. We identified peo-ple with a history of cardiovascular disease (CVD) or cancer if they had been given an ICD-10 diagnosis for CVD (ICD-10: I00-I79 and I90-I94) or for cancer (ICD-10: C00-C99) during the last five years before inclusion. Furthermore, during follow-up we registered any instance of CVD, cancer, and other diseases (defined as number of diseases other than CVD and cancer from the list of diseases included in the Charlson Comorbidity Index [18]).
Statistical analyses
The study population was characterised using the chi-square test and the t-test. The age-stan-dardised mortality rate (MR) for each sex by SEP was calculated for people with and without type 2 diabetes using the total study population divided into five-year age groups as our stan-dard population. Diabetes was treated as a time-dependent variable. Thus, all people were in-cluded in the non-diabetes cohort when they were enrolled into the study, and subsequently transferred to the diabetes cohort on the day when they were registered with diabetes in the NDR. The study population was followed until the date of migration, the date of death, or 31 December 2011, whichever came first. Poisson regression analysis was performed to estimate the mortality rate ratio (MRR); the reference group consisted of those people without diabetes who had the highest educational level, the highest income level, or were cohabiting, respective-ly. Separate analyses were performed for each sex. Model 1 was adjusted for age (in five-year age groups), duration of diabetes (0–2, 2–4, 4–6,>6 years), and calendar year; and an
interac-tion term between the SEP variable and the birth year (in five-year groups) was included. Model 2 was further adjusted for CVD and cancer during the last five years before inclusion. Model 3 was further adjusted for time-dependent comorbidity (CVD, cancer, and other dis-eases according to the Charlson Comorbidity Index) during follow-up. In analyses with educa-tional and income levels as exposures, we added cohabitation status to the model, while educational level was added to the model where cohabitation status was considered as expo-sure. Analyses were repeated with exclusion of the first year after inclusion.
model with an interaction term between the two variables was applied. To evaluate interac-tion on the additive scale we estimated the additive interacinterac-tion by using the risk ratios instead of the risks [19]. We calculated the attributable proportion due to interaction (AP). The AP is a measure of the excess MRR (for people with both type 2 diabetes and low SEP), which was not explained by the independent effects of type 2 diabetes or low SEP. The AP was calculated by subtracting the difference in MRRs between people with and without diabetes from the difference in MRRs between people with low SEP and diabetes and people with low SEP with-out diabetes and dividing this by the MRR for people with both diabetes and low SEP (e.g. APinteraction= [(MRRlowSEP+DM—MRRlowSEP)–(MRRDM—MRRbackground) /MRRDM+lowSEP] [20]. All analyses were performed using Stata 12.1.
Data were handled according to rules from the Danish Data Protection Agency (Jr.nr: 2014–54–0704). In Denmark, ethical approval is not required for de-identified register-based research.
Results
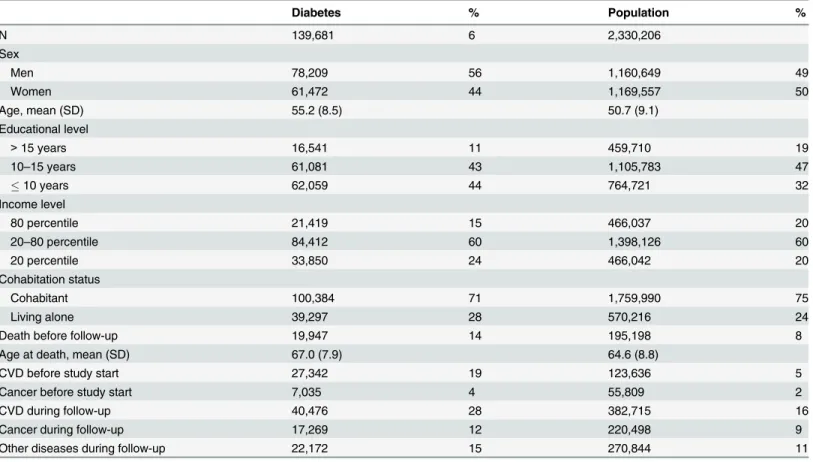
A total of 2,330,206 people without a history of diabetes were enrolled into the study; 139,681 of these developed type 2 diabetes during the study period (Table 1). The population was fol-lowed for up to 11 years; the mean follow-up was 9.5 years (standard deviation (SD): 2.6) for the study population and 5.7 years (SD: 2.7) for the diabetes population. People with type 2 dia-betes were more likely than the total study population to have a lower educational level, a lower income level, and to be living alone. A history of comorbid disease at the time of inclusion or development of comorbid disease during follow-up was more common among people with type 2 diabetes than among the total study population.
A total of 195,661 people died during the study period; 19,959 (14% of people who had a history of type 2 diabetes). There was a strong association between SEP, type 2 diabetes and the overall mortality. For both people with and without type 2 diabetes, the age-standardised MRs increased with decreasing educational level and decreasing income level, and the MRs were higher for people living alone than for cohabiting people (Fig 1). The excess mortality for peo-ple with type 2 diabetes compared with peopeo-ple without diabetes was stable across the SEP indi-cators; for example, 14 per 1000 person-years (95% CI 12 to 16) for men and 11 per 1000 person-years (95% CI 9 to 12) for women with the lowest educational level, 13 per 1000 per-son-years (95% CI 11 to 14) for men and 8 per 1000 perper-son-years (95% CI 7 to 9) for women with a medium educational level, and 11 per 1000 person-years (95% CI 10 to 12) for men and 8 per 1000 person-years (95% CI 7 to 9) for women with the highest educational level (Fig 1).
People with type 2 diabetes and the lowest SEP (lowest educational level, lowest income level, or living alone) had a more than two-fold higher MRR than people without diabetes and the highest SEP (highest educational level, highest income level, or cohabiting) (Table 2). In general, associations between the SEP variables and mortality were similar for both sexes, but men living alone tended to have higher MRRs than women living alone. We found that the AP for interaction between type 2 diabetes and each of the three SEP indicators (education, in-come, and cohabitation) were not statistical different from zero for women (S1 Table) indicat-ing that the combined effects of SEP and type 2 diabetes on mortality among women were additive (ie,MRRlowSEP+DM = MRRlowSEP + MRRDM—MRRref:or 2.7 = 1.7+2.1–1 fromTable 2for women and education). Among men the AP’s were close to zero. However, for educational level and cohabitating status they were statistical significant and negative (S1 Table).
remain high and statistically significant. In sub-analyses, we eliminated the first year after in-clusion for people with type 2 diabetes, but this did not change the estimates (data not shown).
Information on the SEP variables were missing in less than 3% of the study population, which was due mostly to missing information on education. People with missing information on education were more likely to be younger, to be men, to be immigrants, to have lower or middle income, and to live alone. We performed sensitivity analyses in which people with miss-ing information on education were classified into the lowest educational category and the high-est educational category. The association between SEP variables, diabetes and mortality were moderately attenuated when the missing data were included into the highest level, whereas no change was seen in the estimates when the missing data were included into the lowest level.
Discussion
In this nationwide cohort study, we found that type 2 diabetes and socioeconomic position had a strong impact on the overall mortality. The MRs increased consistently with decreasing levels of education and income, and among people living alone compared with cohabiting people; this in-crease was seen both among people with and without diabetes. The excess mortality of people with type 2 diabetes relative to those without diabetes was stable across SEPs. We found that the combined effects of the SEP variables and type 2 diabetes on mortality among women were addi-tive rather than multiplicaaddi-tive while the combined effect among men were both lower than the sum and lower than the product of the two variables for educational level and cohabiting status. The association between the SEP variables and mortality was only slightly attenuated when we
Table 1. Characteristics of people with and without diabetes and the general population aged 40–69 years, 2001–06.
Diabetes % Population %
N 139,681 6 2,330,206
Sex
Men 78,209 56 1,160,649 49
Women 61,472 44 1,169,557 50
Age, mean (SD) 55.2 (8.5) 50.7 (9.1)
Educational level
>15 years 16,541 11 459,710 19
10–15 years 61,081 43 1,105,783 47
10 years 62,059 44 764,721 32
Income level
80 percentile 21,419 15 466,037 20
20–80 percentile 84,412 60 1,398,126 60
20 percentile 33,850 24 466,042 20
Cohabitation status
Cohabitant 100,384 71 1,759,990 75
Living alone 39,297 28 570,216 24
Death before follow-up 19,947 14 195,198 8
Age at death, mean (SD) 67.0 (7.9) 64.6 (8.8)
CVD before study start 27,342 19 123,636 5
Cancer before study start 7,035 4 55,809 2
CVD during follow-up 40,476 28 382,715 16
Cancer during follow-up 17,269 12 220,498 9
Other diseases during follow-up 22,172 15 270,844 11
Fig 1. Age-standardized mortality rates according to educational level, income level and cohabitation status among people with and without diabetes in the Danish population aged 40–69 years at inclusion, mean follow-up 9.5 years.Red: People with diabetes, Blue: People without diabetes.
adjusted for a history of comorbidity at inclusion and for comorbidity that developed during fol-low-up, but it remained strong for educational level, income level, and cohabitation status.
We conducted a large population-based cohort study of all people in Denmark without dia-betes aged 40 to 69 years between 2001 and 2006, and we followed the cohort for up to 11 years without loss to follow-up. We had complete information on SEP for 97% of the population, and sensitivity analyses did not change the results. Thus, bias due to the selection of study par-ticipants or loss to follow-up cannot explain our results. The large size of the cohort provided precise estimates and sufficient power to stratify the multivariate analyses.
The use of data from Danish registers allowed us to obtain information on all the included elements at the level of the individual person. The Danish National Diabetes Register covers the entire Danish population; its sensitivity compared with general practice records is 91%, and it has a positive predictive value of 89% [11]. There is no reason to believe that enrolment in the register differed between the SEP levels, and any misclassification of diabetes is therefore most likely non-differential. Even though the register does not distinguish between type 1 and type 2 diabetes, we regard people with diabetes in this study to have type 2 diabetes as we en-rolled only people diagnosed after the age of 40 years.
Table 2. MRR for all-cause mortality among people with and without diabetes in the Danish population aged 40–69 years at inclusion, mean fol-low-up: 9.5 years.
Model 1 Model 2 Model 3
Without diabetes Diabetes Without diabetes Diabetes Without diabetes Diabetes Women
Educational level
>15 years Ref. 2.2 (2.0,2.4) Ref. 2.1 (1.9,2.3) Ref. 2.1 (1.9,2.3)
10–15 years 1.3 (1.3,1.4) 2.5 (2.3,2.6) 1.3 (1.3,1.4) 2.3 (2.1,2.5) 1.3 (1.2,1.3) 2.2 (2.0,2.3) 10 years 1.7 (1.6,1.7) 2.8 (2.7,3,0) 1.7 (1.6,1.8) 2.7 (2.6,2.9) 1.7 (1.6,1.8) 2.7 (2.5,2.8)
Income level
80 percentile Ref. 2.3 (2.1,2.5) Ref. 2.2 (2.0,2.3) Ref. 2.0 (1.9,2.2)
20–80 percentile 1.4 (1.4,1.5) 2.7 (2.5,2.9) 1.5 (1.4,1.6) 2.5 (2.4,2,7) 1.5 (1.4,1.5) 2.5 (2.3,2.7) 20 percentile 1.7 (1.6,1.8) 2,8 (2.6,3.0) 1.7 (1.7,1.8) 2.7 (2.5,2.9) 1.8 (1.7,1.9) 2.8 (2.6,3.0)
Cohabitation status
Cohabitant Ref. 1.9 (1.8,2.0) Ref. 1.8 (1.7,1.9) Ref. 1.8 (1.7,1.8)
Living alone 1.5 (1.5,1.5) 2.5 (2.3,2.6) 1.5 (1.4,1.5) 2.3 (2.2,2.4) 1.4 (1.4,1.5) 2.2 (2.1,2.4)
Men
Educational level
>15 years Ref. 2.2 (2.0,2.3) Ref. 2.0 (1.9,2.2) Ref. 1.9 (1.8,2,1)
10–15 years 1.3 (1.3,1.4) 2.5 (2.3,2.6) 1.3 (1.3,1.4) 2.3 (2.1,2.4) 1.3 (1.3,1.4) 2.15 (2.0,2.3) 10 years 1.5 (1.4,1.5) 2.4 (2.3,2.6) 1.5 (1.4,1.5) 2.3 (2.2,2.4) 1.5 (1.5,1.6) 2.3 (2.2,2.4)
Income level
80 percentile Ref. 2.2 (2.1,2.3) Ref. 2.0 (1.9,2.2) Ref. 1.9 (1.8,2.0)
20–80 percentile 1.5 (1.5,1.6) 2.8 (2.6,3.0) 1.6 (1.5,1.6) 2.6 (2.4,2.7) 1.5 (1.5,1.6) 2.4 (2.3,2.6) 20 percentile 1.8 (1.8,1.9) 2.9 (2.8,3.1) 1.8 (1.8,1.9) 2.7 (2.6,2.9) 1.8 (1.8,1.9) 2.7 (2.5,2.9)
Cohabitation status
Cohabitant Ref. 2.0 (2.0,2.1) Ref. 1.8 (1.8,1.9) Ref. 1.8 (1.7,1.9)
Living alone 1.8 (1.8,1.9) 2.7 (2.6,2.9) 1.9 (1.8,1.9) 2.6 (2.5,2.7) 1.9 (1.9,2.0) 2.6 (2.4,2.7)
Model 1. Adjusted for age, duration of diabetes, calendar time. Model 2. Further adjusted for CVD and cancer before study start. Model 3. Further adjusted for CVD and cancer before study start and CVD, cancer and no. of other diseases according to Charlson Comorbidity Index during follow-up. Reference: Highest SEP-level among people without diabetes, Interaction between SEP and diabetic status, p<0.001
Socioeconomic data from the Danish Integrated Database for Labour Market Research [15] are regarded as valid, and they were collected prospectively and did not depend on people’s memory. Misclassification is therefore most likely non-differential and bias will be towards the null value.
We included only people with incident diabetes to ensure a homogenous population and to re-duce the risk of confounding by severity of diabetes disease. We enrolled incident cases of diabetes on the basis of the date of registration in the NDR [11], even if the disease might have been pres-ent several years before the person was diagnosed [21]. We controlled for calendar time and dura-tion of diabetes as both factors may influence mortality among people with diabetes [22]. The overall mortality of the Danish population has generally declined in recent years. This decrease has been particularly prominent among people with type 2 diabetes and has presumably been achieved owing to a strengthened diagnostic effort and focus on early treatment initiation [23].
Residual confounding factors remain an issue even though we adjusted for several con-founders. Thus, we had no information on lifestyle factors such as physical activity, body mass index, and smoking status; and we had no information on intermediary measures (e.g. HbA1c, cholesterol and blood pressure levels) or subclinical morbidity.
In line with findings from previous studies, we found that the mortality among people with type 2 diabetes increased with decreasing SEP [6–9,24–26]. In the US National Health Inter-view Survey, Dray-Spira et al. [9] found a 28% higher mortality among people with type 2 dia-betes and a low educational level than among those with a higher educational level. Similar results have been found in Scotland [8], Finland [27], and two North Italian cities [6], although no association was found among women with type 2 diabetes in the Italian study.
Only a few studies have compared the association between SEP and mortality in people with type 2 diabetes and in people without diabetes [6–9]. Our findings of higher absolute MRs among people with type 2 diabetes and increasing MR with declining SEP support the findings of others [8,9], and our results underline the magnitude of the mortality burden among people with type 2 diabetes and a low SEP. We found a more than two-fold higher MRR among people with type 2 diabetes and a low SEP than among people without diabetes and the highest SEP. Our reference group was chosen to underscore the impact of having both type 2 diabetes and a low SEP. Other studies present a stronger association among the population without diabetes when comparing the mortality and different SEP indicators [6–9]. These differences are due mainly to the choice of reference group; Walker et al. [8] compared the MRR among people with and without type 2 diabetes from the same area-based deprivation level and found the strongest association in the least deprived group. Dray-Spira et al. [9] chose the highest educa-tional level among people with and without type 2 diabetes as reference group. Even so, both our study and other studies found the combined effect of SEP and type 2 diabetes to be additive i.e. less than multiplicative [6,8,9]. The stronger association between SEP and mortality found among people without diabetes in all these studies was suggested to be explained by better car-diovascular control among deprived people with type 2 diabetes than among deprived people without diabetes owing to the intensive diabetes treatment regimens with regular control of HbA1c, cholesterol, and blood pressure and owing to multifactorial drug treatment [8,9]. This is supported by recent studies, including a Danish study, which found that risk factors were con-trolled to the same extent among people with type 2 diabetes regardless of their SEP [28–30].
Our finding of only a moderate decline in the association between the SEP indicators, type 2 diabetes and mortality when adjusting for comorbidity both before inclusion and during fol-low-up is notable and it is supported by the findings of a recent US study [33]. While type 2 dia-betes is often diagnosed when a person is hospitalized for other reasons, it has been found that people with type 2 diabetes had an increased risk of dying in the first year after diagnosis [23]. Furthermore, it has been suggested that people with low SEP are often diagnosed later in the disease trajectory and consequently suggested to have more complications, including higher mortality [9]. However, our findings do not support this suggestion as we found the association to be similar after having excluded from the analyses the first year after the diabetes diagnosis.
Both type 2 diabetes and income, education and cohabitating status had a significant effect on all-cause mortality. Mortality rates were higher among people with low SEP than among those with high SEP both among people with and people without type 2 diabetes. All-cause mortality was only partly explained by comorbidity.
Supporting Information
S1 Table. Attributable proportion due to interaction between type 2 diabetes and the SEP variable
(DOCX)
Author Contributions
Conceived and designed the experiments: EMD MVS AS MV. Performed the experiments: EMD MVS AS MV. Analyzed the data: EMD MVS AS MV. Contributed reagents/materials/ analysis tools: EMD MVS AS MV. Wrote the paper: MVS AS MV. Wrote the first draft of the manuscript: EMD. Agreed with manuscript results and conclusions: EMD MVS AS MV.
References
1. Guariguata L. By the numbers: New estimates from the IDF diabetes atlas update for 2012. Diabetes Res Clin Pract. 2012; 98: 524–525. doi:10.1016/j.diabres.2012.11.006PMID:23217268
2. Sacerdote C, Ricceri F, Rolandsson O, Baldi I, Chirlaque MD, Bendinelli B, et al. Lower educational level is a predictor of incident type 2 diabetes in European countries: The EPIC-InterAct study. Int J Epi-demiol. 2012; 41: 1162–1173. PMID:22736421
3. Espelt A, Borrell C, Palencia L, Goday A, Spadea T, Gnavi R, et al. Socioeconomic inequalities in the incidence and prevalence of type 2 diabetes mellitus in Europe. Gac Sanit. 2013; 27: 494–501. doi:10. 1016/j.gaceta.2013.03.002PMID:23643719
4. Espelt A, Borrell C, Roskam AJ, Rodriquez-Sanz M, Stirbu I, Dalmau-Bueno A, et al. Socioeconomic in-equalities in diabetes mellitus across Europe at the beginning of the 21st century. Diabetologia. 2008; 51: 1971–1979. doi:10.1007/s00125-008-1146-1PMID:18779946
5. Brown AF, Ettner SL, Piette J, Weinberger m, Gregg E,Shapiro MF, et al. Socioeconomic position and health among persons with diabetes mellitus: A conceptual framework and review of the literature. Epi-demiol Rev. 2004; 26:63–77. PMID:15234948
6. Gnavi R, Canova C, Picariello R, Tessaru R, Giorda C, Simonato L, et al. Mortality, incidence of cardio-vascular diseases, and educational level among the diabetic and non-diabetic populations in two large Italian cities. Diabetes Res Clin Pract. 2011; 92: 205–212. doi:10.1016/j.diabres.2011.02.011PMID: 21377751
7. Koskinen SV, Martelin TP, Valkonen T. Socioeconomic differences in mortality among diabetic people in Finland: Five year follow up. BMJ. 1996; 313:975–978. PMID:8892417
8. Walker JJ, Livingstone SJ, Colhoun HM, Lindsay RS, McKnight JA, Morris AD, et al. Effect of socioeco-nomic status on mortality among people with type 2 diabetes: A study from the Scottish diabetes re-search network epidemiology group. Diabetes Care. 2011; 34: 1127–1132. doi:10.2337/dc10-1862 PMID:21421800
10. Pedersen CB. The Danish civil registration system. Scand J Public Health. 2011; 39: 22–25. doi:10. 1177/1403494810387965PMID:21775345
11. Carstensen B, Kristensen JK, Marcussen MM, Borch-Johnsen K. The national diabetes register. Scand J Public Health. 2011; 39: 58–61. doi:10.1177/1403494811404278PMID:21775353
12. Lynge E, Sandegaard JL, Rebolj M. The Danish national patient register. Scand J Public Health. 2011; 39:30–33. doi:10.1177/1403494811401482PMID:21775347
13. Andersen JS, Olivarius Nde F, Krasnik A. The Danish national health service register. Scand J Public Health. 2011; 39: 34–37. doi:10.1177/1403494810394718PMID:21775348
14. Kildemoes HW, Sorensen HT, Hallas J. The Danish national prescription registry. Scand J Public Health; 2011; 39: 38–41. doi:10.1177/1403494810394717PMID:21775349
15. Statistics Denmark. IDA—en integreret database for arbejdsmarkedsforskning, hovedrapport [IDA—an integrated database of labor marked research]. Danmarks statistik. 1991. Available:http://www.dst.dk/ pukora/epub/upload/20698/ida1991.pdf
16. Unesco, International Standard Classification of Education. 2011. Available:http://www.uis.unesco. org/Education/Documents/isced-2011-en.pdf.
17. What are equivalence scales? Adjusting household incomes: equivalence scales—OECD. Available: www.oecd.org/.../OECD-Note-EquivalenceScales.pdf.
18. Charlson ME, Pompei P, Ales KL, MacKenzie CR. A new method of classifying prognostic comorbidity in longitudinal studies: Development and validation. J Chronic Dis. 1987; 40: 373–383. PMID:3558716
19. Tyler J, Vanderweele TJ, Knol MJ. A tutorial on interaction. Epidemiologic Methods. 2014;Published ahead of print, doi:10.1515/em-2013-0005PMID:25866704
20. Andersson T, Alfredsson L, Kallberg H, Zdravkovic S, Ahlbom A. Calculating measures of biological in-teraction. Eur J Epidemiol. 2005; 20: 575–579. PMID:16119429
21. Harris MI, Klein R, Welborn TA, Knuiman MW. Onset of NIDDM occurs at least 4–7 yr before clinical di-agnosis. Diabetes Care. 1992; 15: 815–819. PMID:1516497
22. Carstensen B, Borch-Johnsen K. Register-based studies of diabetes. Scand J Public Health. 2011; 39: 175–179. doi:10.1177/1403494811404279PMID:21775379
23. Carstensen B, Kristensen JK, Ottosen P, Borch-Johnsen K, Steering Group of the National Diabetes Register. The Danish national diabetes register: Trends in incidence, prevalence and mortality. Diabe-tologia. 2008; 51: 2187–2196. doi:10.1007/s00125-008-1156-zPMID:18815769
24. Nilsson PM, Johansson SE, Sundquist J. Low educational status is a risk factor for mortality among dia-betic people. Diabet Med. 1998; 15: 213–219. PMID:9545122
25. Roper NA, Bilous RW, Kelly WF, Unwin NC, Connolly VM. Excess mortality in a population with diabe-tes and the impact of material deprivation: Longitudinal, population based study. BMJ. 2008; 322: 1389–1393.
26. Robinson N, Edouard L, Diehl A, Fuller JH. Social class and risk factors for vascular disease in diabe-tes. Diabetes Metab. 1984; 10: 245–249. PMID:6391975
27. Forssas E, Manderbacka K, Arffman M, Keskimaki I. Socio-economic predictors of mortality among dia-betic people. Eur J Public Health. 2012; 22: 305–310. doi:10.1093/eurpub/ckr044PMID:21498561
28. Wild S, Macleod F, McKnight J, Watt G, Maekenzie C, Ford I, et al. Impact of deprivation on cardiovas-cular risk factors in people with diabetes: An observational study. Diabet Med. 2008; 25: 194–199. doi: 10.1111/j.1464-5491.2008.02382.xPMID:18290861
29. O'Kane MJ, McMenamin M, Bunting BP, Moore A, Coates VE. The relationship between socioeconom-ic deprivation and metabolsocioeconom-ic/cardiovascular risk factors in a cohort of patients with type 2 diabetes melli-tus. Prim Care Diabetes. 2010; 4: 241–249. doi:10.1016/j.pcd.2010.08.004PMID:20869343
30. Dalsgaard EM, Vestergaard M, Skriver MV, Borch-Johnsen K, Lauritzen T, Sandbaek A. Socioeconom-ic position and cardiovascular risk factors among people with screen-detected type 2 DM: Six-year fol-low-up of the ADDITION-Denmark trial. Prim Care Diabetes. 2014; 8:322–9. doi:10.1016/j.pcd.2014. 01.006PMID:24613817
31. Galobardes B, Lynch J, Smith GD. Measuring socioeconomic position in health research. Br Med Bull. 2007;81–82: 21–37. PMID:18096635
32. Geyer S, Hemstrom O, Peter R, Vagero D. Education, income, and occupational class cannot be used interchangeably in social epidemiology. empirical evidence against a common practice. J Epidemiol Community Health. 2006; 60: 804–810. PMID:16905727