632
THE WORLD OIL MARKET – STATISTICAL ANALYSIS
Begu Liviu-Stelian
Academia de Studii Economice, Facultatea de Cibernetica, Statistica si Informatica Economica, Piata Romana nr.6,sector 1, Bucuresti, [email protected], mobile phone:0724204189 Gagea Mariana
Alexandru Ioan Cuza University of Iasi, Faculty of Economics and Business Administration, 22, Bd.Carol I, Building B, Room B315, Iasi, post code 700505, [email protected], Tel. +40 232 201 584
Alexandru AnaMaria
Academia de Studii Economice, Facultatea de Cibernetica, Statistica si Informatica Economica, Piata Romana nr.6,sector 1, Bucuresti, [email protected], mobile phone:0723374735
For some countries the oil is the main source of income, while for others it represents the main raw material for energetic needs. Thus, the oil price has major influence on their economies and it is important for them that it stabilizes at a level profitable for both producers and consumers. The present paper aims to
analyze the world oil market through a comparative analysis of the different world regions’ situation
starting with 1980 trough the end of the Cold War and from 1992 to the present. For this purpose, we used parametric methods in order to underline the relationships existent on the world oil market between its different components, i.e.: reserves, production, consumption, exports, imports, stocks and price. The analysis led to the conclusion that there are strong relationships between them, and that the respective relations are strongly influenced by the world economy condition.
Keywords: world oil market, comparative analysis, OPEC, G8 JEL Classification: F14, L71, O13, Q31, Q32
INTRODUCTION
In a world where energy became the main pillar of political and economical power, a new indicator of success and material progress according to which the state hierarchy is determined, access to energetic resources became the ultimate goal of the 21st century state and a guiding principle for all governments.
Known and used in various domains as far back as the Antiquity, the petroleum started to be exploited on large scale only in the middle of the 19th century, with the first productions recorded in Romania (1857), USA (1859), Canada (1862) and Russia (1863).
Since then, it became more and more important for the world economy. Starting with the middle of the 20th century, it is considered a strategic resource and it is taken into account when building up strategies for future moves on the “great chess table”, as the American analyst Zbiegniew Brzezinski called the world scene. The players on this immense “chessboard” compete among themselves for gaining access to the resources they need. Fighting for energetic resources, especially for oil, became more and more intense and its consequences are profound and unexpected for the world economy and geopolitics.
One of the major players on the world oil market is the Organization of the Petroleum Exporting Countries (OPEC), which is a permanent intergovernmental organization created at the Baghdad Conference in September 1960 by Iran, Iraq, Kuwait, Saudi Arabia and Venezuela. Nowadays, it has 12 members and its headquarters is located in Vienna, Austria. The objective of OPEC is to “co-ordinate and unify petroleum policies among Member Countries, in order to secure fair and stable prices for petroleum producers; an efficient, economic and regular supply of petroleum to consuming nations; and a fair return on capital to those investing in the industry.”377
633
The present paper aims to analyze the place of G8 and OPEC on the world oil market during 1980 and 2007. In order to facilitate the reaching of its goal, the paper is structured in four main parts. The first part, dealing world oil reserves briefly analyzes their evolution during the timeframe in focus. The second part analyzes the oil production in the world and in the focus group, with a special attention to OPEC production. The paper continues with the analysis of global oil consumption, giving a special attention to G7 consumption. In the last part, oil prices and their evolution since 1997 to the present are dealt with. The focus will be on OPEC and non-OPEC price differences, on the unequal gains that non-OPEC and G8 have from oil and on differences in oil product prices caused by taxes imposed by seven of the G8 countries. The paper ends with a few conclusions.
REZERVES
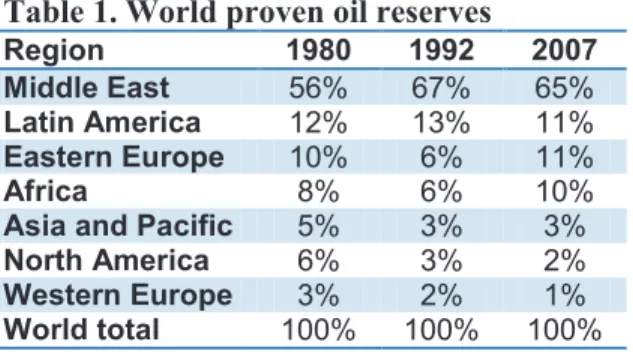
According to OPEC latest estimations378, more than half of the proved world oil reserves belong to Middle East countries, followed by Latin America and Eastern Europe, with a little over 10% each. The regions with the smallest proved oil reserves are Western Europe and Northern America. (see Table 1) It should be noted, however, that in the case of Canada, only conventional crude oil is taken into account, thus total recoverable oil reserves of this country would be much larger if Alberta tar sands were taken into consideration.
We may also note that, although there have been changes in the share of oil reserves for each region, the general classification of the regions by proved oil reserves remained relatively the same during the timeframe in focus. The only exception is North America, which in 1980 had a bigger share of oil reserves than the Asia and Pacific region, while in 2007 the situation was the other way around, after having had an equal share in 1992.
It is also interesting to take a closer look at the regional shares in themselves. The spectacular increase in the Middle East region’s share is mainly based on the discoveries made in 1986 (105 additional billion barrels in Iran, Iraq and United Arab Emirates) and 1988 (85.4 billion barrels in Saudi Arabia). For the timeframe analyzed, Middle East reserves more than doubled, most of the discoveries occurring between 1980 and 1992.
Latin America followed the same pattern, its total known reserves being 1.8 times bigger in 2007 compared to 1980 and most discoveries taking place before 1992. The bigger discoveries occurred in 1981 (Mexico, 9.8 billion barrels) and 1985 (Venezuela 16.4 billion barrels).
378OPEC Annual Statistical Bulletin 2007, available at http://www.opec.org/library/Annual%20Statistical%20 Bulletin/interactive/FileZ/XL/T33.XLS
Table 1. World proven oil reserves
Region 1980 1992 2007
Middle East 56% 67% 65%
Latin America 12% 13% 11%
Eastern Europe 10% 6% 11%
Africa 8% 6% 10%
Asia and Pacific 5% 3% 3%
North America 6% 3% 2%
Western Europe 3% 2% 1%
World total 100% 100% 100%
634
Eastern Europe and Africa also benefited of an increase in their proved oil reserves, but it was mainly due to discoveries made after 1992. The 120% increase in the proved oil reserves of Eastern Europe and the 96.5% increase in those of Africa may be explained by the fall of the socialist regimes in the countries from these areas. The former USSR, having oil to sale and doing most of its trade with the countries in its sphere of influence, had no incentive for encouraging the countries to find alternative sources for their industrial needs. Once the USSR imploded, the democratic regimes that came to power turned to West for support during the transition period. Part of the new west-oriented policies of the new democracies was opening the borders. The major oil companies saw this as an excellent business opportunity and started to explore the countries’ underground for oil. In Eastern Europe the bigger discoveries made were in 1996 (11.3 billion barrels), 1998 (20.2 billion barrels) and 2001 (19.6 billion barrels), all on the territory of the former Soviet Union. In the African region, major discoveries were made in Libya (1995 – 6.7 billion barrels and 2000 – 6.5 billion barrels), Nigeria (6.5 billion barrels) and Sudan (5.6 billion barrels).
For the Asia and Pacific region, proven oil reserves grew with only approximately 15%. This suggests that no major discoveries were made in this region since 1980 to the present.
The last two regions are characterized by an overall decrease of their proved oil reserves, more accentuate in North America. This should be regarded with caution, since the region’s proved reserves would be bigger if Canada’s total recoverable oil reserves were included. However, there is no doubt that the decrease registered was caused by the intensive exploitation of oil reserves in the region, mostly in the USA. Regarding Western Europe, in 1994 and 1995 in Norway were discovered 3.4 billion barrels of oil.
Consumption
World oil consumption in 2007 was almost 86 million barrels per day, 1.36 times higher than in 1980, which means an annual average growth of 1.11%. Oil consumption growth was mainly caused by countries not pertaining to the two groups in focus. China and India, whose rapid growth rates are backed by more and more energy every year, are two of the most eloquent examples, but not the only ones. Also, there was a slight increase in the OPEC share of consumption and very little variation in the oil quantity consumed by G8.
Compared to the 1980 level, the consumption of OPEC countries in 2007 was 1.84 times higher, with an average annual growth rate of 3.8%. Despite this apparently enormous growth, the share of OPEC in total world oil consumption during the analyzed period is on average only 6.4%. There is a reasonable explanation why countries having more than two thirds of the world oil
Table 2. Total growth rate of proven world oil reserves 1980-1992 1992-2007 1980-2007
Middle East 82,54% 11,80% 104,34%
Latin America 69,53% 3,46% 81,93%
Eastern Europe -11,98% 120,11% 92,93%
Africa 13,92% 96,53% 127,25%
Asia and Pacific 4,91% 8,88% 14,65%
North America -18,13% -10,14% -29,22%
Western Europe 3,70% -15,28% -7,72%
Total World 53,82% 21,05% 87,33%
635
reserves, consume only a small share of what they produce. Due to their deep dependence on their oil industries, most of them have only a few other industries and they are not very energy intensive. Also, the immense gap between the rich and the poor, as well as the lack of a middle class, makes these countries attractive for few types of investments, among which their oil and gas industries are the most important. The developed countries use oil for transportation and heating. In the OPEC countries, most people do not have access to such commodities, thus the share in oil consumption is bound to remain low.
We modeled G7 consumption (i.e. G8 without Russia, for which data was not available) in order to see what influences it. For this we started the analysis with 6 independent variables, but, using backward entry method, in the final model remained only five: world oil price, G7 tax level, G7 imports and the interaction effects between the first and the second and between the second and the third. The interaction effect between world oil price and imports was removed from the model because it had no significant influence on the dependent variable. Thus, we will further on analyze the final model, without the removed variable.
The model summary tells us that 78.4% of the variance in consumption is explained by the five predictors used (R2=0.784). The fact that adjusted R2 is relatively close to the value of R2 tells us that the model generalizes quite well.
The analysis of variances (ANOVA) tests how well the model fits the data. For this purpose it uses the F-ration, which represents the variance explained by the model relative to the inaccuracy that still exists. The value of F (15.994) is highly significant, which means that the model fits the data well in most cases (p<0.001).
The main conclusions to be drawn are:
-The constant in the model equals 25852.9, which means that when all independent variables are zero, the consumption level will be 25852.9 thousand barrels per day;
-The world oil price has a negative influence on the G7oil consumption, the rise of a barrel with 1 US$ causing a decrease of the consumption of 96.8 thousand barrels per day;
-Increasing the G7 average tax on imported oil level also influences negatively consumption, every extra US dollar triggering a 243.1 thousand barrels per day reduction;
-The fact that G7 has to import the oil it uses means that this variable also correlates negatively with the depended variable. Its effects however are not as strong as those of the first two;
-The combined effect of taxes and price is not statistically significant in this model, but it was kept because it influences the other variables and without its influence some of the variables that are important and significant might have been removed;
-The combined effect of imports and taxes is significant, but it is not relevant because it influences very little the consumption.
World oil consumption grew with approximately 30% during the timeframe in focus, almost reaching 80 million barrels per day in 2007 and showing no signs of slowing down or leveling off. Due to the major impact of the mid-80s crisis, consumption growth rate was only 5% until 1992, equivalent to an average annual rate of 0.21%. However, the improving consumption habits that started to develop as a result of the strict conservation rules that were enforced as a consequence of the 1973 and 1979 crises quickly vanished leaving space for wasteful practices. This led to an annual growth rate of 1%, which meant additional 14.8 million barrels were used in 2007 compared to the 1992 level.
636
energy use and by increasing the efficiency of energy use in Eastern Europe, which is a consequence of their transition to democracy and market economy.
Further on, we used time series adjustment to see how much influence each region has on the total variance of world oil consumption.
During 1980 and 2007, annual world oil consumption was on average 66.6 million barrels per day. The adjusted value of world consumption was 759.6 thousand barrels per day bigger every year, the tendency of growth being obvious in the graph as well.
The only region that has systematic consumption decrease is Eastern Europe, which registers an adjusted value with 269.8 thousand barrels per day smaller than the one in the previous year. This is mainly due to reform in the economic activities of the countries, but other reasons like switching to natural gas can also be invoked. After the fall of the Soviet Union, countries that were in its sphere of influence that did not have significant oil reserves to satisfy their internal needs realized that cheap, abundant oil is not flowing into their economies anymore and that they need to buy it from the world market at much higher prices than they used to when they were importing it from USSR. This was a great stimulus for improving energy use efficiency and/or changing their energetic consumption structure.
The growing of world oil consumption is mainly due to the Asia-Pacific region (52.3%) which started to develop itself more and more in the period analyzed. Economic booms in China and India are the main factors for this growth. These economies, becoming more and more intensive in technology, have a great impact on the world scene and require high consumption levels also due to their big populations, which need more energy for their daily activities.
Almost 20% of the oil consumption in the world are due to North American states, which require a lot of energy in order to keep their industries functional. They have hi-tech economies and daily activities of economic agents are energy intensive. Another 20% of the total oil consumption is shared by Latin America and Middle East. Their oil consumption grew over the period analyzed due to reforms in the countries from the respective regions and to their development level, which is increasing. However, they still have a small share of the total oil consumption.
Western European region and the African one contributed with approximately the same shares in world oil consumption. There is an explanation why some of the most developed countries and some of the most underdeveloped countries in the world have similar influence on world oil consumption. African countries are still underdeveloped and their economies are quite primitive and non-energy intensive, while West European countries make increasingly more efforts to conserve energy and reduce pollution, which is translated into a relatively constant consumption level with a tendency of decreasing.
CONCLUSIONS
The world oil market is a very dynamic one and none of the players can maintain their control over it for a long time. However, there a few states that have a say in what happens on the market. These countries form two groups, one important due to its significant oil reserves and big production capacity (OPEC), the other because of its development level and its enormous consumption of oil (G8). The two groups work together on intensifying and improving the relationships between them with the view to achieving global energy security on terms acceptable for all market players.
637
oil. One of the consequences of these crises was the start of a debate related to oil fields’ peak and depletion and there were many predictions made regarding this subject.
REFERENCES
1. Appenzeller, T (2004), End of Cheap Oil, The National Geographic Magazine, June 2004, available at http://ngm.nationalgeographic.com/ngm/0406/feature5/
2. Botelho de Vasconcelos, J.M. (2009), Opening Address at the 152nd OPEC Conference, 15th of March 2009, available at
http://www.opec.org/opecna/Press%20Releases/2009/pr032009.htm
3. Brown, L.R. (2007), Is World Oil Production Peaking?, Eco-Economy Updates, Earth Policy Institute, available at http://www.earth-policy.org/Updates/2007/Update67.htm
4. King Hubbert, M. (1949), Energy from Fossil Fuels, Science Magazine, American Association for Advancement Studies, volume 109, number 2823, February 4th 1949, pp. 103-109, available at http://www.hubbertpeak.com/hubbert/science1949/
5. King Hubbert, M. (1956), Nuclear Energy and Fossil Fuels, Publication No. 95, Shell Development Company, Exploration and Research Division, Houston, Texas, available at http://www.hubbertpeak.com/hubbert/1956/1956.pdf
6. Roberts, P. (2008), Tapped Out, The National Geographic Magazine, June 2008, available at http://ngm.nationalgeographic.com/2008/06/world-oil/roberts-text
7. Ulrich, C (2008), When will the peak hit?, The National Geographic Magazine, June 2008, available at http://ngm.nationalgeographic.com/geopedia/World_Oil
8. Annual Oil Market Chronology, Energy Information Administration, US Department of Energy, available at http://www.eia.doe.gov/emeu/cabs/AOMC/Overview.html
9. OPEC Annual Statistical Bulletin 2007, available at
http://www.opec.org/library/Annual%20Statistical 20Bulletin/interactive/FileZ/Main.htm
10. Official Website of the G8 Presidency of the Russian Federation in 2006, available at http://en.g8russia.ru/