Original Article (Pages: 543-553)
Investigation on the Effectiveness of Holistic Multi-dimensional
Treatment Model (HMTM) in Improvement of CARS
Test
Indicators in Children suffering from Autism Spectrum Disorder
Maryam Hojjati11, *Ghasem Sadeghi Bejestani23, Farah Ashrafzadeh3
1
Noor Hedayat, Center of Autism Spectrum Disorders, Mashhad, Iran.
2
Department of Biomedical Engineering, Imam Reza International University, Mashhad, Iran.
3
Department of Pediatrics, Faculty of Medicine, Mashhad University of Medical Sciences, Mashhad, Iran.
Abstract
Introduction
The goal of research is investigation on the effectiveness of Holistic Multi-dimensional Treatment Model (HMTM) in improvement of CARS test indicators in children with Autism Spectrum Disorder (ASD) and it is done without pharmaceutical interventions, without names and accompanied by parental satisfaction questionnaire.
Materials and Methods
In this study with purposeful sampling method, 60 autistic children chosen randomly among 6-10 year-old patients were taken one year observation. At the beginning of this research they were taken the CARS pre-test and then in each month the complete behavioral HMTM checklist and the CARS test was taken. Observing HMTM treatment model, includes intuitive checklist with the aim of intuitive adjustment, abnormal behaviors checklist with the aim of decreasing them, individual behaviors checklist with the aim of increasing them and emotional interactive behaviors checklist with the aim of improvement that are conducted in statistical tables.
Results
Results shown a positive impact of HMTM in treatment trend of autism spectrum disorder considering sum of CARS points, also the effect on each CARS test parameters and CARS parameters improvements are meaningful holistic approach in HMTM method has interpreted some vague CARS parameters furthermore (P<0.05). The statistical properties of CARS test with HMTM treatment model, indicates that there was a high correlation coefficient and a significant relationship in behavior tables of HMTM and CARS test.
Conclusion
Holistic multi-dimensional treatment model has caused considerable and improvement children’s individual interactions and intuitive balance.
Key Words: Autism, ASD, CARStest, Children, HMTM.
*Corresponding Author:
Ghasem Sadeghi Bejestani, Department of Biomedical Engineering, Imam Reza International University, Mashhad, Iran.
Email: [email protected]
Introduction
Autistic spectrum disorders (ASD) describe a range of conditions classified as neurodevelopmental disorders, which are known by deficit in communication, social interactions and presence of repetitive patterns in behavior, interests and activities(1). These features often appear in the childhood. Recent epidemiologic studies have estimated the prevalence of autism spectrum disorders as one in every 88 children(2). Despite extensive research, there is still much controversy about the morphological, functional and neurological characteristics of people with autistic brains (3, 4). However, the neural basis of behavior changes in ASD has remained largely unknown.
Autism is characterized with disorders in three main areas of social interaction, communication and behavior. Autism is a
kind of developmental disorder
characterized by abnormal communication and verbal behaviors. The symptoms of this disorder, which are more common in boys than in girls, appear in the first years of life, and the main cause is unknown.
In 1940, two scientists, an Austrian American psychiatrist and physician, Leo Connor, American psychiatrist and physicians, and an Austrian pediatrician, medical theorist, and medical professor, Hans Asperger, independently described a new neurodevelopmental disorder and incidentally both called the disorder with a similar name as autism syndrome (derived from the Greek word 'autos' meaning self). Presence and contact with mobile phones and other devices relying on wireless technology – due to creation of magnetic fields density - air pollution, genetic factors and maternal mental conditions during pregnancy are as causes of autism. The prevalence of autism spectrum disorders has
been much more reported in the developed countries. This remarkable increase in the prevalence of the disorder is attributed to the changes made in methods of detection and reporting rather than to be a real biological increase (5).
There are two ways to study a system: Top -down and bottom-up approaches (6). In the bottom-up approach, called as component-oriented method, it is believed that a system (here, the child) is made up of components that the study of these components will result in the recognition and understanding the whole. Today, many treatment methods are based on this idea. In the top-down method, which is called holism, it is supposed that the whole is more than just the sum of components, and to recognize a
system, the interactions between
components must also be considered in addition to the components themselves. The
HMTM (Holistic multidimensional
treatment model) method is based on this idea (7).
Materials and Methods
Research Tools
The diagnostic tools in this study specialized diagnosis by a Child and Adolescent Psychiatrist and a diagnosis by the Evaluation Organization of Special Education. Also, the CARS test was used as pre-test and post-test at the beginning and end of each month to determine the severity of the disease. To this end, each child has two test scores per month, and the rate of change in the relevant items is the scores difference that the child is given at the end of each year. The research tools include the following:
This attitude has been formed through long-term direct experience with children with pervasive developmental disorder, and emphasizes on 6 axes:
1. Holistic view of the child;
2. Unconditional acceptance of the child and making a deep emotional connection between caregiver and child;
3. Physiology;
4. Movement & Perception; 5. Speech & Expression;
6. Affective, emotional,
communicational and play aspects.
Fig.1: HMTM model
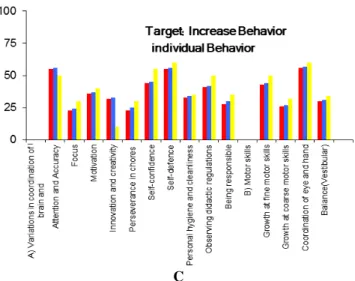
In this method (Figure.1), for evaluating the behavioral characteristics of the child, the child is examined and assessed in five areas of speech status, emotional and affective or engagement behaviors, senses, abnormal behaviors and individual behaviors. According to the test procedure, the relevant scores for the characteristics related to these five areas are recorded in each month, and finally, some graphs are plotted that can help to assess the treatment process. These charts that are given in the following were provided for 60 children with autism in four seasons of 2014; the patients' scores were extracted and used in the study (Fig 2).
CARS Test
This diagnostic and screening test for autism was developed and provided by Schopler in 1988 and has 15 items as follows:
1. Communication with people; 2. Imitation;
3. Bodily movements; 4. Emotional response; 5. Application of objects; 6. Adapt to changes; 7. Visual response; 8. Auditory response;
9. Response and use of taste, smell, and touch senses;
10.Fear or nervousness; 11.Verbal communication; 12.Non-verbal communication; 13.Function or activity level;
14.Level and stability of rational responses;
15.Overall impression (8-10).
Each item is scored in a seven-point grading scale. Low scores indicate the lower intensity of autism symptoms, while high scores indicate the severity of autism. Also, the scores sum on this scale indicates an overall score about the severity of autism spectrum disorders (Review of psychometric indices of autism diagnostic test). Each item includes the options of "No problem", "Little abnormal", "Moderate" and "Severe", which were given in order 1, 2, 3 and 4 scores. The total test score will be between 15 and 60 that regarding scores above 30, the diagnosis would be autism. The scores between 30 and to 36 indicate low to moderate autism, while scores between 36 and 60 reflect the severe autism (10).
Data analysis tools
correlation coefficient (r) is a method typically used to connect two quantitative variables. To calculate r, there must be at least two values (sizes) for each subject. It is often assumed that these two sizes should be at a distance level. The correlation coefficient can range from +1 to 0 and from 0 to -1. The value of +1 indicates a complete or positive correlation, and -1 indicates the complete and negative correlation.
A
B
C
Fig 2: An example of HMTM behavioral checklist
A correlation coefficient of zero indicates that there is no correlation between the two variables. It must be however understood that there is rarely a full correlation between the two variables in the behavioral sciences(11, 12).
The correlation coefficient also describes the type of relationship, meaning a being negative or positive. If a negative value means when one variable increases, the other decreases. If the value is positive, it means that both variables are likely to increase or decrease (12).
relationship or difference would be considered significant; or if the p-value is small, and represents a value of less than 0.05(12).
The standard deviation, as the most important dispersion index, was also used to demonstrate the scattering rate of data. Reporting the average value, without mentioning the variability or dispersion indices, will lead to misinterpretation of the data. The researchers tend to focus on measures of central tendency and neglect of their distribution pattern, while they are also equally important. The average of two data series may be the same, but their distribution would be different. If the distribution scores are similar, they would be called homogeneous (with low variability), and if the scores are not the same, they would be called heterogeneous (with high variability). Dispersion measures show the distribution rate or changes between the scores of a distribution(13, 14). Bar, pie and box graphs were also used to investigate the treatment trend.
Results
At first, the CARS data was divided As follows:
Number 1: Indicates the absence of disease;
Numbers between 1 and 2 indicate weak abnormality;
Numbers between 2 and 3 indicate moderate abnormality;
Numbers between 3 and 4 indicate severe abnormality.
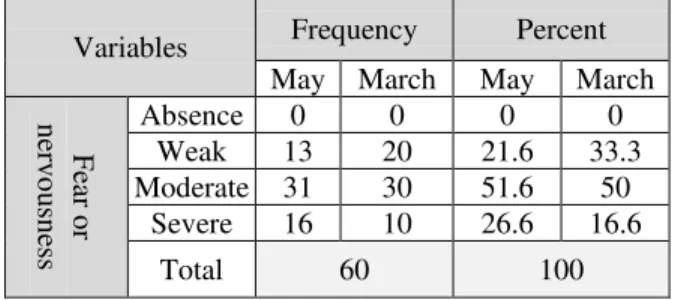
In fact, by reduced CARS score in March 2014, one can say that improvement has occurred. Then, only the fear or nervousness features and the CARS overall scores were studied (Table 1).
Table 1: Comparison of fear or nervousness in the pre-test and post-test
Variables Frequency Percent May March May March
Fear
or
nerv
ou
sness
Absence 0 0 0 0
Weak 13 20 21.6 33.3 Moderate 31 30 51.6 50
Severe 16 10 26.6 16.6
Total 60 100
In Table 1, characteristics of fear or nervousness in May and March 2014 (pretest and posttest) were compared with each other. In (Fig 3), for each month, the frequency and frequency percentage was calculated, and the following bar graph was plotted.
Fig 3: Comparison of frequency percentage
distribution of characteristics of fear or nervousness in A: May and B: March
A
B
Fig 4: Box graphs for fear or nervousness feature: A.
May, 2014; B. March, 2014
In (Fig 4), the box diagram shows that the distribution of data is symmetric. Given that the length of the rectangles in both months is the same, the scattering of data is the same as well. The lower mean in March indicates that 50% of data are less than 2.5, suggesting progress in the treatment trend.
A
B
Fig 5: Box plots for the sum of
CARS: A. May; B. March 2014
According to (Fig 5), one can conclude that the scattering of data in May is more than in March, and in March, the children CARS scores have decreased, showing an improvement in patients. Also in March, due to occurrence of mean in the middle of the rectangle, data distribution is more symmetrical than in May. Due to the lowed maximum in March compared to May, we can conclude that the CARS overall score of children has reduced, which represents the improvement in their condition.
Standard Deviation (SD)
The aim is to determine the distribution of data in each of the characteristics. Given that lower and closer to zero standard deviation value represents the higher congruence and similarity in the studied feature among the people, based on standard deviation results, we can say that the studied children with
autism are similar in all CARS
characteristics. However, the greatest similarity in March and May was seen in the level of activity, respectively as 0.6731 and 0.5785.
Correlation coefficient (r)
As mentioned above, one of the research objectives was to investigate the correlation between behavioral characteristics in HMTM and CARS tests in order to assess the HMTM method as a diagnostic test and a therapeutic method. To this end, the features of these two tests that would seem to be clinically relevant were studied and determined by Noor Autism Center experts.
between the two variables, here the features of the two tests. Also, there is a lower probability that the correlation coefficient obtained would be due to chance. For example, one can say that if p-value is equal to 0.05, the analysis suggests by 95% probability that the correlation coefficient obtained represents the relationship between the two variables, and there is only a 5% chance that the value is obtained by chance and coincidence. Thus, the smaller the p-value, the more reliable is the correlation coefficient.
It is also clear that most of the features that seem to be clinically relevant are really connected. Since, as dealing with human and study of human behaviors, even correlation coefficients greater than 0.5 are considerable. But in some cases, the features were not associated much that can be due to reasons such as errors in experimental and clinical techniques, low volume samples and the unavailability of complete scores for all month for everyone.
It should be noted that since the purpose of CARS test was reducing the score, while the aim of HMTM test in these features was increasing the behaviors, obtained negative values for the correlation would be reasonable.
Among the features surveyed, the following characteristics in CARS HMTM tests showed the highest correlation, i.e., greater than 0.7. It should be in these cases, the size of samples was more suitable.
1. Characteristic of verbal
communication in CARS test with features of phonation, speech imitation and comprehension of one-step sentences in HMTM test.
2. Visual response feature in CARS test with appropriate eye contact feature in HMTM test.
3. Characteristic of using objects in CARS test and sensorimotor games in HMTM test.
If we consider the correlation coefficients greater than 0.5 adequate and reliable, the following results can be found regarding the relationship between the characteristics of these two tests:
Every feature of CARS is associated with several features of HMTM. This means given the complexity and magnitude of autism spectrum disorders, the patients should be evaluated more precisely with more details for diagnosis and assessment of treatment process. For example, the characteristic of communication with the people examined in CARS test contains subsets that are important and raise various aspects of this type of communication. It can be concluded that HMTM test, which
examines each of the patient's
communication and behaviors separately in details, is more suitable for diagnosis and assessment of disease treatment process.
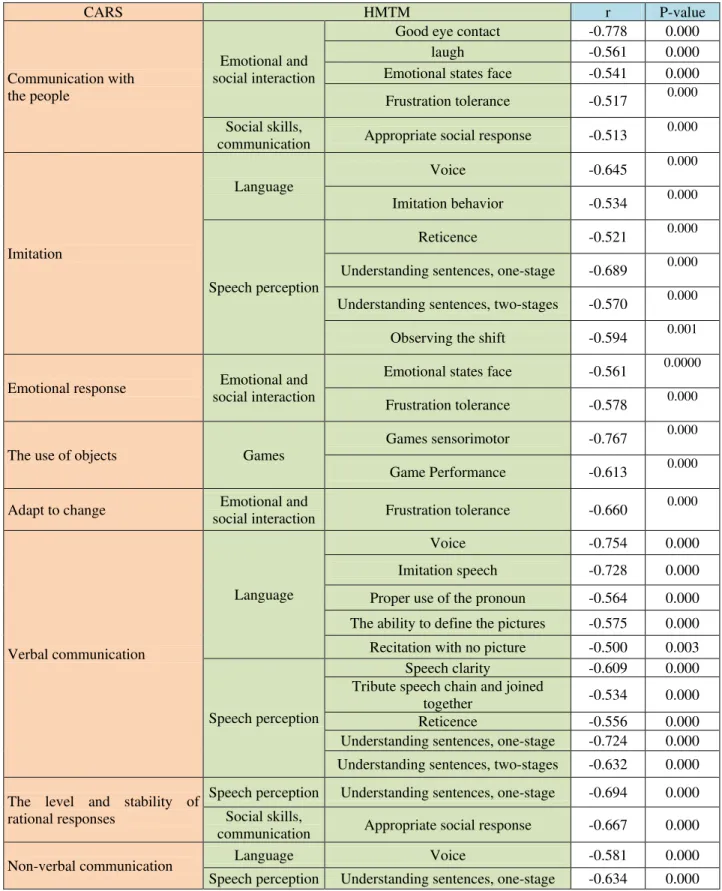
Some of CARS features having many relationships that with some features of HMTM according to the correlation coefficients obtained are specified in (Table 2). In fact, these tables show the connections that have been proven quantitatively.
In Table 3, another study of correlation coefficients between HMTM features, which were typically calculated in a chart and the features had high significant correlation
Conclusion
The data were related to children who were treated for one year by HMTM method that their CARS and HMTM tests were separately evaluated and then compared with each other.
We can say the children have progressed in many of the characteristics, and their conditions have changed from sever abnormal condition to moderate and even mild abnormal conditions. These findings indicate the effectiveness of the treatment method as behavioral therapy and based on special behavioral check lists. Another considerable point is the high relationship and correlation between CARS and HMTM features, which due to the complexity of autism spectrum disorders, may reflect the insufficiency of CARS features to examine and diagnose the children with autism. Each feature has subsets, and in addition to a holistic view of the children, their behavioral communicational characteristics should be examined in more details and more accurately. This can be effective in diagnosing the disease and assessment the treatment process. In this regard, HMTM can be more helpful than CARS for more accurate interpretation. In other words, the holistic approach in HMTM method could well interpret some ambiguous indicators in
CARS method. In addition, the
implementation of this model resulted in rapid and dramatic progress of children in improvement of individual transactions and sensory balances. Given the breadth and complexity of autism spectrum disorders, by increasing the sample size and receiving a more complete data set, other various aspects of the disease such as the impact of age, gender, environment and family and community connections on the current findings as well as analyzing the relationship or difference of brain signals of patients
together and with healthy children can be studied.
Conflict of interest: None.
Acknowledgment
We want to thank all of dedicated employees and authorities in Noore Hedayat Therapy Center, Mashhad- Northeastern Iran, for their full cooperation in doing this research.
References
1. Association AP. Diagnostic and statistical manual of mental disorders, (DSM-5®): American Psychiatric Pub; 2013.
2. Baio J. Prevalence of Autism Spectrum Disorders: Autism and Developmental Disabilities Monitoring Network, 14 Sites, United States, 2008. Morbidity and Mortality Weekly Report. Surveillance Summaries 2012; 61 (3): 1-19.
3. Calderoni S, Retico A, Biagi L, Tancredi R, Muratori F, Tosetti M. Female children with autism spectrum disorder: an insight from mass-univariate and pattern classification analyses. Neuroimage 2012;59(2):1013-22. 4. Schipul SE, Keller TA, Just MA.
Interregional brain communication and its disturbance in autism. Front Syst Neurosci 2011;5:10.
5. Verhoeven JS, De Cock P, Lagae L, Sunaert S. Neuroimaging of autism. Neuroradiology 2010;52(1):3-14.
6. Von Bertalanffy L. General system theory: Foundations, development, applications: George Braziller New York; 1968.
with ASD. Journal of Clinical Psychology 2010;2(2): 27-35.
8. Mayes SD, Calhoun SL, Murray MJ, Pearl A, Black A, Tierney CD. Final DSM-5 under-identifies mild Autism Spectrum Disorder: Agreement between the DSM-5, CARS, CASD, and clinical diagnoses. Research in Autism Spectrum Disorders 2014;8(2):68-73. 9. Mayes SD, Black A, Tierney CD. DSM-5 under-identifies PDDNOS: Diagnostic agreement between the DSM-5, DSM-IV, and Checklist for Autism Spectrum Disorder. Research in Autism Spectrum Disorders 2013;7(2):298-306.
10. Sturmey P, Dalfern S. The Effects of DSM5 Autism Diagnostic Criteria on Number of Individuals Diagnosed with Autism Spectrum Disorders: A Systematic Review. Review Journal of Autism and Developmental Disorders 2014;1(4):249-52.
11. ZHOU Z-h, BIN X-n, LEI Y-x. The Application of SPSS in Teaching of Medical Statistics [J]. Practical Preventive Medicine 2004;5:101.
12. Wang J-T, Jiang E-H, Wang X-G, Zhao X-R, Yao L. Application of SPSS technique in demonstration study data for statistics and analysis. Jisuanji Gongcheng yu Yingyong.Computer Engineering and Applications 2006;42(36):201-3.
13. Ling DZYPC. Application of SPSS Software in Orthogonal Design and Result Analysis [J]. Computer Study 2009;5:15-7.
Table 2: Correlated characteristics of HMTM and CARS based on quantitative data
CARS HMTM r P-value
Communication with the people
Emotional and social interaction
Good eye contact -0.778 0.000
laugh -0.561 0.000
Emotional states face -0.541 0.000 Frustration tolerance -0.517 0.000 Social skills,
communication Appropriate social response -0.513
0.000
Imitation
Language
Voice -0.645 0.000
Imitation behavior -0.534 0.000
Speech perception
Reticence -0.521 0.000
Understanding sentences, one-stage -0.689 0.000 Understanding sentences, two-stages -0.570 0.000 Observing the shift -0.594 0.001
Emotional response Emotional and social interaction
Emotional states face -0.561 0.0000 Frustration tolerance -0.578 0.000
The use of objects Games
Games sensorimotor -0.767 0.000 Game Performance -0.613 0.000 Adapt to change Emotional and
social interaction Frustration tolerance -0.660
0.000
Verbal communication
Language
Voice -0.754 0.000
Imitation speech -0.728 0.000 Proper use of the pronoun -0.564 0.000 The ability to define the pictures -0.575 0.000
Recitation with no picture -0.500 0.003
Speech perception
Speech clarity -0.609 0.000 Tribute speech chain and joined
together -0.534 0.000
Reticence -0.556 0.000
Understanding sentences, one-stage -0.724 0.000 Understanding sentences, two-stages -0.632 0.000 The level and stability of
rational responses
Speech perception Understanding sentences, one-stage -0.694 0.000 Social skills,
communication Appropriate social response -0.667 0.000
Non-verbal communication Language Voice -0.581 0.000
Table 3: Display of correlation coefficient between HMTM items with comparing the means
HMTM Cases r P-value HMTM
Voice
53 0.645 0.000 Imitation behavior Voice
29 0.540 0.002 Proper use of the pronoun Proper use of the pronoun
26 0.571 0.002 The ability to define the pictures
Speech clarity
29 0.767 0.000 Tribute speech chain and joined together Speech Clarity
40 0.722 0.000 Understanding sentences, one-stage Speech clarity
38 0.602 0.000 Understanding sentences, two-stages Speech clarity
33 0.614 0.000 Observing the shift Tribute speech chain and joined together
30 0.577 0.000 Understanding sentences, one-stage Tribute speech chain and joined together
29 0.557 0.001 Understanding sentences, two-stages Tribute speech chain and joined together 28 0.670 0.000 Observing the shift Understanding sentences, one-stage