Bull Pan Am Health Organ 14(2), 1980
AMBULATORY MEDICAL CARE SERVICES: ARE THEY
BEING USED APPROPRIATELY? 1, 2
PRIDES Task Force on Ambulatory Medical Care*
Sometimes health planning methods that seem excellent in theory prove difficult to apply. This article describes the straightforward
development and application of methodr used to analyze and im-
prove the operation of a health system in Cali, Colombia- methods that appear widely applicable to other areas.
Introduction
This article describes a method for meas- uring the work of public ambulatory care services against community needs. It also shows how a detailed index of appropriate care levels can be developed and how this index can help health administrators to evaluate health services use, coverage, and integration. In general, the method deline- ated is designed to help in planning the im- provement of health service delivery and evaluating changes made.
Background
Before the work described here got under- way, health planners in Cali, Colombia, were aware of low rates of health service coverage, overcrowding of some services (such as the Valle University hospital out- patient department) and underattendance at some he?ilth centers (I). In certain areas of
IAlso appearing in Spanish in the Roletin de la O/i- cina Sanitaria Panamericana, 1980.
2Study supported by Grant 72-003 from the Rockefel- ler Foundation to the Universidad de1 Valle in Cali, Colombia, and by resources of the Joint Colombia- PAHO/WHO Program for Research and Development of Health Service Systems (PRIDES).
*Principal authors: B. J. Selwyn, Sc.D., Assistant Professor, School of Public Health, The University of Texas, P.O. Box 20186, Astrodome Station, Houston, Texas 77025, U.S.A.: D. Conover, Ph.D.; and HipBlito Pabbn, M.D., PRIDES, Programa de Investigaci6n y Desarrollo de Sistemas de Salud, Apartado Aereo 4704. Cali, Colombia: and Carlos Agualimpia, M.D., Social Security Institute, Bogot& Colombia.
the city where health centers existed, 18 per cent of the children under 5 years of age had never visited a physician, and 40 per cent of the children under 5 had never re- ceived an immunization (2). The labor and delivery services of special health centers were underused and were unsuccessful in re- ducing overuse of the university hospital for normal deliveries.
Such circumstances, unique to neither Cali nor Colombia, are common in most Latin American countries (3, 4, 3). In seek- ing to cope with the problem, Colombian authorities have created a national health policy that calls for expanding actual levels of coverage by regionalizing services and adopting an integrated approach to health care delivery. This regionalization and inte- gration concept-designed to promote
prompt, efficient service and optimal re- source use (6)-makes health posts, centers, and units responsible for basic (lower level) care in local areas; gives larger facilities with scarce resources responsibility for pro- viding more sophisticated (higher level) serv- ices to wider areas; and relies on appropri- ate referrals upward and downward to transfer patients to appropriate care levels.
PRIDES Task Force . AMBULATORY MEDICAL CARE SERVICES 157
ing services must be reapportioned so that there will be closer agreement between use of the services and public need (5). Such reapportionment implies increasing the cov- erage provided to people in need, while curbing excessive use of services by people whose demands are disproportionate to their needs.
In the specific case of Cali, an Appropri- ate Level of Care (ALC) Index was devel- oped to evaluate the match between a scale of needs and a hierarchy of services- both derived from a regionalized model. This index constitutes a basic tool for increasing the efficiency of health service use because it detects poorly used or underused medical services, which can then be reoriented to in- crease the coverage of people with real and appropriate needs.
Other researchers have developed indexes to rate the urgency of illnesses presented in the emergency room (7) or to classify emergency room users by the type of relation- ship they have with the emergency room (8). But if efficient and appropriate use of serv- ices is the objective, then the complexity of the medical problems at hand is the most relevant concern, and the medical problems involved should be classified according to the levels of medical services required to care for them (5, 6).
In particular, we wanted to match up the type of condition or illness experienced with the place where good-quality treatment could be provided, in accord with the region- alized model, at the lowest possible level of sophistication and expense. For this purpose we developed two general types of indexes: quantitative ones measuring extension of the services used, the coverage provided, and the intensity of use; and a qualitative index indi- cating the appropriate care level.
Definition of Terms
A#-o@iate use is indicated in the Venn diagram shown in Figure 1. Appropriate use occurs when people use health services in a
manner consistent with their needs. Inappro- priate use occurs when people attending a health service do not need medical attention, or need attention that could best be provided elsewhere. Conversely, inappropriate nonwe (lack of coverage) occurs when people who are ill or in need of preventive services fail to receive care. Finally, the last alternative, appropriate nonuse, occurs when there is neither need nor use of services.
Extension of use is determined by the number of residents in a given area who are using health services, relative to the total number of residents in the area. It thus pro- vides information about community use and nonuse of services.
Coverage is a term based on a refinement of the extension of use concept, because it measures the proportion of people with a particular health problem in a community who receive adequate care for that problem. The coverage concept thus combines the ex- tension of use concept with the concept of total need of the population to show what portion of total need results in use.
Intensity of use reflects the frequency with which a particular person uses health services over a given period of time. Some health services are used repeatedly by a few people. Since existing services can attend no more than a finite number of people in a given time period, intensity of use tends to be in- versely related to extension of use. That is, if most of the available time is taken up by a few people who visit frequently, then the total number of people in the population using the service will be less.
The Appro@-iate Leuel of Care Index
158 PAHO BULLETIN . vol. 14, no. 2, 1980
Figure 1. A Venn diagram showing all combinations of appropriate and inappropriate use and nonuse of health services.
Appropriate
nonuse
Inappropriate
use
\
I
Lack of coverage
knowledge of the resources and equipment available to the different kinds of institu- tions, each physician worked independently with the various diagnostic categories in the
.hternational Classification of Diseases (8th Jietiion). Each diagnostic category (e.g. ,001 -typhoid) was considered at all antici-
pated levels of seriousnessd -that is, when the patient’s condition would be (A) serious or very serious, (B) slightly serious, or (C) not serious. Appropriate care facilities were then selected for each degree of severity, these facilities being (1) the university hospital, (2) the general hospital, (3) the health unit or local hospital (usually a health center with delivery rooms and/or a simplified surgery), (4) the health center, and (5) the health post.
‘The categories of seriousness used were based on those employed in the U.S. National Ambulatory Medical Care Survey (9).
Appropriate
use
The assignment of a particular facility (con- sidered equivalent to a particular level of care) to a given diagnostic category and degree of severity was based on the physi- cian’s judgment as to where adequate but not excessively costly or sophisticated attention could be provided. For example, a judge might have assigned “serious” (class A) ap- pendicitis cases to the general hospital, feeling that lower-level facilities would not possess the necessary resources, while the uni- versity hospital would draw on resources that were too costly or sophisticated and that should be reserved for more complex prob- lems.
PRIDES Task Force . AMBULATORY MEDICAL CARE SERVICES 159
Table 1. Examples of differences in the opinions of two judges developing the Appropriate Level of Care Index for Cali, Colombia.
classes ofseriowness A = very serious or serious B = slightly serious C = not serious
Afi~ro#mizte level of care 1 = university hospital 2 = general hospital 3 = health unit 4 = health center 5 = health post
0 = indicated class of seriousness does not apply for this diagnosis
Diagnostic codea
Judge I: Class of Judge II: Class of
seriousness seriousness
A B C A B C
001 002 003 004 005 006 083 084
Typhoid 3 4 0 3 4 4
Paratyphoid 3 4 0 3 4 4
Salmonella 3 4 0 3 4 4
Bacillary dysentery 3 4 5 3 4 5
Bacterial food poisoning 3 4 5 3 4 5
Amebiasis 3 4 0 3 4 4
Q fever, other
rickettsiosis b - - - -
Malaria 2 3 5 2 3 5
aInternational CkzssiJiation of Diseases (8th Revision). bDiagnosis does not normally occur in study region.
differing assignments were discussed and re- solved.
There were also a few conditions that the judges decided did not normally occur in the region-for example, Q fever and other rickettsioses (category 083) and spirochete- caused diseases other than syphilis (category 104). These diagnostic categories were ex- cluded from the index.
All three physician-judges agreed to the final decision about the appropriate level of care for each diagnostic category and degree of severity. The sum total of these decisions then came to constitute what became known as the Appropriate Level of Care (ALC) Index. Some examples of ALC Index entries are shown in Table 2. As the table indicates, the ALC assigned for most preventive care (such as categories Y40 and Y42) was the health post; also, relatively few diagnoses were judged to require university hospital care.
Table 2. Examples of selected diagnostic categories in the Cali Appropriate Level of Care Index
(see keys in Table 1).
Diagnostic categorya
Appropriate level of care for each class
of seriousness
A B C
009 Diarrhea1 disease 3 4 5
055 Measles 3 4 5
140 - 209 Neoplasms 1 2 0
250 Diabetes mellitus 2 3 4
260 - 269 Nutritional problems 2 3 4
320 Meningitis 2 3 0
380 Otitis media 0 0 4
410 Acute myocardial infarction 1 2 0
460 Colds 3 4 5
480 - 486 Pneumonia 2 3 4
650 Delivery without complica-
tions 0 0 4
Y40 Preventive: contacts with
infectious disease 3 4 5
Y42 Vaccination 5 5 5
N845 Sprained ankle 2 3 4
160 PAHO BULLETIN l vol. 14, no. 2, 1980
Afi$ication of the ALC Index. We used the index to evaluate the public ambulatory medical care services of Cali. However, be- cause we wanted to include data on nonusers of health services, information was gathered from the communities involved as well as from health service users. Personal interviews were employed to collect data on demo- graphic and socioeconomic characteristics, perceived morbidity, health service use patterns, reasons for the use or nonuse of services, and opinions about existing services. The policies and functions of each type of health service were examined.
All three surveys upon which the results re- ported here are based were performed in 1974. The first, conducted at emergency rooms and outpatient departments in two large Cali hospitals, used a systematic sample of all persons admitted for care during a one- month period. After each consultation, the attending physician was interviewed imme- diately to obtain his diagnosis, his opinion of the condition’s seriousness, and the follow-up course recommended. The second survey, similar to the hospital survey, was carried out in eight health centers located in a part of Cali where most people depended on the public sector for health care. The third survey collected information from a proba- bility sample of households in the area served by these health centers.
Overall, a total of 3,052 people in the communities served and 7,914 people attend- ing the ambulatory health services were inter- viewed. Of the latter, 1,638 were interviewed at the university hospital, 1,178 at the gener- al hospital, and 5,098 at the health centers. Nonresponse rates at the ambulatory services ranged from 8 to 14 per cent of the inter- views attempted, while the nonresponse rate in the community was 8 per cent. The total sample amounted to 1.4 per cent of the population in the area under study.
Extension and Intensity of Use
Regionalization of services means that the most sophisticated service, in this case the university hospital, should serve the largest area of all the services in the system. Frequently, however, the system’s specialized hospital becomes, in effect, a local or general hospital instead, and this appears to be what happened in Cali. As Table 3 indicates, there was little difference between the uni- versity hospital and the general hospital with regard to extension of the services provided. Moreover, the university hospital did not appear to be receiving patients from the larger region outside of the city it was meant to serve.
The health center’s designated area of in- fluence is much smaller than a hospital’s,
Table 3. Extension of services by area of residence, of ambulatory medical care users.
Hospital or health center used Users’ area of residence University hospital General hospital
Emergency Outpatient Emergency Outpatient Health Health Health
room department room department unit center post
(%I (%) (%) (%I (%) (%I (%)
Within the facility’s area of influencea
Outside the facility’s area of influence
Total
Number of users
95.8 96.1 97.3 97.0 57.6 67.9 84.3
4.2 3.9 2.7 3.0 42.4 32.1 15.7
100.0 100.0 100.0 100.0 100.0 100.0 100.0
834 804 547 631 998 725 343
PRIDES Task Force l AMBULATORY MEDICAL CARE SERVICES 161
and users have a wider selection of health centers from which to choose. As Table 3 shows, many Cali users came from outside administratively assigned areas of influence. Interestingly, the larger and more sophisti- cated the service, the lower the percentage of users residing in the designated area of in- fluence. The small health post had the highest percentage of users (84 per cent) coming from its small designated area, while the larger health unit had the lowest percent- age (57.6 per cent) coming from its larger designated area. There was some slight in- dication of a similar trend in the hospital data.
Overall, the average number of visits made by community members to health services over a six-month period, or intensity of use, was only 0.7 visits per person (Table 4). But as Table 4 also indicates, this was much less than the average number of visits being made by people already using the services of a health center or hospital. The data thus suggest that once a person used a service, recurrent use of the same service was likely.
Table 5 shows clearly that current users of a service were very likely to have used that
Table 4. Intensity of use of Cali ambulatory health services, showing average numbers of visits to health
facilities made by hospital patients, health center patients, and community members over
a six-month period.
Service Mean number of visits
per person
University hospital:a Outpatient department Emergency room General hospitaha
Outpatient department Emergency room Health centerb Communityb
4.4 2.8 4.8 2.8 3.4 0.7 aThe hospital averages shown are twice the rate of use reported for the three months before survey data were collected.
hThe health center and community averages shown are based on use of services during the six months before survey data were collected.
Table 5. Intensity of repeated use of Cali ambulatory health services.
Service used
y0 of patients % of patients using same using same service within service within last month last 3 months
Outpatient department of:
University hospital General hospital Emergency room of:
University hospital General hospital Health center
55.3 67.8
58.5 65.1
20.0 28.8
20.6 27.1
36.7 51.1
same service in the recent past. The emer- gency room figures are especially noteworthy, because one would not expect a service deal- ing only with specialized or complicated emergencies to generate many revisits.
Comparing the intensity of use with the extent of use (Table 5 with Table 3) sug- gested that the lack of extension of university hospital services was due in part to repeated use of those services by the same clientele. Hence, intensity appeared to be limiting ex- tension. Such limitation seems, to be an espe- cially great problem in areas like Cali, where the number of public consultations possible is severely restricted by available resources.
Community Coverage
162 PAHO BULLETIN . vol. 14, no. 2, 1980
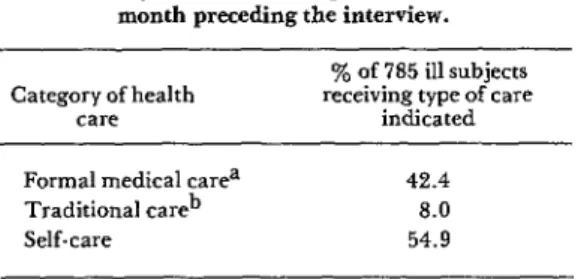
Table 6. Types of health care received by interviewed community members who reported illness in the
month preceding the interview.
Category of health care
‘% of 785 ill subjects receiving type of care
indicated
Formal medical carea 42.4
Traditional careb 8.0
Self-care 54.9
aFormal care includes that provided by physicians, hospitals, health centers, and clinics.
bTraditional care includes that provided by pharma- cists, curers, herbalists, and midwives.
Overall, 28 per cent of those reporting illness used outpatient services, 3 per cent were seen at an emergency room, and 13 per cent went to health centers (see Table 7). A higher percentage of those ill subjects covered by social security benefits received formal care than did those not entitled to such benefits. This could have been partly due to the lack of
Table 7. Ambulatory health service coverage provided to interviewed community members who reported
illness in the month preceding the interview.
Services
% of those ill using the indicated facilities Outpatient Emergency
departments rooms
Health units, centers, and posts
University hospital General hospital Total (all public am-
bulatory medical services) Other servicesa Social security system
(prepaid care) b Total ambulatory
medical servicesc
12.5 -
0.7 1.5
0.5 0.5
13.7 2.0
9.7 -
49.9 15.2
28.4 2.5
aOther services include services provided under group medical care plans (e.g., services for policemen, railroad workers, etc.) and private hospital services.
bThis calculation is based only on those entitled to social security benefits. These people seldom use public health care services, The denominator (total community population) used to calculate the other percentages shown did not include social security members.
cIncludes all public, private, other services, and social security system services.
financial barriers confronting members of the social security system.
Appropriate Use and Lack of Coverage
Obviously, not all ill people require formal medical attention. Many illnesses are self- limited and mild, so that a decision not to seek care is often appropriate. There arrives a point, however, when the decision not to seek care is inappropriate. Specifically, one would generally expect incapacity and the need for medical care to increase as the se- verity of illness increases. It also seems true that, by and large, people ill enough to be confined to bed most of the day tend to be more seriously ill and more in need of care than those who are incapacitated but not confined to bed.
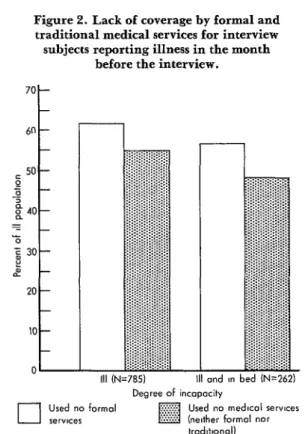
Of the 26 per cengof all interview subjects reporting illness the previous month, 33 per cent said they stayed in bed because of that illness. As Table 8 indicates, 43 per cent of those who stayed in bed made use of medical services-indicating that the level of appropri- ate use was on the order of 43 per cent. The fact that only 34 per cent of those not staying in bed made use of medical services indicates that the subjects were more likely to seek care when in need than when not in need. How- ever, lack of coverage for those in need was high (57 per cent), and did not appear to decline significantly with increasing need.
Figure 2 indicates that as need increased, lack of coverage by formal services declined a little less rapidly than lack of coverage by “all” services (including informal and tradi- tional services). This suggests that as need in- creased, subjects were increasingly likely to employ informal and traditional sources of care rather than formal medical services.
Maternal and Child Care
PRIDES Task Force . AMBULATORY MEDICAL CARE SERVICES 163
Table 8. Appropriate and inappropriate use of health services by community members reporting illness during the month before their interview.
Interview subjects’ use of medical services Level of need
of service? services Used Did not use services
(%) (%I
Total y0 of total
cases (%) No. of
cases
III and in need 42.9 57.1 100.0 wm 33.4
Ill, but not in need 33.9 66.1 100.0 (530) 66.6
No. of caws 294 502 796 100.00
=Subjects reporting illness were considered to have been in need of health services if they stayed in bed as a result of the illness.
X2=6.02, p<O.O5.
Figure 2. Lack of coverage by formal and traditional medical services for interview
subjects reporting illness in the month before the interview.
70 -
60 -
i 50 - 4
g 40-
E _
% z i!! 30- 2
20 -
10 -
0
III and I” bed IN=2621 Degree of incapacity
cl
Used no formal Used no medlcol serwces *erYIce*
kad~tmol)
munities involved had never been vaccinated, 32 per cent of the pregnant women inter- and that 26 per cent had not received any viewed received no prenatal care during the kind of well-baby control or visited a physi- six months before the interview. Postpartum
cian because of illness. care was even more neglected, 70 per cent of
Coverage for pregnant women was also the interview subjects who delivered saying
164 PAHO BULLETIN l vol. 14, rzo. 2, 1980
.
Intensity of Use versus Coverage
An intensity of use index helps to estimate a facility’s capacity to serve a given number of people, but it cannot estimate the degree of coverage attained. Information from the community served regarding the need for and use (or nonuse) of services is necessary in order to estimate the extent of coverage.
For instance, the foregoing data reveal a marked difference between the intensity with which prenatal care services were used by some women and the degree to which those services provided coverage for all. Alone, figures for the average number of visits per pregnancy might be interpreted as meaning nearly every woman received prenatal care on two occasions-which considering the re- sources available could constitute acceptable coverage. Yet we know that some women made up to seven visits, while others made none at all. Hence, it seems probable that some women in the community were over- using the service; while at the same time we know that 32 per cent of the group inter- viewed-at least in the six months before the interview-received no control services what- ever. In situations such as this, intense use of services by some may interfere with adequate coverage for all.
Similarly, those citing illness reported an average of 2.3 contacts per month with formal medical services; but 57 per cent of those ill enough to stay in bed had no formal medical contacts of any kind. Here again, since some sick people had many contacts while others had none at all, “average” intensity of use measurements derived from the total number of visits could give a distorted picture of coverage in the commu- nity.
Appropriate Care Levels
The ALC Index gave a qualitative dimen- sion to coverage and intensity measurements that was needed to evaluate current patterns
seriousness of each patient’s condition were assessed according to the criteria developed by the aforementioned physician-judges. By comparing the actual level of care used with the appropriate level (i.e., the one that should have been used), it was possible to gauge the degree to which each ambulatory service studied was used appropriately or in- appropriately.
The data in Table 9 indicate that both the emergency room and outpatient department of the university hospital were used inappro- priately by at least 65 per cent of the patients arriving there, but that inappropriate use of the health centers studied was less common. Using fairly loose standards (considering merely that the hospitals should provide care at one level and that health units, centers, and posts should provide care at another), the boxed-in figures in the table show the percentages of people who appeared to re- ceive care at a level reasonably appropriate for the nature and severity of their condi- tions. Using stricter criteria, however, it would appear that only 7 to 8 per cent of the people arriving at the university hospital were actually served at the appropriate level. Overall, it appears that the university hospi- tal was serving mainly as a primary care center.
PRIDES Task Force l AMBULATORY MEDICAL CARE SERVICES 165
Table 9. Percentages of ambulatory health service users receiving care at levels considered appropriate (italicized figures) or inappropriate.
Facility used
Appropriate facilities (levels of care) for the university hospital and health center cases studied. Italics indicate cases that received care at an appropriate level
University General Health Health Health Total Weighted
hospital hospital unit center post (%) No. of
(%I (%I (%I (%) (%I user+
University hospital emergency room University hospital
outpatient department Health units, centers,
and posts
4.9 27.7 30.1 30.4 4.9 100.0 4,440
8.3 26.5 27.4 32.4 5.4 100.0 4,818
1.4 12.4 17.1 45.6 23.5 100.0 4,867
aNumbers are weighted by the sampling fraction used. For example, one out of every 6 persons arriving at the university hospital outpatient department was selected for study. The number of study subjects was 803, multiplied by (weighted by) 6 = 4818.
Table 10. Percentages of ambulatory health service users from the city of Cali and from surrounding areas who received care at levels considered appropriate (italics) or inappropriate.
Service used and place of residence
Appropriate facilities (levels of care) for the hospital cases studied. Italics indicate
cases that received care at an
appropriate level Total cases studied
University hospital
(%I
General Health units, % No. of
hospital centers, or cases
(%) posts
(%)
University hospital outpatient department:
Cases from city Cases from surrounding area General hospital
outpatient department: Cases from city Cases from surrounding area
6.7 19.4 73.9 100.0 417
8.9 28.9 62.2 100.0 90
4.4 24.1 71.5 100.0 228
7.9 28.9 63.2 100.0 38
was attracting more than its share of primary care patients.
Referral Services
In theory, the regionalized nature of the system implied that a majority of patients attending the university hospital should have been referred from lower levels, through the system, to that hospital. Thus, we should expect to find the great bulk of health service users going first to the health posts, centers,
and units; and to find a large proportion of university hospital users being referred to that hospital from other facilities.
166 PAHO BULLETIN l vol. 14, no. 2, 1980
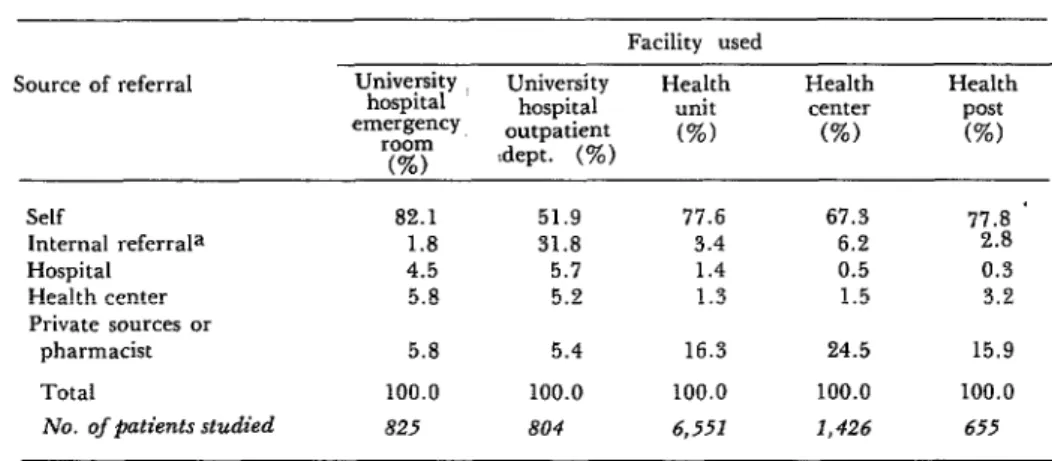
Table 11. Sources referring health service users to the university hospital and health units, centers, and posts.
Source of referral
Self
Internal referrala Hospital Health center Private sources or
pharmacist Total
No. of @ztients studied
Facility used University
hospital University Health unit Health center Health
emergency hospital post
room outpatient (%) (%) (%)
(%I :dept. (%)
*
82.1 51.9 77.6 67.3 77.8
1.8 31.8 3.4 6.2 2.8
4.5 5.7 1.4 0.5 0.3
5.8 5.2 1.3 1.5 3.2
5.8 5.4 16.3 24.5 15.9
100.0 100.0 100.0 100.0 100.0
825 804 6,551 1,426 655
aInternal referral means that a natient attending a particular health service was told to return to that same health service at a later date.
sources were apparently generating consider- able demand for lower-level health services. Since self-referrals and these private-source referrals appear to have accounted for the overwhelming majority of the attendance at health posts, centers, and units, the lower level of the system seems to have been func- tioning more or less as expected.
However, a substantial percentage of the university hospital outpatient department users (32 per cent) were referred to the department by physicians in the same institu- tion. Tables 4 and 5 demonstrate that use of the outpatient department was intense, and Table 9 shows that much of the use was in- appropriate. So the question becomes: Who was responsible for such intense and inappro- priate use? By checking the course of follow- up treatment that attending physicians recom- mended to study participants attending the outpatient department, we found that 86 per cent of these outpatients were told to come back to the outpatient department at some future date (see Table 12). Clearly, physi- cians within the institution were generating much of the intense use reported. In contrast, nearly half of the health center pa- tients were sent home with no follow-up- a pattern closer to the one expected for the level of care involved.
Table 12. Follow-up course indicated by attending physicians for cases seen at the university hospital
and health centers.
Follow-up received University hospital
by patient emergency outpatient Health room department centers
(%I (%I (%)
Referred back to
same institution 62.1 85.6 44.3
Sent home with no
other follow-up 26.7 6.5 48.8
Referred to another
institution 11.2 7.9 6.9
Total 100.0 100.0 100.0
Weighted No. of
patients= 4,602 4,488 4,836
aNumber of subjects in the sample is multiplied by the sampling fraction used.
PRIDES Task Force l AMBULATORY MEDICAL CARE SERVICES 167
Table 1.3. Percentages of patients referred back to appropriate levels of care by the attending physician.
Appropriate facilities (levels of care) for the university hospital and health center referrals studied. Italics indicate percentages of patients referred to
Facility used appropriate care levels.
University General Health Health Health Weighted
hospital hospital unit center post Total No. of
(%) (%) (%I (%) (%I (%I patientsa
University hospital emergency room University hospital
outpatient department Health units, centers, and
posts
5.7 26.8 33.8 29.8 3.8 100.0 1,368
8.7 19.8 29.7 35.4 6.4 100.0 3,642
1.4 9.2 18.4 47.7 23.3 100.0 2,087
aNumber of subjects in the sample is multiplied by the sampling fraction used.
pears that some 11 per cent of those referred back to the same facility should have been sent to the general or university hospital.
Discussion
We find the Appropriate Level of Care Index more consistent with our objectives than the urgency rating system used by Weinerman et al. (7) and Lavenhar et al. (IO). The urgency rating system indicates the seriousness of the problem and the time by which care is needed. For example, a rating of “emergency” suggests the problem must be cared for rapidly or death could result. The rating makes no direct judgment of the places where it would be best to care for such conditions, even though the emergency- room care is considered most appropriate for “emergency” and “urgent” problems (10: p. 369).
The ALC Index includes some elements of the urgency rating system by considering degrees of severity, but it also makes a direct judgment about where care should occur.
Lavenhar et al. (10) found that 59 per cent of the people arriving at the emergency rooms studied in the United States were using the services inappropriately. In Cali, we found that 65 per cent of the people studied were at an inappropriate care level (see Table 9). Initially, we expected to find more inappro-
priate use of emergency rooms being made in the United States. The unexpected reversal may be due to the differences between the two study designs and indexes. However, if we assume that Cali’s population experiences higher morbidity, especially acute morbidity, than that experienced in the United States, then the need for emergency-room services would be more acute. Considering that most Cali residents have fewer alternate sources of care, a lower standard of living, and a less sophisticated ability to judge medical needs, then the higher rate of inappropriate use ap- pears explicable. In any case, the important point is that, despite differing indexes and locales, most emergency room use was found to be inappropriate in both countries.
Coverage (as previously defined) can only be assessed with data obtained from the general population involved, because only such data will reflect overall population needs. For purposes of the present study, we equated need for health services (vis-a-vis an illness experienced during the month before the interview) with confinement to bed; and we defined use of a medical facility as re- ported use of a formal health service for that illness during that same month. We then estimated the degree of appropriate use (see Table 8) by dividing the total number in need (confined to bed) into the total number in need who used the formal health services.
168 PAHO BULLETIN l vol. 14, no. 2, 1980
relative to need known as the use-disability ratio. The ratio consists of the average number of physician visits versus the average number of disability days in a given time period. The disability days concept, shown to be a good indicator of need, includes both activity-loss days and bed-loss days. Since we agree with Hulka (12) that activity-loss days may be more subject to misunderstanding and fluctuation than bed-loss days, we used only bed-loss days in deriving our appropriate use index. Aday’s use-disability ratio (11) also fails to distinguish between intensity of use and extension of use. For these reasons we feel that our index of appropriate use by the population provides a better method for evaluating community coverage.
Taylor et al. (13) have formulated a symp- toms-response ratio for comparing need to use. Their index, which like ours depends on population data, suggests that the general U.S. population does not seek medical care any more or less often than is appropriate. The index is based on a panel’s judgment con- cerning the percentage of all people with a given symptom who would be expected to use health services. It makes no assessment of in- dividual need and use, of the most appropri- ate levels for delivering medical services, or of the degree of inappropriate use occurring in the population at large. There was no accu- rate way to apply this index to our study, since the definitions of what was “appropriate” were based on U.S. expectations.
Employing our own population data, we found that 61 per cent of all ambulatory medical service users made inappropriate use of those services; that is, they used the service when they were ill but did not need medical attention. This is similar to the situation found to prevail in the Cali hospital emergen- cy rooms and outpatient departments (see Table 9). At the same time, the 61 per cent figure is very different from the inappropriate use figure (14 per cent) found for health center patients. However, it should be noted that these two figures cannot be compared accurately, since there are differences in the appropriate use criteria involved. In the
population survey, a person ill enough to go to bed and using medical care was deemed an appropriate user. Hence, people with minor symptoms that might be predictive of later dis- ease were excluded from the appropriate use category. However, in classifying appropriate levels of care with the ALC Index, patients with such symptoms would often be classed as making appropriate use of the services in- volved. Furthermore, in gathering general population data, no distinction was made between levels of care at different facilities; that is, all formal medical care received by those in need (whether at health posts or emergency rooms) was deemed appropriate.
In addition, since the need of a person re- ceiving medical care was judged according to what the attending physicians gave as the diagnosis and severity of his condition, it seems possible that people visiting medical services were more apt to be judged “in need” than if they were encountered in the com- .munity.
Because of these problems, the ALC Index as applied to medical service users does not serve as an indicator of appropriate use within the community at large, nor can the appropri- ate use data for the community be applied to those who received medical care. As this makes clear, it would be very useful to develop an ALC Index that could be applied to com- munity data.
The community data gathered indicate that lack of coverage was a larger problem than inappropriate use. However, our hospi- tal data showed that inappropriate use was a very great proportion of all use. The indica- tion, again, is that inappropriate and intense use of available facilities was blocking use by others in need, and that community members in need required help in contacting appropri- ate services. Overall, it appears that not enough people in need were seeking care, and that those who did seek it were likely to arrive at an appropriate level of care. It also appears that users were likely to be asked by the at- tending physician to return to an inappropri- ate level of care (Table 12).
PRIDES Task Force l AMBULATORY MEDICAL CARE SERVICES 169
tern needs a mechanism for extending cover- age to those in need. This mechanism cannot act only within the health service, because waiting for people in need to demand care will not do the job. Instead, health personnel must make contact with those in need and stimulate them to seek care. At present, such community contact seems to afford the most efficient way of reaching the nonuser who needs care.
The additional problem of inappropriate use can be dealt with both inside and outside the health facilities involved. Outside, in the community, initial contacts with health workers should result in referrals to appropri- ate care levels (5). Inside, within the health services, users seeking inappropriate care should be referred to the appropriate level; and physicians within the services, especially the upper-level services, should not hesitate to refer patients down to less sophisticated levels where adequate care for the conditions in question can be received.
Our data suggested several ways in which the delivery system could be improved. At the time of the study, the university hospital had to turn away people seeking care there, many of whom would have been cared for appropri- ately at the university hospital level. The institution was obviously overcrowded with large numbers of patients receiving care at an inappropriate level, brought about in many cases by the hospital’s physicians, and many patients were reusing the hospital inappropri- ately on repeated occasions. Redistribution of patients to appropriate care levels was the only solution available if resources could not be expanded to meet the demand at the uni- versity hospital level. At the same time, it seemed clear that expansion of the university hospital would be a costly way to handle the problem.
Since the time of the study, the university hospital outpatient department has imple- mented a program of patient redistribution.
It has limited provision of services to new pa- tients referred from the health center level (health units, centers, and posts), other insti- tutions, or private physicians. People who arrive without referral are given a thorough orientation regarding the health centers in their areas, and are referred to those centers by a social worker. A balance is maintained in the outpatient department between known and new patients. Physicians at the university hospital have received instruction about the regionalized system and its operation. They now refer patients back to the health center level instead of to the hospital, thereby reduc- ing use of the hospital by known patients.
Changes are also occurring at the health center level. It is recognized that personnel policy will need changing, and more commu- nity-oriented care by volunteers and health promoters is being planned.
In general, it seems clear that the best way of reaching those who need care in the com- munity but do not use services is through com- munity contact. Education of the community in self-care and use of health units, centers, and posts must be given priority in order to prevent overcrowding of services when non- users become users. A further increase in in- appropriate use must be avoided.
Conclusions
The ALC Index concept can be applied to any system where the goal is to provide region- alized care with emphasis on primary care being offered close to community residents’ homes and referral to more specialized services. However, for any particular medical care system under study, an index specifically geared to the goals and customs of that system should be developed.
170 PAHO BULLETIN l vol. 14, 710. 2, 1980
index, survey-based estimates of health service and intensity of use, and between intensity of
extension, coverage, and intensity of use vis->- use and coverage. Hence, as data from the
vis the general population can provide in- Cali study serve to emphasize, when resources
formation about the dynamics of the system are limited and extension of coverage is the
within the community. Of course, there are goal, intense use and inappropriate use must trade-offs between health services extension be reduced.
SUMMARY
Health planners in Cali, Colombia, had long been aware of low rates of health service coverage in their area, as well as overcrowding of some services and underattendance at some health centers. To find out how the situation might be improved, an investigation of public ambulatory care services and the population’s health needs was carried out.
The main tool used to perform this work was an index listing the appropriate care levels for any particular health problem-based on the prob- lem’s severity and the particular diagnosis in- volved. This index was used to determine whether actual cases were being treated at appropriate levels of care. In addition, a general survey of community members was conducted to learn about people who were not using the health serv- ices and to help define the extent of health service coverage.
Among other things, the resulting data indi- cated that Cali’s university hospital, the most sophisticated medical facility in the area, was being used inappropriately by at least 65 per cent of the patients arriving at its outpatient depart- ment and emergency room. All in all, it appears that the university hospital was serving mainly as a primary care center.
A substantial share of those using the university hospital outpatient department had been referred to that department by university hospital physi- cians. What is more, 86 per cent of the outpa- tients surveyed were told by the physicians to return to the outpatient department at some fu-
ture date, a fact that helps to explain why re- peated inappropriate use of the department by the same individuals was commonplace.
These and other data suggested several ways in which Cali’s health delivery system could be im- proved. Since the time of the study, the university hospital outpatient department has implemented a program of patient redistribution. New patients coming to the outpatient department must be referred, and a balance is maintained between known and new patients. Physicians at the univer- sity hospital now refer most patients back to health centers, units, or posts instead of to the hospital, thereby reducing use of the hospital by known patients.
Information on community coverage indicates that 57 per cent of the interviewed did not receive it. Among pregnant women, 32 per cent received no prenatal care and among infants 37 per cent had not been immunized. Therefore, changes have algo been occurring at the health system’s lower levels, especially with regard to personnel policies and encouragement of more community- oriented care by health workers and volunteers.
The basic analytical methods employed in this case are applicable to any system where the goal is to examine “regionalized” services, i.e., services providing primary care close to community resi- dents’ homes and higher levels of care at more specialized referral facilities. However, study of any given medical care system should be based on a level of care index geared to the goals and customs of the particular system involved.
REFERENCES
(1) Agualimpia, C., and B. J. Selwyn. Project Determinants of Health Service Use/Nonuse
Proposal for the Study of Use of Medical Ambula- among Colombian Children. Paper presented at
tory Care Services in Cali. PRIDES: Programa de the 106th Annual American Public Health ASSO- InvestigaciBn y Desarrollo de Sistemas de Salud. ciation meeting held at Los Angeles, California,
Mimeograph. Cali, Colombia, 1973. 15-19 October 1978.
PRIDES Task Force . AMBULATORY MEDICAL CARE SERVICES 171
Year Health Plan for the Americas: Final Report of the III Special Meeting of Ministers of Health of the Americas. PAHO Official Document No, 118. Washington, D.C., 1973, p. 17.
(4) Behm, H., H. Gutikrez, and M. Requena. Demographic trends, health, and medical care in Latin America. Int J Health Serv 2:13-22, 1972.
(5) Castellanos Robayo, J. Improved health
(9) National Center for Health Statistics. Na-
tional Ambulatoy Medical Care Survey: Back- ground and Methodology, United States, 1967-72.
Vital and Health Statistics, Series 2, No. 61. DHEW Publication No. (HRA) 74-1335. United States Health Resources Administration, Wash- ington, D.C., 1974.
(10) Lavenhar, M. A., R. S. Ratner, and E. R. coverage: Coordination of health care levels and Weinerman. Social class and medical care: Indices primary health care. Bull Pan Am Health Organ of nonurgency in use of hospital emergency serv-
11(3):195-205, 1977. ices. Med Care 6:368-380, 1968.
(6) White, K. L. Life and death and medicine. (II) Aday, L. A. Economic and noneconomic
Scientzj?c Amen’can 229:23-33, 1973 (September). barriers to the use of needed medical services. Med
(7) Weinerman, E. R., R. S. Ratner, A. Care 12:447-456, 1975.
Robbins, and M. Lavenhar. Yale studies in am- (12) Hulka, B. Epidemiologic Basis of Health bulatory medical ca’re: V. Determinants of use of Services Research. Paper presented at the 104th hospital emergency services. Am J Public Health Annual American Public Health Association meet-
56:1037-1056, 1966. ing, Miami, Florida. October 20, 1976.
(8) Alpert, J. J., J. Kosa, R. J. Haggerty, L. (13) Taylor, D. G., L. A. Aday, and R. Ander- Robertson, and M. Heagarty. The types of fami- sen. A social indicator of access to medical care. J
lies that use an emergency clinic. Med Cafe 7:55- Health Sot Behav 16:39-49, 1975. 61, 1969.
NEW INFORMATION SYSTEM*
The Pan American Environmental Engineering and Sciences Information and Rocumentation Network (REPIDISCA) has been initiated by the Pan American Center for Sanitary Engineering and Environmental Sciences (CEPIS), a joint operation of PAHO and WHO.
The prime objective of REPIDISCA is to improve accessibility of.informa- tion on environmental engineering and sciences to users in then Region of the Americas. Initial emphasis is to be on water supply and sanitationin support of national efforts to achieve the goals of the U.N. Water Decade.
The activities of the REPIDISCA network are being implemented in col- laboration with national centers ready to participate; other centers will be in- corporated into .the network subsequently. Centers have been formed in Argentina, Brazil, Chile, Colombia, and Venezuela, and others are planned in Bolivia, Ecuador, Guatemala, and Jamaica. Each national center will col- laborate with appropriate institutions in its own country involved in sanitary engineering and environmental health.
CEPIS has developed a Microthesaurus (MISCA, preliminary version, May 1979) for indexing and vocabulary control, as well as manuals on the use of the Microthesaurus, indexing and document processing standards and techniques, and library procedures. REPIDISCA operations will be com- puter-based, making use of the ISIS computer software originally developed by the ILO.