socioeconomic indicators of the Brics countries
Pedro de Barros Leal Pinheiro Marino
Universidade de Brasília — UnB / Decanato de Planejamento e Orçamento Brasília / DF — Brazil
Rômulo Alves Soares
Universidade Federal do Ceará — UFC / Programa de Pós-Graduação em Administração e Controladoria
Fortaleza / CE — Brazil
Márcia Martins Mendes De Luca
Universidade Federal do Ceará — UFC / Programa de Pós-Graduação em Administração e Controladoria
Fortaleza / CE — Brazil
Alessandra Carvalho de Vasconcelos
Universidade Federal do Ceará — UFC / Programa de Pós-Graduação em Administração e Controladoria
Fortaleza / CE — Brazil
The purpose of this study is to investigate the relationship between the World Bank’s governance indicators and the socioeconomic development indicators of the Brics countries. The databases of a number of international organizations corresponding to the 2005-12 period were assessed using pa-nel data analysis. The results suggested a positive relationship between the HDI and the Government Effectiveness and Control of Corruption indicators, and between GDP and the Control of Corruption indicator, as well as a negative relationship between GDP and the Voice and Accountability and the Political Stability indicators. The explanatory power of the governance indicator dimensions in relation to the HDI is greater when compared to that of the dimensions of governance indicators related to GDP, which can be understood by the fact that the latter index only deals with the economic dimension whereas the HDI takes other factors into account.
KE Y W O R D S: governance indicators; socioeconomic development; Brics.
DOI: http://dx.doi.org/10.1590/0034-7612144359
Indicadores de governança mundial: relação com os indicadores socioeconômicos dos países do Brics
O estudo tem por objetivo investigar a relação entre os indicadores de governança do Banco Mundial e os indicadores de desenvolvimento socioeconômico nos países que formam o Brics. Foram utilizadas bases de dados de organizações internacionais do período de 2005 a 2012, aplicando-se a análise de dados em painel. Os resultados indicam relações positivas entre o IDH e os indicadores Eicácia do Governo e Controle da Corrupção e entre o PIB e o indicador Controle da Corrupção, além de uma relação negativa entre o PIB e os indicadores Voz e Responsabilização e Estabilidade Política. A capacidade explicativa das dimensões dos indicadores de governança em relação ao IDH é maior quando comparada à das dimensões dos indicadores de governança relacionadas ao PIB, o que pode ser entendido pelo fato de que o segundo indicador trata apenas da dimensão econômica, enquanto o IDH engloba outros fatores.
PA L A V R A S-C H A V E: indicadores de governança; desenvolvimento socioeconômico; Brics.
Indicadores mundiales de gobernabilidad: relación con los indicadores socioeconómicos de los países del Brics
El estudio tiene como objetivo investigar la relación entre los indicadores mundiales de gobernabilidad del Banco Mundial y los indicadores de desarrollo socioeconómico en los países del Brics. Se utilizaron bases de datos de organizaciones internacionales del período de 2005 a 2012, aplicándose el análisis de datos de panel. Los resultados indican relaciones positivas entre el IDH y los indicadores Efectividad del gobierno y Control de la corrupción y entre el PIB y el Control de la corrupción, además de una relación negativa entre el PIB y los indicadores Participación y monitoreo y Efectividad del gobierno. La capacidad explicativa de las dimensiones de los indicadores de gobernanza en relación al IDH es mayor cuando se compara con las dimensiones de los indicadores de gobernanza relacionados con el PIB, lo que puede ser entendido por el hecho de que el PIB trata apenas de la dimensión económica, mientras que el IDH engloba otros factores.
PA L A B R A S C L A V E: indicadores de gobernanza; desarrollo socioeconómico; Brics.
1. Introduction
For many years national economic development was essentially described in terms of impro-vement of macroeconomic indicators, such as national revenues and economic growth (Gay-gisiz, 2013). However, since 1990, when the irst Human Development Report was published by the United Nations Development Program (UNDP) (United Nations, 1990), the concept has been broadened to include not only national revenue accounting but also population-centered policies (Gaygisiz, 2013).
It is therefore urgent to identify other factors potentially contributing to human de-velopment at the local level. Kaufmann, Kraay and Zoido-Lobatón (1999) found a strong positive association between government effectiveness and human development. In their study, the importance of governance was supported by empirical evidence of a strong cau-sal relationship between the quality of national governance and development. Moreover, it has been argued that national governance also depends on the government’s legality and legitimacy (Mello, 2006).
According to Kissler and Heidemann (2006), the modernization of the German public sector carried out in the 1990s and 2000s made public administration more entrepreneurial, eficient and cost-conscious. However, the new model of administration turned out not to be-neit citizens as expected. Dissatisfaction with the modernization process led to the emergence of a new concept: that of public governance.
As explained by Bovaird and Löfler (2003), public organizations cannot be evaluated solely based on the quality of their services, but the way in which social, political and envi-ronmental responsibilities are tackled must be taken into account as well. In other words, governments should be evaluated based not only on the outcome of public policies but also on their level of success in the establishment of principles and practices of public governance.
In Brazil, government agencies have been restructured over the past two decades, with the adoption of the concept of governance and the implementation of policies of common interest, strengthening the interaction between public administration and society (Oliveira and Pisa, 2015). However, according to these authors and the principles of public governan-ce, timely and systematic monitoring of government effectiveness requires carefully designed instruments.
Jacques, Vicente and Ensslin (2013:2) described the development of governance indi-cators designed to measure national governance and compare economies. Gray (2007) stres-sed the role of institutional quantitative measures in studies on the relation between gover-nance and development and described indicators used as proxies for govergover-nance since the mid-1990s. According to Malik (2002), over 150 governance indicators have been used by international or private organizations and research institutes.
The world governance indicators (WGI) proposed by the World Bank are among the most widely used in studies on governance (Jacques, Vicente and Ensslin, 2013). Designed to quantify stakeholder perception of the quality of national governance, the WGIs allow, as their main advantage, to obtain accurate measures of government effectiveness and to make cross-country comparisons (Kaufmann, Kraay and Zoido-Lobatón, 1999).
limi-tations, but concluded that governance indicators are a useful assessment tool and source of information.
Emerging economies such as the Brics countries (Brazil, Russia, India, China and South Africa) are increasingly important in the global economic scenario and are thought to have the potential to surpass the U.S. economy by 2050 (O’Neil, 2001). However, social development has not kept up with the accentuated economic development experienced by these countries (Kapoor, 2014). This, according to Batabyal (2014), has led to a growing demand for good governance practices and democratic participation.
Considering the relevance of public governance to socioeconomic development and the importance of Brics in the global economic scenario, we formulated the following research question: what is the relation between WGIs and socioeconomic development indices in the Brics countries? Based on earlier studies (Rajkumar and Swaroop, 2008; Yang, 2010; Sturm, 2013), we adopted the study hypothesis that socioeconomic development in the Brics coun-tries is inluenced by WGIs.
In other words, the general objective of the study was to evaluate the relation between WGIs and socioeconomic development indices (measured by HDI and GDP growth rate) in the Brics countries.
The present investigation is justiied by the potential subsidies it provides for gover-nments looking to evaluate the quality of their governance. For example, our results may contribute to improving public policy making by identifying measures capable of addressing problems evidenced by such indicators, thereby favoring socioeconomic development (Yang, 2010; Sturm, 2013).
2. Socioeconomic development indicators
Deining the word ‘development’, though intuitively clear, is a challenging task from both the theoretical and practical standpoint due to the different assumptions and ideologies underpin-ning it (Sant’Ana, 2008). For example, until the last quarter of the 20th century, the concept of human development was almost synonymous with economic growth. Income was used as a proxy for usefulness, meaning a state of satisfaction of individual needs and desires (Sant’Ana, 2008). Sen (2010) has shown that the success of income as a proxy for development is explai-ned by the fact that income is more easily quantiiable than most other variables.
The understanding of human development essentially as a corollary of economic growth started to change in the 1970s. In the economic dimension, the Latin American debt crisis of the 1980s also contributed to changing the way human development is measured (Sant’ana, 2008). According to Scarpin and Slomski (2007), in addition to per capita income, modern concepts of human development take into account dimensions such as health, quality of me-dical services and education.
quality education and access to resources needed for a decent standard of living. With this ini-tiative, the UNDP laid out guidelines for moving up the HDI scale. As pointed out by Sant’Ana (2008), the HDI may be used to evaluate the level of success of social policies precisely becau-se it is multidimensional.
The HDI has since its creation been strongly associated with the idea of social well -being and has prompted much discussion on aspects of human development in academic and political circles and even in the wider community (Klugman et al., 2010). It is calculated by transforming the three dimensions of human development (longevity, education and income) into indices between 0 and 1, and combining them into a synthetic indicator (Reis, Silveira and Rodrigues, 2012).
Until 2010, the HDI corresponded to the arithmetic mean of the normalized indices of the dimensions of health, income and education, measured by ‘life expectancy’, ‘per capita gross national income (GNI)’, and ‘rate of literacy and schooling’, respectively. After 2010, the GNI was replaced with the GDP, while ‘mean years of schooling’ and ‘expected years of schoo-ling’ were adopted as proxies for education. In addition, the arithmetic mean was dropped in favor of the geometric mean (Klugman et al., 2010).
According to Pineda (2011), the change in formula increased the index’s ability to capture the effects of inequity and deprivation on human development. However, the author stressed the importance of employing complementary indicators to measure economic and social progress.
Jannuzzi (2002) criticized the HDI for being a synthetic social indicator created by com-bining simple measures. According to the author, this compromises the transparency and in-telligibility of social measures, making the indicator less sensitive to the effect of directed social policies. Nevertheless, Jannuzzi (2002) concluded that this limitation did not invalidate the HDI as a measure of well-being. Moreover, the UNDP’s support of the indicator makes it less vulnerable to criticisms and confers technical-political legitimacy to the analysis of social issues.
3. Socioeconomic development and world governance
The quality of government institutions is a key factor in human development because effective governments are more likely to implement sound and effective policies (Yang, 2010). Unsur-prisingly, Kaufmann, Kraay and Zoido-Lobatón (1999) found a strong positive correlation between government effectiveness and human development.
Governance may be broadly deined as traditions and institutions through which au-thority is exercised in a country. It includes the process by which governments are selected, monitored and replaced, the capacity of the government to effectively formulate and imple-ment sound policies, and the respect of citizens and the state for the institutions that govern economic and social interactions among them (Kaufmann, Kraay and Mastruzzi, 2009; World Bank, 2014). Jacques, Vicente and Ensslin (2013) concluded that ‘governance’ covers not only administrative procedures, but also interactions between the major agents of society: citizens, politicians and civil servants.
In this dimension, governance involves new principles and practices of public adminis-tration, such as decentralization, participation of citizens in the production of the common good, and new institutional arrangements (Andion, 2012).
From the economic perspective, by raising the GDP the establishment of effective eco-nomic institutions by the government has a positive impact on human development, although high GDP growth rates do not automatically translate into higher levels of human develop-ment (Yang, 2010). From the political perspective, human developdevelop-ment requires effective administration to manage social policies (Yang, 2010). According to the author, democratic political institutions are generally perceived to have a positive effect on human development. For example, based on life expectancy and literacy rates, Vollmer and Zielger (2009) conclu-ded that living in a democratic regime affects human development positively.
Kaufmann, Kraay and Zoido-Lobatón (1999) provided empirical evidence for the im-portance of governance and found a strong causal relation between good governance and good development results, including greater per capita income, higher rates of literacy and lower rates of infant mortality.
Rajkumar and Swaroop (2008) demonstrated empirically that the quality of governan-ce is a crucial factor in the analysis of the results of public spending on health and education. The authors calculated that an increase in public health care spending equivalent to 1% of the GDP leads to a 0.32% decrease in under-ive mortality in countries with good governance (according to the corruption index), a 0.2% decrease in countries with fairly good governan-ce, and no measurable decrease in countries with poor governance. Likewise, an increase in spending on public education equivalent to 1% of the GDP leads to a 0.7% decrease in ele-mentary school dropout rates in countries with good governance but no measurable decrease in countries with poor governance.
According to the World Bank (2003), governance affects spending eficiency in such a way that in corrupt systems, part of the resources allocated to increase human development eficiency is partially deviated. Moreover, the negative effects of poor governance increase when combined with natural effects. Thus, in Zimbabwe, the combination of drought, inadequate po-licies and poor governance resulted in severe regional food scarcity (World Bank, 2003).
It is therefore important to understand how public organizations meet their economic, social, political and environmental responsibilities, as relected in implemented governance principles and processes. The indicators used to quantify governance may also be used to evaluate the relation between governance and development (Gray, 2007). According to Malik (2002), private and international organizations and research institutes have proposed over 150 indicators of governance. In this study, we chose to use the time-tested world governance indicators (WGI) proposed by the World Bank due to their widespread acceptance (Jacques, Vicente and Ensslin, 2013).
4. World governance indicators
Introduced in 1996, the WGIs measure six dimensions of governance: i) voice and accounta-bility, ii) political stability and absence of violence/terrorism, iii) government effectiveness, iv) regulatory quality, v) rule of law, and vi) control of corruption. According to Kaufmann, Kraay and Zoido-Lobatón (1999), the WGIs were designed to measure subjective perceptions of quality of governance in different countries. The six dimensions (or aggregate indicators) draw together the perceptions of a large number of citizens, experts and corporations regar-ding the quality of governance in developed and developing countries (Kaufmann, Kraay and Mastruzzi, 2009; Gaygizis, 2013; World Bank, 2014).
The WGIs cover 215 countries and territories sampled every other year between 1996 and 2002, thereafter annually, using 31 data sources, from international agencies to think tanks, NGOs, private corporations and survey respondents (World Bank, 2014). The WGIs make it possible to measure important country-speciic aspects, such as the participation of ci-tizens in the selection of political representatives, freedom of expression, political stability and absence of violence/terrorism, among many others (Jacques, Vicente and Ensslin, 2013:2).
The use of WGIs provides insights into governance, which would be more dificult to obtain with strictly objective and quantiiable measures (Kaufmann, Kraay and Mastruzzi, 2009). Moreover, since practically all indicators of governance and the investment climate of a country depend on judgement to some extent, the distinction between ‘subjective’ and ‘objective’ may be a false dichotomy (Kaufmann, Kraay and Mastruzzi, 2009).
According to the World Bank (2014), in order to create the indicators, data sources are remodeled and combined using a statistical method called the ‘unobserved components model’. For each governance estimate, a margin of error is deined, which should be taken into account when conducting cross-country and longitudinal comparisons. These margins of error are related to the unavoidable imprecision associated to measuring governance among countries. Yet, they are decreasing over time as new data sources are incorporated. Moreover, WGIs margins are considerably smaller than for any individual source (Kaufmann, Kraay and Mastruzzi, 2009).
take into account differences in the needs and expectations of local or regional stakeholders; in other words, methods should be stakeholder-speciic (Bovaird and Löfler, 2003).
As observed by Jacques, Vicente and Ensslin (2013:10), some authors have tried to insert country-speciic social, economic and cultural variables into the indicators in order to reduce subjectivity and misinterpretations. Because of that, the underlying data (individual indicators) have been made available since 2006, as to help users identify and act on gover-nance aspects which may be particularly complex in a given country (Kaufmann, Kraay and Mastruzzi, 2006, 2007, 2008, 2009).
The relation between governance indicators and development has been the object of much research. In addition to the studies mentioned above, Amavilah (2009), Campbell (2013) and Sturm (2013) are worthy of note. Amavilah (2009) used WGIs to test the effect of governance on economic performance (GDP per capita) in 35 Sub-Saharan countries co-vering the years 2000, 2002 and 2007. The six dimensions of the WGIs and their mean were employed concurrently with other indicators of globalization and quality of education, health and life expectancy. Using multiple linear regression, the author concluded that governance had a strong positive inluence on economic performance in the sampled countries.
Campbell (2013) used four WGIs (government effectiveness, regulatory quality, rule of law and control of corruption) to test the hypothesis that corruption affects a country’s economic performance—performance measured by GDP growth rate. The sample included 10 countries for which the WGIs of the period 1999-2009 were available. The temporal series were submitted to regressions to test the ability of the WGIs to predict economic growth in 2010. The author found that, taken alone, the analyzed indicators of corruption were unable to predict the volatility of economic growth.
Sturm (2013) used WGIs to draw inferences regarding governance in Vietnam in the period 1996-2010. Using several regressions, the author concluded that poor performance in voice and accountability hindered the development of other WGIs in the country, with nega-tive impacts on the HDI.
Filling a gap in the reviewed literature, we speciically investigated the relation between WGIs and socioeconomic development indices (GDP growth rate and HDI) in Brics countries. Despite the declining growth rates over the past few years, especially after 2008, the Brics countries play an increasingly important role in the global scenario (Batabyal, 2014). Howe-ver, as pointed out by Kapoor (2014), the social development of these countries has not kept up with the economic development; in fact, almost half the world’s poor (deined as daily per capita income under two dollars) live in Brics countries. According to Batabyal (2014), economic growth in these nations brought with it an increased demand for good governance practices and democratic participation. Thus, the choice of the Brics countries as object of study is justiied by their international relevance and by the growing demand expressed by a majority of the population for greater effectiveness and transparency of public policies.
5. Methods
The present study is descriptive and documental, aimed at evaluating the relation between world governance indicators (WGIs) and socioeconomic development indices (GDP growth rate and HDI) in the Brics countries.
Retrieved from international institutional websites in April 2014, the analyzed data covered the period 2005-12. The WGIs were obtained from the World Bank (2014) while the HDI scores were obtained from the website of the UNDP (United Nations, 2013). GDP growth rates were obtained from the ANSD website (United Nations, 2013).
Chart 1 summarizes the variables used in the study, along with their respective sources and rationale.
C h a r t 1
Variables adopted in the study
Variable Description Rationale
GDP growth
rate Measures the annual variation in the GDP.
Amavilah (2009) Campbell (2013)
HDI Measures the development of a region based on education, income and life expectancy.
Yang (2010) Gaygisiz (2013)
Voice and accountability
Measures the perception of the extent to which a country’s citizens are able to participate in selecting their government, as well as freedom of expression, freedom of association, and a free media.
Amavilah (2009) Van Ryzin (2011)
Political stability
Measures the perception of the likelihood that the government will be destabilized or overthrown by unconstitutional or violent means, including politically-motivated violence and terrorism.
Amavilah (2009)
Government effectiveness
Measures the perception of the quality of public services, the quality of the civil service and the degree of its independence from political pressures, the quality of policy formulation and implementation, and the credibility of the government’s commitment to such policies.
Rajkumar and Swaroop (2008) Amavilah (2009) Yang (2010) Campbell (2013) Regulatory quality
Measures the perception of the ability of the government to formulate and implement sound policies and regulations that permit and promote private sector development.
Amavilah (2009) Campbell (2013)
Rule of law
Measures the perception of the extent to which agents have confidence in and abide by the rules of society, and in particular the quality of contract enforcement, property rights, the police, and the courts, as well as the likelihood of crime and violence.
Amavilah (2009) Van Ryzin (2011) Campbell (2013)
Control of corruption
Measures the perception of the extent to which public power is exercised for private gain, including both petty and grand forms of corruption, as well as “capture” of the state by elites and private interests.
Rajkumar and Swaroop (2008)
Amavilah (2009) Campbell (2013)
Panel data analysis was used to test the hypothesis that good public governance prac-tices result in higher socioeconomic development indices. Three tests were conducted to identify the most adequate model of panel data analysis: ixed-effects vs. random effects vs. pooledOLS. Developed by Hausman, the irst test may be used to compare the models of ixed effects and random effects with regard to adequacy (Greene, 2002), with the null hypothesis that the former is the most adequate. Proposed by Breusch-Pagan, the second test investigates the null hypothesis that pooled OLS is eficient at estimating the parame-ters (Greene, 2002). Finally, ixed-effects panel data were submitted to the F test which explores the hypothesis that coeficients associated with time-period dummy variables are statistically equal to zero, thereby establishing whether the effect of time should be taken into account (Greene, 2002).
Before the panel data analysis, we made a statistical description of the data, su-pported by tables and igures, in order to draw a proile of the sampled countries over the study period based on WGI dimensions and socioeconomic development indices. We used Microsoft Excel spreadsheets and the software Stata v.11 to manage data and conduct analyses.
6. Results
The analyses of HDI, WGI and GDP growth rate data was performed using metrics and tools of descriptive statistics. WGI data was analyzed separately in all six dimensions, then in aggrega-ted form, based on mean values. HDI values and GDP growth rates range from 0 to 1 (though the latter can be negative). WGI values range from -2.5 to 2.5, but in this study the values were divided by 2.5 to keep them within the range of -1 to 1, making them easier to correlate with the dependent variables of the study (HDI and GDP growth rate).
The variation in HDI scores in the ive Brics countries, from 2005-12 is shown in graphic 1. According to the Human Development Report (United Nations, 2013), the HDI is classiied as ‘high’ in Brazil and Russia and ‘medium’ in South Africa, China and India. The UNDP clas-siication is based on quartiles (1st quartile=very high, 2nd quartile=high, 3rd quartile=me-dium, and 4th quartile=low). The irst three quartiles include 47 countries; the last quartile includes 46.
Graphic 1 shows a steady growth in the HDI scores of the ive countries (Russia declined slightly in 2009 but resumed growth the following year). Growth was most accentuated in China and India, with a positive variation of over 9% between 2005 and 2012, and least ac-centuated in South Africa, Brazil and Russia, with a positive variation of less than 5%.
G r a p h i c 1
Evolution of HDI scores, 2005-12
Brazil
Russia
India
China
South Africa
Source: The authors.
G r a p h i c 2
Evolution of the GDP growth rate, 2005-12
Brazil
Russia
India
China
South Africa
Brazil, Russia and South Africa displayed negative GDP growth rates in 2009. In contrast, the GDP growth rates of China and India were positive, indicating considerable economic strength. This may in part explain the signiicant improvement in HDI scores observed in these two countries (graphic 1) (per capita income is one of the dimensions of the HDI).
Tables 1 to 7 show the results for each of the six WGIs. The tables include annual igu-res for all ive Brics countries as well as mean, minimum and maximum values and standard deviation.
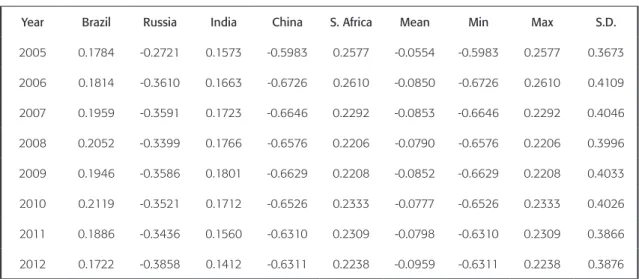
Table 1 shows the results for the indicator ‘voice and accountability’. Values are mo-derately positive for Brazil, India and South Africa, and negative for Russia and China. It should be kept in mind that Russia and China were facing dificulties with regard to popular participation in setting the country’s political course, the perceptions of which are captured by this indicator, as evidenced by the ineffectiveness of enforcement and monitoring agencies of the executive branch. This is according to Azahaf and Schraad-Tischler (2013) relected in the WGI.
Ta b l e 1
Voice and accountability, 2005-12
Year Brazil Russia India China S. Africa Mean Min Max S.D.
2005 0.1784 -0.2721 0.1573 -0.5983 0.2577 -0.0554 -0.5983 0.2577 0.3673
2006 0.1814 -0.3610 0.1663 -0.6726 0.2610 -0.0850 -0.6726 0.2610 0.4109
2007 0.1959 -0.3591 0.1723 -0.6646 0.2292 -0.0853 -0.6646 0.2292 0.4046
2008 0.2052 -0.3399 0.1766 -0.6576 0.2206 -0.0790 -0.6576 0.2206 0.3996
2009 0.1946 -0.3586 0.1801 -0.6629 0.2208 -0.0852 -0.6629 0.2208 0.4033
2010 0.2119 -0.3521 0.1712 -0.6526 0.2333 -0.0777 -0.6526 0.2333 0.4026
2011 0.1886 -0.3436 0.1560 -0.6310 0.2309 -0.0798 -0.6310 0.2309 0.3866
2012 0.1722 -0.3858 0.1412 -0.6311 0.2238 -0.0959 -0.6311 0.2238 0.3876
Source: The authors.
Note the overall stability throughout the period. South Africa displayed the best results every year, while China performed the worst. Due to the strongly negative values of China and Russia, the mean of the Brics group was consistently negative.
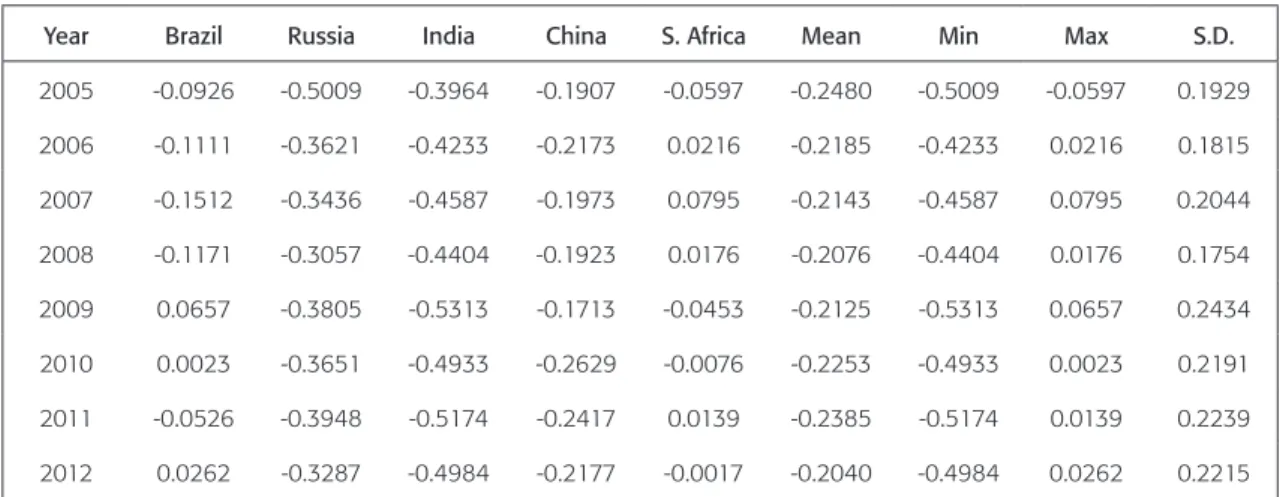
Ta b l e 2
Political stability, 2005-12
Year Brazil Russia India China S. Africa Mean Min Max S.D.
2005 -0.0926 -0.5009 -0.3964 -0.1907 -0.0597 -0.2480 -0.5009 -0.0597 0.1929
2006 -0.1111 -0.3621 -0.4233 -0.2173 0.0216 -0.2185 -0.4233 0.0216 0.1815
2007 -0.1512 -0.3436 -0.4587 -0.1973 0.0795 -0.2143 -0.4587 0.0795 0.2044
2008 -0.1171 -0.3057 -0.4404 -0.1923 0.0176 -0.2076 -0.4404 0.0176 0.1754
2009 0.0657 -0.3805 -0.5313 -0.1713 -0.0453 -0.2125 -0.5313 0.0657 0.2434
2010 0.0023 -0.3651 -0.4933 -0.2629 -0.0076 -0.2253 -0.4933 0.0023 0.2191
2011 -0.0526 -0.3948 -0.5174 -0.2417 0.0139 -0.2385 -0.5174 0.0139 0.2239
2012 0.0262 -0.3287 -0.4984 -0.2177 -0.0017 -0.2040 -0.4984 0.0262 0.2215
Source: The authors.
India was the most politically unstable country in the period, followed by Russia, when measured with World Bank indicators.
Table 3 shows the results for the indicator ‘government effectiveness’. Brazil and Russia displayed negative values throughout the period, indicating a negative perception of public services on part of the population. Again, South Africa displayed the best results every year, despite a tendency to decline.
Ta b l e 3
Government effectiveness, 2005-12
Year Brazil Russia India China S. Africa Mean Min Max S.D.
2005 -0.0397 -0.1837 -0.0336 -0.0368 0.2578 -0.0072 -0.1837 0.2578 0.1613
2006 -0.0920 -0.1798 -0.0183 0.0330 0.2013 -0.0111 -0.1798 0.2013 0.1433
2007 -0.0797 -0.1503 0.0444 0.0763 0.1966 0.0175 -0.1503 0.1966 0.1359
2008 -0.0373 -0.1376 -0.0119 0.0607 0.2072 0.0162 -0.1376 0.2072 0.1282
2009 -0.0383 -0.1589 -0.0021 0.0454 0.1902 0.0073 -0.1589 0.1902 0.1272
2010 -0.0158 -0.1794 0.0068 0.0408 0.1571 0.0019 -0.1794 0.1571 0.1212
2011 -0.0472 -0.1815 -0.0020 0.0382 0.1643 -0.0056 -0.1815 0.1643 0.1260
2012 -0.0497 -0.1703 -0.0725 0.0025 0.1301 -0.0320 -0.1703 0.1301 0.1102
Table 4 shows the results for the indicator ‘regulatory quality’. Negative values were registered for Russia, India and China throughout the period. This was not unexpected since government intervention in the economy is very strong in these countries and the indicator measures the perception of the ability of the government to implement policies promoting private sector development (Azahaf e Schraad-Tischler, 2013).
Ta b l e 4
Regulatory quality, 2005-12
Year Brazil Russia India China S. Africa Mean Min Max S.D. 2005 0.0164 -0.0709 -0.0972 -0.0528 0.2687 0.0129 -0.0972 0.2687 0.1491 2006 -0.0134 -0.1645 -0.0934 -0.0723 0.2844 -0.0118 -0.1645 0.2844 0.1742 2007 -0.0093 -0.1160 -0.1066 -0.0600 0.2109 -0.0162 -0.1160 0.2109 0.1338 2008 0.0261 -0.1579 -0.1429 -0.0525 0.1991 -0.0256 -0.1579 0.1991 0.1459 2009 0.0438 -0.1419 -0.1213 -0.0807 0.1605 -0.0279 -0.1419 0.1605 0.1276 2010 0.0658 -0.1460 -0.1477 -0.0875 0.1430 -0.0345 -0.1477 0.1430 0.1319 2011 0.0709 -0.1441 -0.1340 -0.0839 0.1621 -0.0258 -0.1441 0.1621 0.1358 2012 0.0364 -0.1423 -0.1890 -0.1033 0.1514 -0.0493 -0.1890 0.1514 0.1403
Source: The authors.
The Brazilian government also intervenes considerably in the economy, though not as strongly as in Russia, India and China (Azahaf and Schraad-Tischler, 2013). This explains the country’s slightly better performance in this dimension. As with previous indicators, South Africa obtained the best results in the group.
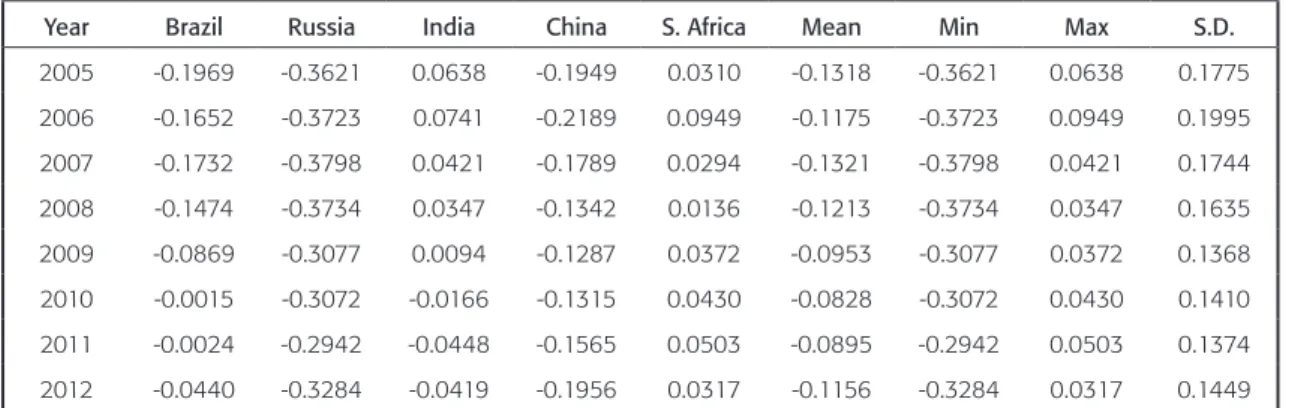
Table 5 shows the results for the indicator ‘rule of law’. Note that conidence in insti-tutions of law enforcement, such as the police and the courts, is relatively weak in all ive countries.
Ta b l e 5
Rule of law, 2005-12
Year Brazil Russia India China S. Africa Mean Min Max S.D.
2005 -0.1969 -0.3621 0.0638 -0.1949 0.0310 -0.1318 -0.3621 0.0638 0.1775
2006 -0.1652 -0.3723 0.0741 -0.2189 0.0949 -0.1175 -0.3723 0.0949 0.1995
2007 -0.1732 -0.3798 0.0421 -0.1789 0.0294 -0.1321 -0.3798 0.0421 0.1744
2008 -0.1474 -0.3734 0.0347 -0.1342 0.0136 -0.1213 -0.3734 0.0347 0.1635
2009 -0.0869 -0.3077 0.0094 -0.1287 0.0372 -0.0953 -0.3077 0.0372 0.1368
2010 -0.0015 -0.3072 -0.0166 -0.1315 0.0430 -0.0828 -0.3072 0.0430 0.1410
2011 -0.0024 -0.2942 -0.0448 -0.1565 0.0503 -0.0895 -0.2942 0.0503 0.1374
2012 -0.0440 -0.3284 -0.0419 -0.1956 0.0317 -0.1156 -0.3284 0.0317 0.1449
Brazil, China and Russia displayed strongly negative values throughout the period. South Africa was the only country with consistently positive values.
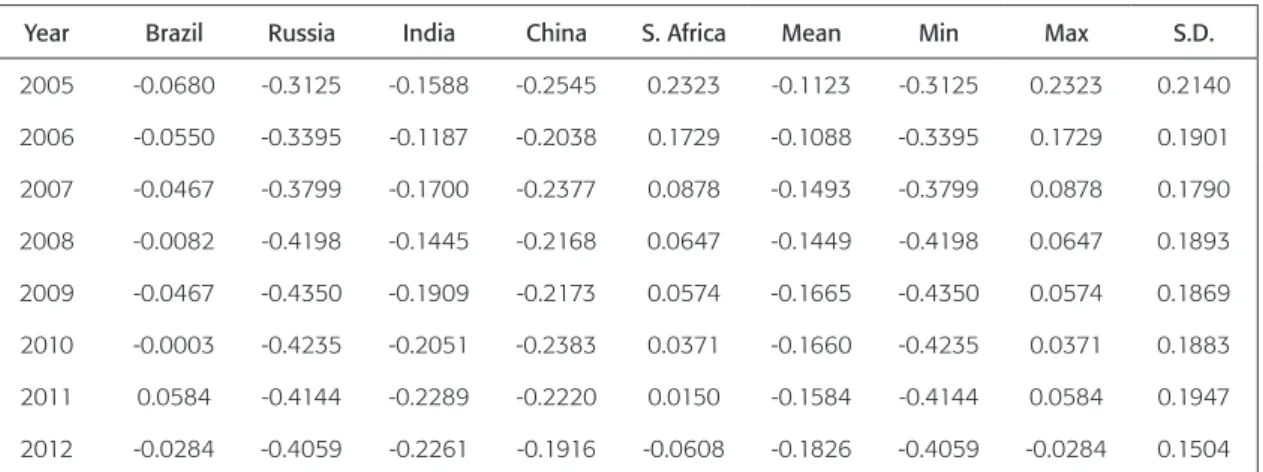
Table 6 shows the results for the indicator ‘control of corruption’. The values are neg-ative for the entire Brics group. In addition to measuring the extent to which public power is exercised for private gain, the indicator is also sensitive to the level of social inequality. This may explain the higher values observed for Russia, China and India where social inequality is on the rise, according to the UNDP (United Nations, 2013). In the irst two countries, a num-ber of state-controlled companies were privatized, leading to the emergence of oligarchies and compromising previously perceived economic beneits (Saran, Singh and Sharan, 2013).
Ta b l e 6
Control of corruption, 2005-12
Year Brazil Russia India China S. Africa Mean Min Max S.D.
2005 -0.0680 -0.3125 -0.1588 -0.2545 0.2323 -0.1123 -0.3125 0.2323 0.2140
2006 -0.0550 -0.3395 -0.1187 -0.2038 0.1729 -0.1088 -0.3395 0.1729 0.1901
2007 -0.0467 -0.3799 -0.1700 -0.2377 0.0878 -0.1493 -0.3799 0.0878 0.1790
2008 -0.0082 -0.4198 -0.1445 -0.2168 0.0647 -0.1449 -0.4198 0.0647 0.1893
2009 -0.0467 -0.4350 -0.1909 -0.2173 0.0574 -0.1665 -0.4350 0.0574 0.1869
2010 -0.0003 -0.4235 -0.2051 -0.2383 0.0371 -0.1660 -0.4235 0.0371 0.1883
2011 0.0584 -0.4144 -0.2289 -0.2220 0.0150 -0.1584 -0.4144 0.0584 0.1947
2012 -0.0284 -0.4059 -0.2261 -0.1916 -0.0608 -0.1826 -0.4059 -0.0284 0.1504
Source: The authors.
The indicator improved in Brazil, most likely as a result of the 21% reduction observed in social inequality between 1995 and 2004, according to the Brics Report (India, 2012), and a reduction in the percentage of the population living in extreme poverty (daily per capita income under 1.25 dollars) from 15% (mid-1995) to 5.5% (2007). South Africa displayed higher and consistently positive values.
The Brics countries are generally characterized by considerable regional socioeconomic differences. For example, the per capita PIB of the most developed regions of Russia and China may be up to 20 times greater (and growing) than that of the least developed regions. Nev-ertheless, in the case of Brazil, the historically most disadvantaged region the Northeast developed faster than other regions, aided by microcredit and welfare programs (Saran, Singh and Sharan, 2013).
indi-cators declined overall, except ‘voice and accountability’. The positive performance of Brazil was due to improvement in the perception of political stability, regulatory quality, rule of law and control of corruption. The observed evolution of the Brazilian indicators is supported by the results of Azahaf and Schraad-Tischler (2013), who concluded Brazil is the most promi-sing of the Brics countries with regard to quality of governance.
G r a p h i c 3
Evolution of mean WGI, 2005-12
Brazil
Russia
India
China
South Africa
Source: The authors.
The unique behavior of the South African indicators in relation to the other four Brics countries, as evidenced by our descriptive analysis of the WGIs, may be explained by the rea-son for its inclusion in the Brics group. That is, South Africa holds a leading economic position on an otherwise historically underrepresented continent, but differs considerably from the other four countries with regard to socioeconomic proile (Almeida, 2011).
Azahaf and Schraad-Tischler (2013) attributed part of their dificulty in conducting re-search on governance in the Brics countries to the vastness or the territories and populations involved. Thus, the superior performance of South African indicators may also be explained by the smaller and more manageable geographic area and population, compared to the rest of the group.
In the Hausman test, the null hypothesis was rejected for the HDI panel, but not for the GDP growth rate panel. We therefore chose the ixed-effects model for the former and the random-effects model for the latter.
In Breusch-Pagan test, the null hypothesis was again rejected for the HDI panel, but the evidence was insuficient to reject it for the GDP growth rate panel. It was thus concluded that the ixed-effects model was the most adequate choice for the HDI panel, while pooled OLS was indicated for the GDP growth rate panel.
In the F test, the null hypothesis was rejected for the HDI panel. In other words, the model should take into account the effect of time. The result of the F test for the GDP growth rate panel conirmed that pooled OLS was the most adequate choice. The results of the three tests are presented in table 7.
Ta b l e 7
Results of model adequacy tests
Hausman Breusch-Pagan F
HDI GDP growth (%) HDI GDP growth (%) HDI GDP growth (%)
Result 181.87 7.70 36.30 2.17 29.68 1.91
p-value 0.00 0.26 0.00 0.14 0.00 0.13
Source: The authors.
Based on these results, we performed regressions to evaluate the inluence of WGI-mea-sured governance dimensions on socioeconomic development meaWGI-mea-sured by HDI and GDP growth rate. The results are shown in table 8.
Ta b l e 8
Results of regressions of panel data
Dependent variable HDI GDP growth (%)
Coefficient p-value Coefficient p-value Explanatory variables
Voice and accountability 0.058 0.303 -0.093 0.005
Political stability -0.007 0.704 -0.107 0.096
Government effectiveness 0.097 0.040 -0.071 0.577
Regulatory quality -0.053 0.317 -0.165 0.268
Rule of law -0.418 0.162 0.004 0.969
Control of corruption 0.048 0.069 0.250 0.014
Constant 0.643 0.000 0.062 0.000
R² 0.948 0.465
Adjusted R² 0.521 0.383
F test 30.600 28.630
Pr> F 0.000 0.000
‘Government effectiveness’ was the most signiicant variable in the HDI model (p<0.05) while ‘control of corruption’ was signiicant at the level of 10%. Both indicators were positive-ly associated with HDI scores (the former with twice the impact). The proposed model was highly predictive (R² = 94.8%) and statistically signiicant (Pr> F = 0.000).
Our results match those of earlier cross-country studies associating WGIs with socio-economic development (Yang, 2010; Rajkumar and Swaroop, 2008). On the other hand, the results of the regression using HDI as dependent variable diverge from the indings of Sturm (2013) since no signiicant association was observed between ‘voice and accountability’ and HDI. According to the author, this scenario would prevent improvement in other WGIs, there-by having a negative impact on HDI scores.
‘Voice and accountability’ was the most signiicant variable in the GDP growth rate mod-el (p=0.005), but the sign was negative, indicating that the more the population participat-ed in setting the country’s political course, the smaller the country’s economic performance. Amavilah (2009) found a similarly negative association between these two parameters in a sample of Sub-Saharan countries.
‘Control of corruption’ was also highly signiicant (p=0.014) and the largest coeficient in the set, implying a considerable and positive impact on economic performance. This con-tradicts Campbell (2013) to whom corruption indicators, when used alone, lack the ability to predict the volatility of economic growth.
‘Political stability’ was signiicant at the level of 10%. The explanatory power of this model, though smaller than that of the previous model, may be considered acceptable (R² = 46,5%), and the validity was conirmed by the F test (p=0.000).
A comparison of the two panels shows that explanatory power was signiicantly great-er for HDI (R² = 94.8%; adjusted R² = 52.1%) than for GDP growth rate (R² = 46.5%; adjusted R² = 38.3%). This is likely because the latter indicator is restricted to the economic dimension while the former comprises aspects of health and education in addition to in-come. It may thus be concluded that governance impacts several areas of public interest in the Brics countries.
7. Conclusions
The evolution of the HDI was steady in the ive countries (despite a slight luctuation in Russia in 2009). Growth was most accentuated in China and India. Prior to the global inan-cial crisis in 2008, GDP growth was continuous in the Brics countries. This was followed, in 2009, by a decline in the GDP growth rate of Brazil, Russia and South Africa, but not in that of China and India. This, and the observed higher growth rates in relation to the rest of the group, is evidence of the economic strength of these two countries.
Overall, the WGIs remained constant in Russia and China, improved slightly in Brazil (except for 2011-12) and declined in India and South Africa. Despite obtaining the highest scores throughout the entire study period, South Africa experienced the greatest decline. India displayed a decline in all WGIs, except ‘voice and accountability’. The positive perfor-mance observed for Brazil was due to improvements in the perception of political stability, regulatory quality, rule of law and control of corruption.
The results of the panel data analysis allow to infer that ‘control of corruption’ in and of itself produced a signiicant and positive impact on HDI scores and GDP growth rates; in other words, in the Brics countries anti-corruption measures are likely to boost socioeconomic development indices. ‘Government effectiveness’ had a similar effect, but only on HDI. In ad-dition, GDP growth rates were inluenced by ‘political stability’ and ‘voice and accountability’, indicating that in the Brics countries lower levels of popular participation are likely to favor economic performance.
The present study makes a relevant contribution to the ield of public governance by identifying the WGIs most likely to support socioeconomic development in the Brics countries. Our indings may subsidize public policy making related to speciic problems evidenced by these indicators. Thus, based on the results of our panel data analysis, to raise HDI scores, Brics countries are advised to invest efforts in the improvement of the indicators ‘government effectiveness’ and ‘control of corruption’. Likewise, to raise GDP growth rates, sound anti-cor-ruption policies should be implemented. In short, the indicator ‘control of coranti-cor-ruption’ should be given more attention due to its ability to positively and signiicantly affect both indicators of socioeconomic development (HDI and GDP growth rate).
The relevance of the quality of national governance to human development underscores the pertinence of our results. Hopefully, our indings may draw the attention of authorities and public administrators to the importance of adopting good governance practices with re-gard to both policy making and public resource management.
Furthermore, the methodology used in the study allowed to observe country-specif-ic differences in the relation between governance quality and socioeconomcountry-specif-ic development, matching indings in the literature that suggest that governance should take national charac-teristics into account, although such characcharac-teristics were not the key object of our study.
coniguring a potential bias. Thus, future research should analyze results in light of coun-try-speciic cultural and political aspects. Finally, the Brics countries should be evaluated individually with regard to the impact of the WGIs on HDI and GDP, comparing them with other countries or groups.
References
ANDION, Carolina. Por uma nova interpretação das mudanças de paradigma na administração pública. Cad. EBAPE.BR, v. 10, n. 1, p. 1-19, 2012.
ALMEIDA, Miguel B. G. A ascensão do Brics: im do momento unipolar? Dissertação (mestrado em relações internacionais) — Faculdade de Ciências Sociais e Humanas, Universidade Nova de Lisboa, Lisboa, 2011.
AMAVILAH, Voxi H. Globalization, governance, and the economic performance of Sub-Saharan Africa. Resource and Engineering Economics Publications Services Working Paper, n. 20.093, 2009.
AZAHAF, Najim; SCHRAAD-TISCHLER, Daniel. Governance capacities in the Brics. Berlim: Bertels-mann Stiftung, 2013.
BANCO MUNDIAL. The worldwide governance indicators (WGI) project. Documentation. Available at: <http://info.worldbank.org/governance/wgi/index.aspx#doc>. Acessed on: 11 mar. 2014.
BANCO MUNDIAL. World development report 2004: making services work for poor people. Wash-ington, 2003.
BATABYAL, Amitrajeet A. The Brics and the world economy: which way now? Rochester Business Journal, 28 mar. 2014. Available at: <www.rbj.net/article.asp?aID=206965>. Acessed on: 15 apr. 2014.
BOVAIRD, Tony; LÖFFLER, Eelke. Evaluating the quality of public governance: indicators, models and methodologies. International Review of Administrative Sciences, v. 69, n. 3, p. 313-328, set. 2003.
CAMPBELL, Kaycea. A statistical analysis of public sector corruption and economic growth. LUX: A Journal of Transdisciplinary Writing and Research from Claremont Graduate University, v. 2, n. 1, p. 1-19, 2013.
DINIZ, Eli. Governabilidade, democracia e reforma do Estado: os desaios da construção de uma nova ordem no Brasil nos anos 90. Dados, v. 38, n. 3, p. 385-415, 1995.
EVANS, Peter. Autonomia nacional e desenvolvimento econômico: perspectivas críticas das empresas multinacionais em países pobres. Rev. Adm. Pública, v. 9, n. 2, p. 111-133, 1975.
EVANS, Peter. O Estado como problema e solução. Lua Nova, São Paulo, n. 28-29, p. 107-157, abr. 1993.
GRAY, Hazel. Governance for economic growth and poverty reduction: empirical evidence and new directions reviewed. Londres: Department for International Development; World Bank. 2007.
GREENE, William H. Econometric analysis. Nova Jersey: Prentice Hall, 2002.
HASSARD, John. Sociology and organizational theory: positivism, paradigms and postmodernism. London: Cambridge, 1993.
ÍNDIA. Ministério das Finanças. The Brics report. Nova Delhi: Oxford University Press, 2012.
JACQUES, Flávia V. S.; VICENTE, Ernesto F. R.; ENSSLIN, Sandra R. Indicadores de governança no setor público: bibliometria em artigos internacionais. In: CONGRESSO INTERNACIONAL DE CONTABILIDADE E AUDITORIA, XIV, 2013. Anais... Lisboa: Iscal, 2013.
JANNUZZI, Paulo M. Considerações sobre o uso, mau uso e abuso dos indicadores sociais na for-mulação e avaliação de políticas públicas municiais. Rev. Adm. Pública, v. 36, n. 1, p. 51-72, jan./ fev. 2002.
KAPOOR, Nidhi R. Making a world of difference: how Brics diaspora give. Londres: The Resource Alliance, 2014.
KAUFMANN, Daniel; KRAAY, Aart. Governance indicators: where are we, where should we be going? The World Bank Research Observer, v. 23, n. 1, p. 1-30, 2008.
KAUFMANN, Daniel; KRAAY, Aart; MASTRUZZI, Massimo. Governance matters V: aggregate and individual governance indicators for 1996-2005. In: WORLD BANK. Policy research working paper 4012, set. 2006.
KAUFMANN, Daniel; KRAAY, Aart; MASTRUZZI, Massimo. Governance matters VI: aggregate and individual governance indicators1996-2006. In: WORLD BANK. Policy research working paper 4280, jul. 2007.
KAUFMANN, Daniel; KRAAY, Aart; MASTRUZZI, Massimo. Governance matters VII: aggregate and individual governance indicators 1996-2007. In: WORLD BANK. Policy research working paper 4654, 2008.
KAUFMANN, Daniel; KRAAY, Aart; MASTRUZZI, Massimo. Governance matters VIII: aggregate and individual governance indicators 1996-2008. In: WORLD BANK. Policy research working paper 4978, jun. 2009.
KAUFMANN, Daniel; KRAAY, Aart; ZOIDO-LOBATÓN, Pablo. Governance matters. In: WORLD BANK. Policy research working paper 2196, 1999.
KISSLER, Leo; HEIDEMANN, Francisco G. Governança pública: novo modelo regulatório para as relações entre Estado, mercado e sociedade? Rev. Adm. Pública, v. 40, n. 3, p. 479-499, jun. 2006.
KLUGMAN, Jeni et al. The real wealth of nations: pathways to human development. Nova York: UNDP, 2010.
MELLO, Gilmar R. Governança corporativa no setor público federal brasileiro. Dissertação (mestrado em contabilidade) — Programa de Pós-Graduação em Ciências Contábeis, Faculdade de Economia, Administração e Contabilidade, Universidade de São Paulo, São Paulo, 2006.
NAÇÕES UNIDAS. United Nations Development Programme. Human development report. Nova York: Oxford, 1990.
NAÇÕES UNIDAS. United Nations Development Programme. Human development report. Nova York: Oxford, 2013.
O’NEIL, Jim. Building better global economic Brics. Global Economics Paper n. 66. Londres: Goldman Sachs, 2001.
OLIVEIRA, Antonio G.; PISA, Beatriz J. IGovP: índice de avaliação da governança pública instru-mento de planejainstru-mento do Estado e de controle social pelo cidadão. Rev. Adm. Pública, v. 49, n. 5, p. 1263-1290, set./out. 2015.
PINEDA, José. Measuring human progress: challenges and prospects. Nova York: United Nations Development Programme, 2011.
RAJKUMAR, Andrew S.; SWAROOP, Vinaya. Public spending and outcomes: does governance matter? Journal of Development Economics, v. 86, n. 1, p. 96-111, abr. 2008.
REIS, Paulo R. da C.; SILVEIRA, Suely de F. R.; RODRIGUES, Pedro E. L. Impactos da Política Na-cional de Irrigação sobre o desenvolvimento socioeconômico da região Norte de Minas Gerais: uma avaliação do Projeto Gorutuba. Rev. Adm. Pública, v. 46, n. 4, p. 1101-1130, ago. 2012.
SANT’ANA, Matthias. The evolution of the concept of development: from economic growth to human development. Inter-University Attraction Pole Working Paper, 2008.
SARAN, Samir; SINGH, Aashok K.; SHARAN, Vivan. A long-term vision for Brics. Nova Dehli: Ob-server Research Foundation, 2013.
SCARPIN, Jorge E.; SLOMSKI, Valmor. Estudo dos fatores condicionantes do índice de desen-volvimento humano nos municípios do estado do Paraná: instrumento de controladoria para a tomada de decisões na gestão governamental. Rev. Adm. Pública, v. 41, n. 5, p. 909-933, set./ out. 2007.
SEN, Amartya. Desenvolvimento como liberdade. São Paulo: Companhia das Letras, 2010.
STURM, Peter. Public sector governance and development performance: an international comparison with special focus on Vietnam. Vietnã: Depocen Working Papers Series, 2013.
VAN RYZIN, Gregg G. Outcomes, process, and trust of civil servants. Journal of Public Administration Research and Theory, v. 21, n. 4, p. 745-760, 2011.
YANG, Ko-Hsin. Human development and government effectiveness. Dissertação (master of public policy) — Georgetown Public Policy Institute, Faculty of the Graduate School of Arts and Sciences, Georgetown University, Georgetown, 2010.
Pedro de Barros Leal Pinheiro Marino has an M.Sc in administration and comptrollership from the Uni-versidade Federal do Ceará (UFC) and is on the technical-administrative staff of the UniUni-versidade de Brasília (UnB). E-mail: [email protected].
Rômulo Alves Soares has an M.Sc from the Postgraduate Program in Administration and comptrollership from the Universidade Federal do Ceará (UFC). E-mail: [email protected].
Márcia Martins Mendes De Luca has a PhD in comptrollership and accounting from the Universidade de São Paulo (USP) and works as a professor at the Universidade Federal do Ceará (UFC). E-mail: [email protected].