Reduced placental volume and flow in severe growth
restricted fetuses
Renata Montes Dourado Abule´, Lisandra Stein Bernardes*, Giovana Farina Doro, Seizo Miyadahira, Rossana Pulcinelli Vieira Francisco
Faculdade de Medicina da Universidade de Sa˜o Paulo, Departamento de Obstetrı´cia e Ginecologia, Disciplina de Obstetrı´cia, Sa˜o Paulo/SP, Brazil.
OBJECTIVES: To evaluate placental volume and vascular indices in pregnancies with severe fetal growth restriction and determine their correlations to normal reference ranges and Doppler velocimetry results of uterine and umbilical arteries.
METHODS:Twenty-seven fetuses with estimated weights below the 3rd percentile for gestational age were
evaluated. Placental volume and vascular indices, including vascularization, flow, and vascularization flow indices, were measured by three-dimensional ultrasound using a rotational technique and compared to a previously described nomogram. The observed-to-expected placental volume ratio for gestational age and observed-to-expected placental volume ratio for fetal weight were calculated. Placental parameters correlated with the Doppler velocimetry results of uterine and umbilical arteries.
RESULTS:The mean uterine artery pulsatility index was negatively correlated with the observed-to-expected placental volume ratio for gestational age, vascularization index and vascularization flow index. The observed-to-expected placental volume ratio for gestational age and observed-observed-to-expected placental volume ratio for fetal weight and vascularization index were significantly lower in the group with a bilateral protodiastolic notch. No placental parameter correlated with the umbilical artery pulsatility index.
CONCLUSIONS: Pregnancies complicated by severe fetal growth restriction are associated with reduced placental volume and vascularization. These findings are related to changes in uterine artery Doppler velocimetry. Future studies on managing severe fetal growth restriction should focus on combined results of placental three-dimensional ultrasound and Doppler studies of uterine arteries.
KEYWORDS: Placenta; Ultrasonography Doppler; Imaging Three-Dimensional; Placenta Circulation; Fetal Growth Retardation.
Abule´ RM, Bernardes LS, Doro GF, Miyadahira S, Francisco RP. Reduced placental volume and flow in severe growth restricted fetuses. Clinics. 2016;71(6):332-337
Received for publication onDecember 20, 2015;First review completed onJanuary 15, 2016;Accepted for publication onMarch 21, 2016 *Corresponding author. E-mail: [email protected]
’ INTRODUCTION
Fetal growth restriction (FGR) is a major complication of pregnancy and is associated with high rates of perinatal morbidity and mortality. The frequency of FGR-associated neonatal adverse outcomes is directly related to the severity of FGR, with most cases of poor prognosis associated with fetal weights below the 3rdpercentile (1-3). Abnormal placental development and decreased uteroplacental perfu-sion are associated with pregnancy complications and are considered possible causes for FGR (4).
Currently, it is possible to evaluate both placental volume and vascularization using three-dimensional ultrasound (3DUS) (5-8). Few studies have investigated the importance of this technique in the assessment of FGR. Three studies have evaluated the placental vascular indices of growth-restricted fetuses using the vascular placental biopsy technique described by Mercé (9,10), in which isolated spherical samples of the placenta are analyzed. These studies reported decreased placental vascular indices in growth-restricted fetuses (11-13). Similarly, two additional studies assessed the placentas of growth-restricted fetuses using the Virtual Organ Computed-Aided Analysis (VOCAL) rotational technique, which allows the measurement of vascular indices across the entire placental volume. The evaluation of entire placentas revealed that FGR is correlated with decreases in placental volume and vascular indices (14,15). All these previous studies focused on moderate FGR (below the 10thpercentile) in low-risk patients (11-15).
The most severe cases of FGR have fetal estimated weights below the 3rdpercentile (1-3). In these subjects, changes in
DOI:10.6061/clinics/2016(06)08
Copyright&2016CLINICS–This is an Open Access article distributed under the terms of the Creative Commons License (http://creativecommons.org/licenses/by/ 4.0/) which permits unrestricted use, distribution, and reproduction in any medium or format, provided the original work is properly cited.
placental volume and vasculature may be correlated with Doppler parameters recorded for the fetus and mother. However, there are currently no published studies that have investigated this correlation in severe growth-restricted fetuses. Because pregnancy follow-up may be challenging in more severe cases, studies specifically focusing on this group of fetuses may aid clinical decision-making processes in the future. Therefore, the present study aimed to evaluate placental volume and vascular indices in severe growth-restricted fetuses and to determine whether correlations exist between these findings and the results of maternal and fetal two-dimensional (2D) Doppler imaging.
’ MATERIALS AND METHODS
Patients and study design
This study was conducted at the Hospital das Clínicas da Faculdade de Medicina da Universidade de São Paulo, Disciplina de Obstetrícia (HCFMUSP). It was a descriptive study where correlations were analyzed between placental volume and blood flow among pregnancies with severe FGR.
The following inclusion criteria were applied: estimated fetal weight (as measured by ultrasound) below the 3rdpercentile of the Hadlock table (16), singleton pregnancy, normal fetal morphological ultrasound evaluation and reliable pregnancy dating established by the date of the last menstrual period and by sonography measurement of the crown-rump length during the first trimester. The following exclusion criteria were applied: inability to visualize the entire placenta, abnormal karyotype, diagnosis of fetal malformations and infection of the fetus.
All ultrasound evaluations were performed by the same observer (RMDA). Fetal weight, placental volume and vascular-ization, and Doppler velocimetric parameters were evaluated. Measurements were performed using a Voluson 730 Expertt
ultrasound machine (GE Healthcare, Milwaukee, WI, USA) equipped with a 1–5 MHz convex transducer and a 4–8 MHz transducer for 3D assessment of placental volume. The estimated fetal weight was calculated using the biparietal diameter, head and abdominal circumferences, and fetal femur length (17). Fetal weight percentile was calculated using the Hadlock formula (16).
Assessment of 2D Doppler velocimetric parameters
To ensure that suitable sonograms were obtained, we used color Doppler mapping to identify blood vessels and all recordings were performed in the absence of maternal or fetal movement. Sonograms were considered adequate when three consecutive waves of similar flow rates were obtained. To standardize our umbilical artery (UA) evaluation methodology, evaluations were made on the segment proximal to the placental insertion (18). After obtaining the sonogram, the pulsatility index (PI) was calculated (19). The uterine arteries (UtAs) were evaluated in the crossing of the external iliac vessels. After a sonogram was recorded, the PI was calculated for both UtAs and the mean PI was then calculated as a simple average of the values obtained for the right and left UtAs. UtAs were also classified according to the absence or presence of a bilateral diastolic notching (20).
Assessment of placental volume and vascular indices
3DUS placental evaluations were conducted using real-time scanning with a 4–8 MHz transducer. The measurement
parameters and specific techniques used were previously described (6,7). To standardize the acquisition procedures used to obtain 3D placental vascular indices, the settings for power Doppler were as follows: angio mode, cent; smooth, 4/5; FRQ, low; quality, 16; density, 6; enhance, 16; balance, GO150; filter, 2; actual power, 2 dB; and pulse repetition frequency, 0.9. Images were captured using the lowest gain possible, allowing us to obtain a proper image of the placental vascular tree while avoiding artifacts. The entire placental view was generated using 2D ultrasound. For posterior and laterally located placental segments, the transducer was held at a slight lateral inclination to acquire better images. Placental distance from the probe was also recorded. To minimize any interference from acoustic shadowing due to fetal positioning, the transducer was slightly inclined and a higher sweep angle 90o
was used to include the largest longitudinal axis of the placenta. Images affected by this movement (maternal, fetal, or transducer) were discarded and recaptured. After visualization of the placental vascular tree, 3D static power Doppler scanning was performed. After scanning the region of interest, placental volume was measured using the VOCAL rotational technique and VOCALt software (3D SonoView, GE Medical Systems, Milwaukee, WI, USA). This technique comprises repeatedly outlining the contour of the placenta after rotating the placental image six times in 30o
increments. After completing a full rotation, another analysis was performed using VOCALt
software (3D SonoView, GE Medical Systems, Milwaukee, WI, USA), which automatically calculates placental volume, vascu-larization index (VI), flow index (FI) and vascuvascu-larization flow index (VFI).
Statistical analysis
Placental volume and vascular indices (VI, FI and VFI) were classified according to De Paula et al. (6,7) as reduced (below the 10th percentile) and normal reference ranges.
Because placental volumes vary according to gestational age and fetal weight, the observed values were compared with the expected values (50thpercentile) for the appropriate gestational age and fetal weight. The observed-to-expected placental volume ratio at gestational age (OEPVR-GA) and observed-to-expected placental volume ratio to fetal weight (OEPVR-FW) were calculated. Placental parameters were then correlated with the mean PI for the UtAs and with the PIs for the UAs. The placental parameters were also eva-luated according to the presence of bilateral protodiastolic notching in the UtAs.
The potential correlation of placental 3DUS parameters to 2D Doppler findings was evaluated using Spearman’s correlation coefficient for nonparametric variables and the Pearson correlation coefficient for FI, which was the only parametric variable. Placental parameters were compared according to the presence or absence of bilateral UtA diastolic notches using the Mann–Whitney test for nonpara-metric variables and Student’s t-test for FI. A p-value of less than 0.05 was considered statistically significant. All statistical analyses were performed using SPSS Statistics for Windows, Version 17.0 (SPSS Inc, Chicago, USA).
’ ETHICS
Medicina da Universidade de São Paulo (protocol number 0766-10).
’ RESULTS
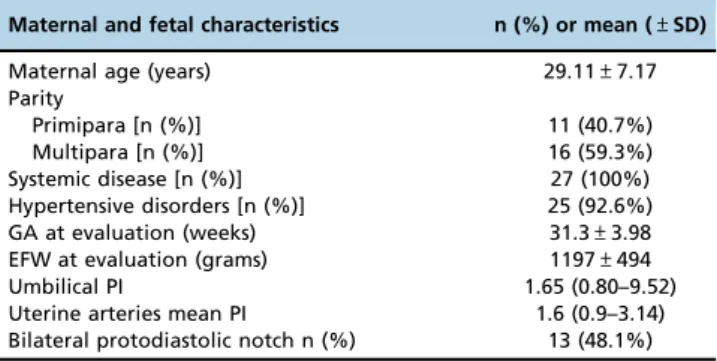
In total, 30 patients were evaluated. Three patients (10%) were excluded because it was not possible to obtain a 3DUS evaluation of the entire placenta. Maternal and fetal characteristics are presented in Table 1.
Placental volume and vascular index analyses
Fetal placental volume and vascular indices are presented in Table 2.
Correlation analyses evaluating placental parameters and gestational age are presented in Table 3. The only parameter that showed a significant correlation with gestational age was placental volume.
All placental parameters were classified as either normal or reduced. The results of these analyses are presented in Table 4. The frequency of reduced placental volume and vascularization in the severe FGR cases were higher than those observed in the general population.
Correlation of placental parameters to 2D Doppler findings
The results of correlation analyses between placental parameters and Doppler velocimetry results of uterine and
umbilical arteries are presented in Table 5. The mean UtA PI significantly correlated with OEPVR-GA, VI and VFI. No placental parameters correlated with UA PI.
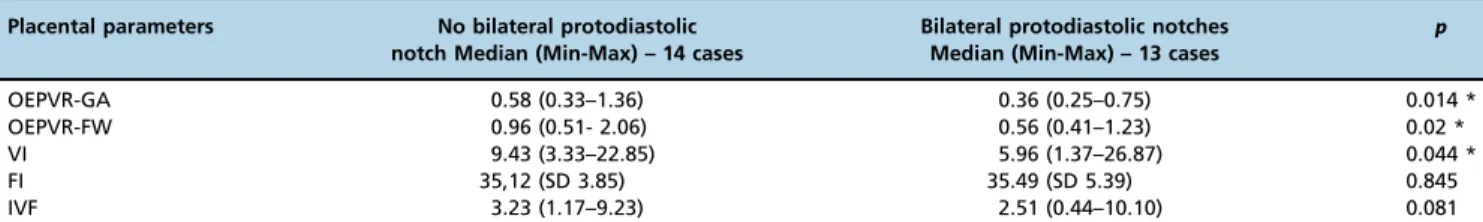
Placental parameters were evaluated according to the presence or absence of a bilateral UtA diastolic notch and the results are presented in Table 6. OEPVR-GA, OEPVR-FW and VI were significantly lower in the group with a bilateral UtA diastolic notch. The mean gestational age of the patients with a bilateral UtA diastolic notch was 30.04 (±4.1) weeks,
while the mean gestational age of the pregnant women with no bilateral UtA diastolic notch was 32.2 (±3.7) weeks
(p=0.156).
’ DISCUSSION
This study observed, for the first time, an inverse correlation between placental VI and volume and uterine resistance in severe growth-restricted fetuses. Similarly to previous reports (13-15), all placental vascular indices, including volume, were reduced when compared to normal-growth fetuses.
Relationship between placental parameters and 2D Doppler of UtAs
Placental volume was inversely correlated with UtA resistance, demonstrating that smaller placentas correlate to greater reductions in blood flow. Although no reported studies have investigated this correlation in FGR fetuses, decreased placental volume in the first trimester has been related to abnormal UtA Doppler findings in the prediction of preeclampsia and FGR (21,22). All the above findings corroborate the hypothesis that placental volume is related to the degree of impaired development of the placental Table 1-Maternal and fetal characteristics of the study group
(27 patients).
Maternal and fetal characteristics n (%) or mean (±SD)
Maternal age (years) 29.11±7.17
Parity
Primipara [n (%)] 11 (40.7%)
Multipara [n (%)] 16 (59.3%)
Systemic disease [n (%)] 27 (100%)
Hypertensive disorders [n (%)] 25 (92.6%)
GA at evaluation (weeks) 31.3±3.98
EFW at evaluation (grams) 1197±494
Umbilical PI 1.65 (0.80–9.52)
Uterine arteries mean PI 1.6 (0.9–3.14)
Bilateral protodiastolic notch n (%) 13 (48.1%) * Data are reported as the mean (±standard deviation) and median (range) for continuous variables and as the observed number (percentage) for categorical variables.
GA: gestational age; EFW: estimated fetal weight; PI: pulsatility index.
Table 2-Placental volume and vascular indices.
Placental parameters Median (min–max)
Volume (cm3) 146.44 (58.07–529.69)
OEPVR-GA 0.47 (0.25–1.36)
OEPVR-FW 0.72 (0.41–2.06)
VI (%) 8.42 (1.37–26.87)
FI 35.50 (±0.88)a
VFI (%) 2.77 (0.45–10.10)
OEPVR-GA: observed-to-expected placental volume ratio for gestational age; OEPVR-FW: observed-to-expected placental volume ratio for fetal weight; VI: vascularization index; FI: flow index; VFI: vascularization and flow index.
a: Mean (±standard deviation).
Table 3-Correlation analysis of placental parameters and gestational age.
Placental parameters r p
Volume 0.568 0.002
OEPVR-GA 0.288 0.145
OEPVR-FW 0.150 0.455
VI 0.121 0.548
FI 0.235 0.238
VFI 0.185 0.357
OEPVR-GA: observed-to-expected placental volume ratio for gestational age; OEPVR-FW: observed-to-expected placental volume ratio for fetal weight; VI: vascularization index; FI: flow index; VFI: vascularization and flow index.
Table 4-Frequencies of normal and decreased placental parameters classified according to De Paula normal reference ranges (6,7).
Placental parameters Normal n (%) Reduced n (%)
Volume for gestational age 12 (44.4%) 15 (55.6%)
Volume for fetal weight 17 (63%) 10 (37%)
VI 15 (55.6%) 12 (44.4%)
FI 13 (48.1%) 14 (51.9%)
VFI 8 (29.6%) 19 (70.4%)
VI: vascularization index; FI: flow index; VFI: vascularization index and flow.
vascular tree, which may be the primary underlying cause of FGR (23,24).
Regarding the vascular indices measured, there was an inverse correlation between UtA PI and placental VI and VFI. Furthermore, the presence of bilateral notching was corre-lated with a lower placental volume for both gestational age (OEPVR-GA) and estimated fetal weight (OEPVR-FW) as well as lower VIs. This correlation has not been previously reported for FGR fetuses. However, previous studies conducted on normal pregnancies have identified a correla-tion between first trimester placental VI and UtA Doppler status in the second trimester of pregnancy (25,26). In addition, there is some evidence that in fetuses exhibiting FGR, artery uterine Doppler results are associated with histological evidence of placental underperfusion (27). These findings suggest that VI represents a relationship between abnormal UtA Doppler findings and placental histologic lesions related to poor maternal vascular development and decreased placental perfusion. This relationship suggests that placental VI is related to maternal perfusion of the placenta and directly reflects the deficient trophoblastic invasion present in most cases of FGR. Future studies should focus on the investigation of placental histology and blood flow in relation to 3D power Doppler findings.
Relationship between placental parameters and 2D Doppler results of UAs in pregnancies with FGR
The present study found no correlation between 3DUS placental parameters and UA Doppler findings. However, other authors who have investigated this potential relationship have reported different results. For example, Luria et al. (13) evaluated 20 FGR fetuses and detected a correlation between VI, FI, and VFI and umbilical PI (r=0.63,
r=0.32 and r=0.66, respectively). Further, Guiot et al. (11) evaluated 15 FGR fetuses and observed that only FI was reduced in cases where UA had no end-diastolic flow; in Guiot́s study, the relationship between FI and PI was not evaluated. Because these studies (11,13) were performed using a vascular placental biopsy technique, it is possible that the observed correlations were due to local placental vascularization, as both studies reported high variability among the samples tested.
Another possible explanation for the lack of agreement with our results is that we included severe growth-restricted fetuses in our investigations. These fetuses were associated with compromised placentas, even when umbilical Doppler findings were normal. Parra-Saavedra et al. (27,28) evaluated placental histology in FGR pregnancies with normal UA Doppler findings and found low placental weight and histological changes secondary to maternal hypoperfusion. These findings suggest that decreased placental volume and the presence of placental vascular lesions are associated with FGR pathophysiological processes even when they are not associated with abnormal UA Doppler results.
Placental volume in growth-restricted fetuses compared to that in the normal population
In our population of severe growth-restricted fetuses, placental volume was significantly decreased when compared to the general population. This finding is in agreement with findings reported by Pomorski (14), who observed reduced placental volumes in pregnancies with FGR between 22 and 42 weeks of gestation. Additionally, Ulkumen (15) reported decreased placental volumes with FGR between 24 and 40 weeks. It is important to note that the observed-to-expected ratio of placental volume to fetal weight was also decreased, demonstrating that a reduction in placental volume is more important than a reduction in fetal weight.
Placental vascular indices in growth-restricted fetuses compared to those in a normal population
In severe growth-restricted fetuses, all placental vascular indices (VI, FI and VFI) were significantly reduced when compared to the nomogram described by De Paula et al. (7). These findings align with those from previously reported studies that were performed on less severe growth-restricted fetuses (11-14). An important feature of our study was the use of entire placental 3D evaluations instead of the placental vascular biopsy technique. The placental vascular biopsy technique may not represent the entire placental vascularization because there is well-established variation among samples from different placental regions (11,13,28-30). Table 5-Correlation between uterine and umbilical artery
pulsatility index and placental parameters.
Placental parameters Uterine artery mean PI Umbilical artery PI
r p r p
OEPVR-GA 0.461 0.018* 0.703 0.722
OEPVR-FW 0.387 0.051 0.054 0.793
VI 0.401 0.042* 0.189 0.355
FI 0.142 0.490 0.088 0.671
VFI 0.421 0.048* 0.212 0.297
PI: pulsatility index; OEPVR-GA: observed-to-expected placental volume ratio for gestational age; OEPVR-FW: observed-to-expected placental volume ratio for fetal weight; VI: vascularization index; FI: flow index; VFI: vascularization and flow index.
* Statistically significant difference.
Table 6-Comparison of placental parameters according to the presence of bilateral uterine artery diastolic notching.
Placental parameters No bilateral protodiastolic notch Median (Min-Max) – 14 cases
Bilateral protodiastolic notches Median (Min-Max) – 13 cases
p
OEPVR-GA 0.58 (0.33–1.36) 0.36 (0.25–0.75) 0.014 *
OEPVR-FW 0.96 (0.51- 2.06) 0.56 (0.41–1.23) 0.02 *
VI 9.43 (3.33–22.85) 5.96 (1.37–26.87) 0.044 *
FI 35,12 (SD 3.85) 35.49 (SD 5.39) 0.845
IVF 3.23 (1.17–9.23) 2.51 (0.44–10.10) 0.081
OEPVR-GA: observed-to-expected placental volume ratio for gestational age; OEPVR-FW: observed-to-expected placental volume ratio for fetal weight; VI: vascularization index; FI: flow index; VFI: vascularization and flow index.
Thus, evaluation of the entire placenta may better represent its total vascularization.
Limitations
There are known limitations associated with the 3D power Doppler technique. For example, all vascular parameters are significantly influenced by power Doppler device settings (gain, pulse repetition frequency and depth) (31-34). For this reason, all sonographic parameters were pre-established and were not altered between evaluations. In all our evaluations, we maintained the same distance limit, with just one evaluation detecting a placenta deeper than 55 mm. In our study, there was no correlation between depth and assessed placental parameters. This finding is in agreement with findings previously described by other authors (7,11,12,35).
Another important point pertains to whether placental vascular indices assessed by 3DUS correspond to actual placental vascularization. Some experimental models have provided evidence that placental vascular indices evaluated by US3D correlate with blood vessels and placenta blood flow (36). Furthermore, there is a correlation between decreased 3DUS placental vascular indices and vascular injury (37). However, even if our findings and other studies show that placental vascular indices are significantly lower in growth-restricted fetuses compared to normal fetuses (4,38-40), studies correlating vascular parameters identified by 3DUS to histopathological findings are still required.
In our study, we did not evaluate intra- and inter-observer variabilities. However, previous studies using the same technique and machine settings have demonstrated good repeatability when measuring placental volumes and vascularization by 3DUS (6,7,14,35).
Our study was also limited by the small number of patients evaluated. Because severe FGR is an uncommon complication of different maternal diseases, it would be necessary to perform this study in multiple centers over an extended period to achieve higher enrollment numbers. This limitation represents the clinical challenges of everyday medical practice. Previous studies on this subject describe an even smaller number of cases (11-14).
Our population is heterogeneous in relation to UA Doppler patterns. However, this variability is desirable because it reflects different types and degrees of placental damage.
Additional studies involving a larger numbers of cases could corroborate the hypothesis that 3D placental vascular indices correlate with poor placental implantation and may be related to neonatal outcome.
The present study evaluated, for the first time, the relationship between placental vascular indices and maternal and fetal Doppler findings in severe FGR pregnancies. The results indicated that VI and placental volume are decreased when UtA flow is impaired. This finding may represent a small step toward the elucidation of FGR physiology. Further studies evaluating placental histology and multi-centric studies enrolling more patients are required to further investigate this phenomenon.
’ AUTHOR CONTRIBUTIONS
Abulé RM performed data analysis and wrote the manuscript. Bernardes LS performed data analysis, wrote and reviewed the manuscript, and was responsible for managing the project. Doro GF performed data analysis and wrote the manuscript. Miyadahira S and Pulcinelli RVF reviewed the manuscript
’ REFERENCES
1. Garite TJ, Clark R, Thorp JA. Intrauterine growth restriction increases morbidity and mortality among premature neonates. Am J Obstet Gynecol. 2004;191(2):481-7, http://dx.doi.org/10.1016/j.ajog.2004.01.036. 2. Savchev S, Figueras F, Cruz-Martinez R, Illa M, Botet F, Gratacos E.
Estimated weight centile as a predictor of perinatal outcome in small-for-gestational-age pregnancies with normal fetal and maternal Doppler indices. Ultrasound Obstet Gynecol. 2012;39(3):299-303, http://dx.doi. org/10.1002/uog.10150.
3. McIntire DD, Bloom SL, Casey BM, Leveno KJ. Birth weight in relation to morbidity and mortality among newborn infants. N Engl J Med. 1999; 340(16):1234-8, http://dx.doi.org/10.1056/NEJM199904223401603. 4. Mayhew TM, Manwani R, Ohadike C, Wijesekara J, Baker PN. The
placenta in pre-eclampsia and intrauterine growth restriction: studies on exchange surface areas, diffusion distances and villous membrane
diffu-sive conductances. Placenta. 2007;28(2-3):233-8, http://dx.doi.org/
10.1016/j.placenta.2006.02.011.
5. Merce LT, Barco MJ, Bau S. Reproducibility of the study of placental vascularization by three-dimensional power Doppler. J Perinat Med. 2004;32(3):228-33, http://dx.doi.org/10.1515/JPM.2004.043.
6. de Paula CFS, Ruano R, Campos J, Zugaib M. Placental Volumes
Measured by 3-Dimensional Ultrasonography in Normal
Preg-nancies From 12 to 40 Weeks’ Gestation. J Perinat Med. 2008;27(11):
1583-90.
7. de Paula CFS, Ruano R, Campos J, Zugaib M. Quantitative Analysisof Placental Vasculature by Three-Dimensional Power Doppler Ultrasonography in Normal Pregnancies From 12 to 40 Weeks of Gestation. Placenta. 2009; 30(2):142-8, http://dx.doi.org/10.1016/j.placenta.2008.11.010.
8. Hata T, Tanaka H, Noguchi J, Hata K. Three-dimensional ultrasound evaluation of the placenta. Placenta. 2011;32(2):105-15, http://dx.doi.org/ 10.1016/j.placenta.2010.11.001.
9. Merce LT, Barco MJ, Bau S, Kupesic S, Kurjak A. Assessment of placental vascularization by three-dimensional power Doppler "vascular biopsy" in normal pregnancies. Croat Med J. 2005;46(5):765-71.
10. Mercé LT, Barco MJ, Bau S. Reproducibility of the study of placental vascularization by three-dimensional power Doppler. J Perinat Med. 2004;32(3):228-33, http://dx.doi.org/10.1515/JPM.2004.043.
11. Guiot C, Gaglioti P, Oberto M, Piccoli E, Rosato R, Todros T. Is three-dimensional power Doppler ultrasound useful in the assessment of placental perfusion in normal and growth-restricted pregnancies? Ultra-sound Obstet Gynecol. 2008;31(2):171-6, http://dx.doi.org/10.1002/ uog.5212.
12. Noguchi J, Hata K, Tanaka H, Hata T. Placental Vascular Sonobiopsy Using Three-dimensional Power Doppler Ultrasound in Normal and Growth Restricted Fetuses. Placenta. 2009;30(5):391-7, http://dx.doi.org/ 10.1016/j.placenta.2009.02.010.
13. Luria O, Barnea O, Shalev J, Barkat J, Kovo M, Golan A, et al. Two-dimensional and three-Two-dimensional Doppler assessment of fetal growth restriction with different severity and onset. Prenat Diagn. 2012;32 (12):1174-80, http://dx.doi.org/10.1002/pd.3980.
14. Pomorski M, Zimmer M, Florjanski J, Michniewicz J, Wiatrowski A, Fuchs T, et al. Comparative analysis of placental vasculature and placental volume in normal and IUGR pregnancies with the use of three-dimen-sional Power Doppler. Arch Gynecol Obstet. 2012;285(2):331-7, http://dx. doi.org/10.1007/s00404-011-1968-9.
15. Artunc Ulkumen B, Pala HG, Uyar Y, Koyuncu FM, Bulbul Baytur Y. The alteration in placental volume and placental mean grey value in growth-restricted pregnancies assessed by 3D ultrasound (Growth Restriction & 3D Ultrasonography). J Obstet Gynaecol. 2014:1-4, http://dx.doi.org/ 10.3109/01443615.2014.968115.
16. Hadlock FP. Sonographic estimation of fetal age and weight. Radiol Clin North Am. 1990;28(1):39-50.
17. Hadlock FP, Harrist RB, Sharman RS, Deter RL, Park SK. Estimation of fetal weight with the use of head, body, and femur measurements--a prospective study. Am J Obstet Gynecol. 1985;151(3):333-7, http://dx.doi. org/10.1016/0002-9378(85)90298-4.
18. Abramowicz JS, Warsof SL, Arrington J, Levy DL. Doppler analysis of the umbilical artery. The importance of choosing the placental end of the cord. J Ultrasound Med. 1989;8(4):219-21
19. Arduini D, Rizzo G. Normal values of Pulsatility Index from fetal vessels: a cross-sectional study on 1556 healthy fetuses. J Perinat Med. 1990; 18(3):165-72, http://dx.doi.org/10.1515/jpme.1990.18.3.165.
20. Papageorghiou AT, Yu CK, Nicolaides KH. The role of uterine artery Doppler in predicting adverse pregnancy outcome. Best Pract Res Clin Obstet Gynaecol. 2004;18(3):383-96, http://dx.doi.org/10.1016/ j.bpobgyn.2004.02.003.
22. Rizzo G, Capponi A, Pietrolucci ME, Capece A, Arduini D. First-Trimester Placental Volume and Vascularization Measured by 3-Dimensional Power Doppler Sonography in Pregnancies With Low Serum Preg-nancyAssociated Plasma Protein A Levels. J Ultrasound Med. 2009; 28(12):1615-22.
23. Cox P, Marton T. Pathological assessment of intrauterine growth restric-tion. Best Pract Res Clin Obstet Gynaecol. 2009;23(6):751-64, http://dx. doi.org/10.1016/j.bpobgyn.2009.06.006.
24. Kingdom J, Huppertz B, Seaward G, Kaufmann P. Development of the placental villous tree and its consequences for fetal growth. Eur J Obstet Gynecol Reprod Biol. 2000;92(1):35-43, http://dx.doi.org/10.1016/S0301-2115(00)00423-1.
25. Hafner E, Metzenbauer M, Stümpflen I, Waldhör T, Philipp K. First tri-mester placental and myometrial blood perfusion measured by 3D power Doppler in normal and unfavourable outcome pregnancies. Placenta. 2010;31(9):756-63, http://dx.doi.org/10.1016/j.placenta.2010.06.011. 26. Hafner E, Metzenbauer M, Stümpflen I, Waldhör T. Measurement of
placental bed vascularization in the first trimester, using 3D-power-Doppler, for the detection of pregnancies at-risk for fetal and maternal complications. Placenta. 2013;34(10):892-8, http://dx.doi.org/10.1016/ j.placenta.2013.06.303.
27. Parra-Saavedra M, Crovetto F, Triunfo S, Savchev S, Peguero A, Nadal A, et al. Association of Doppler parameters with placental signs of under-perfusion in late-onset small-for-gestational-age pregnancies. Ultrasound Obstet Gynecol. 2014;44(3):330-7, http://dx.doi.org/10.1002/uog.13358. 28. Lai PK, Wang YA, Welsh AW. Reproducibility of regional placental
vascu-larity/perfusion measurement using 3D power Doppler. Ultrasound Obstet Gynecol. 2010;36(2):202-9, http://dx.doi.org/10.1002/uog.7608.
29. Negrini R, de Silva Bussamra LC, da Silva Valladão de Freitas L, Araujo Júnior E, Piato S, Nardozza LM, et al. Assessment of placental blood flow between 22 and 34 weeks of gestation by 3D-sonography power Doppler vascular indices. Arch Gynecol Obstet. 2011;284(1):53-7, http://dx.doi. org/10.1007/s00404-010-1595-x.
30. Martins WP, Lima JC, Welsh AW, Araujo Júnior E, Araujo E, Miyague AH, et al. Three-dimensional Doppler evaluation of single spherical samples from the placenta: intra- and interobserver reliability. Ultrasound Obstet Gynecol. 2012;40(2):200-6, http://dx.doi.org/10.1002/uog.11076. 31. Pairleitner H, Steiner H, Hasenoehrl G, Staudach A. Three-dimensional
power Doppler sonography: imaging and quantifying blood flow
and vascularization. Ultrasound Obstet Gynecol. 1999;14(2):139-43, http://dx.doi.org/10.1046/j.1469-0705.1999.14020139.x.
32. Raine-Fenning NJ, Welsh AW, Jones NW, Bugg G. Methodological con-siderations for the correct application of quantitative three-dimensional power Doppler angiography. Ultrasound Obstet Gynecol. 2008;32(1): 115-7, http://dx.doi.org/10.1002/uog.5394.
33. Schulten-Wijman M, Struijk PC, Brezinka C, De Jong N, Steegers EAP. Evaluation of volume vascularization index and flow index: a phantom study. Ultrasound Obstet Gynecol. 2008;32(4):560-4, http://dx.doi.org/ 10.1002/uog.6112.
34. Martins WP, Raine-Fenning NJ, Ferriani RA, Nastri CO. Quantitative three-dimensional power Doppler angiography: a flow-free phantom experiment to evaluate the relationship between color gain, depth and signal artifact. Ultrasound Obstet Gynecol. 2010;35(3):361-8, http://dx. doi.org/10.1002/uog.7562.
35. Pomorski M, Zimmer M, Fuchs T, Florjanski J, Pomorska M, Tomialowicz M, et al. Quantitative assessment of placental vasculature and placental volume in normal pregnancies with the use of 3D Power Doppler. Adv Med Sci. 2014;59(1):23-7, http://dx.doi.org/10.1016/j.advms.2013.06.002.
36. Morel O, Pachy F, Chavatte-Palmer P, Bonneau M, Gayat E, Laigre P, et al. Correlation between uteroplacental three-dimensional power Doppler indices and true uterine blood flow: evaluation in a pregnant sheep model. Ultrasound Obstet Gynecol. 2010;36(5):635-40, http://dx.doi.org/ 10.1002/uog.7741.
37. Lecarpentier E, Morel O, Tarrade A, Dahirel M, Bonneau M, Gayat E, et al. Quantification of utero-placental vascularization in a rabbit model of IUGR with three-dimensional power Doppler angiography. Placenta. 2012;33(10):769-75, http://dx.doi.org/10.1016/j.placenta.2012.06.013.
38. Mitra SC, Seshan SV, Riachi LE. Placental vessel morphometry in growth retardation and increased resistance of the umbilical artery Doppler flow. J Matern Fetal Med. 2000;9(5):282-6,
http://dx.doi.org/10.1002/1520-6661(200009/10)9:5o282::AID-MFM543.3.CO;2-A.
39. Chen CP, Bajoria R, Aplin JD. Decreased vascularization and cell proliferation in placentas of intrauterine growth-restricted fetuses with abnormal umbilical artery flow velocity waveforms. Am J Obstet Gynecol. 2002;187(3):764-9, http://dx.doi.org/10.1067/mob.2002.125243. 40. Junaid TO, Brownbill P, Chalmers N, Johnstone ED, Aplin JD. Fetoplacental