Article
Iodine Status and Iodised Salt Consumption in
Portuguese School-Aged Children:
The Iogeneration Study
João Costa Leite1,2,*,†, Elisa Keating1,2,*,†, Diogo Pestana1,2,3,*,†,
Virgínia Cruz Fernandes1,2,4,*,†, Maria Luz Maia1,2, Sónia Norberto1,2, Edgar Pinto5,
AndréMoreira-Rosário1,2,6, Diana Sintra1, Bárbara Moreira1, Ana Costa1, Sofia Silva1,
Vera Costa1, Inês Martins1, Francisca Castro Mendes1, Pedro Queirós1, Bruno Peixoto1,7,
JoséCarlos Caldas1,7, António Guerra1,8, Manuel Fontoura1,9, Sandra Leal1,7,10,
Roxana Moreira7, Irene Palmares Carvalho1,11, Rui Matias Lima12, Catia Martins13,
Cristina Delerue-Matos4, Agostinho Almeida5, Luís Azevedo1,6and Conceição Calhau1,2,3 1 Center for Health Technology and Services Research (CINTESIS), 4200-450 Porto, Portugal;
mariadaluz.maia@gmail.com (M.L.M.); sonia.norberto.nutri@gmail.com (S.N.); andrerosario79@gmail.com (A.M.-R.); diana-sintra@hotmail.com (D.S.); barbaramoreirapsicologa@gmail.com (B.M.); ana.fontescosta@gmail.com (A.C.);
sofiasilva78@hotmail.com (S.S.); verarcosta@gmail.com (V.C.); minesfmartins@gmail.com (I.M.); francisca_castromendes@hotmail.com (F.C.M.); pdqueiros@gmail.com (P.Q.);
bruno.peixoto@iucs.cespu.pt (B.P.); carlos.caldas@iucs.cespu.pt (J.C.C.);
ajmonicaguerra@hotmail.com (A.G.); manfontoura@gmail.com (M.F.); leal.sc@gmail.com (S.L.); irenec@med.up.pt (I.P.C.); lfazevedo55@gmail.com (L.A.); ccalhau@nms.unl.pt (C.C.)
2 Department of Biomedicine–Biochemistry Unit, Faculty of Medicine of the University of Porto,
4200-450 Porto, Portugal
3 Nutrition & Metabolism, NOVA Medical School|Faculdade de Ciências Médicas, Universidade Nova de Lisboa, 1169-056 Lisbon, Portugal
4 LAQV/REQUIMTE–Instituto Superior de Engenharia, Instituto Politécnico do Porto, 4249-015 Porto, Portugal; cmm@isep.ipp.pt
5 LAQV/REQUIMTE-Department of Chemical Sciences, Faculty of Pharmacy, University of Porto,
4249-015 Porto, Portugal; edgarpinto7@gmail.com (E.P.); almeida@ff.up.pt (A.A.)
6 Department of Community Medicine, Information and Health Decision Sciences (MEDCIDS),
Faculty of Medicine, University of Porto, 4200-450 Porto, Portugal
7 CESPU, Institute of Research and Advanced Training in Health Sciences and Technologies,
4585-116 Gandra, Portugal; roxana.moreira@iucs.cespu.pt
8 Division of Paediatric Nutrition, Department of Paediatrics, Integrated Paediatric Hospital,
Centro Hospitalar São João, Porto. Faculty of Medicine, University of Porto, 4200-450 Porto, Portugal
9 Division of Paediatric Endocrinology, Department of Paediatrics, Integrated Paediatric Hospital,
Centro Hospitalar São João, Porto. Faculty of Medicine, University of Porto, 4200-450 Porto, Portugal
10 Department of Biomedicine-Anatomy Unit, Faculty of Medicine, University of Porto,
4200-450 Porto, Portugal
11 Department of Clinical Neurosciences and Mental Health, Faculty of Medicine, University of Porto,
4200-450 Porto, Portugal
12 Directorate-General of Education, 1049-005 Lisbon, Portugal; matias.lima@gmail.com
13 Obesity Research Group, Department of Cancer Research and Molecular Medicine, Faculty of Medicine,
Norwegian University of Science and Technology (NTNU), NO-7491 Trondheim, Norway; catia.martins@ntnu.no
* Correspondence: jncostaleite@gmail.com (J.C.L.); keating@med.up.pt (E.K.); diogopestana@gmail.com (D.P.); vircru@gmail.com (V.C.F.); Tel./Fax: +351-225-513 622 (J.C.L. & E.K. & D.P. & V.C.F.)
† These authors contributed equally to this study.
Received: 10 March 2017; Accepted: 28 April 2017; Published: 5 May 2017
Abstract: The World Health Organization promotes salt iodisation to control iodine deficiency.
In Portugal, the use of iodised salt in school canteens has been mandatory since 2013. The present
study aimed to evaluate iodine status in school-aged children (6–12 years) and to monitor the use of iodised salt in school canteens. A total of 2018 participants were randomly selected to participate in a cross-sectional survey in northern Portugal. Children’s urine and salt samples from households and school canteens were collected. A lifestyle questionnaire was completed by parents to assess children’s eating frequency of iodine food sources. Urinary iodine concentration (UIC) was measured by inductively coupled plasma-mass spectrometry. The median UIC was 129µg/L which indicates
the adequacy of iodine status and 32% of the children had UIC < 100 µg/L. No school canteen
implemented the iodised salt policy and only 2% of the households were using iodised salt. Lower consumption of milk, but not fish, was associated with a higher risk of iodine deficiency. Estimation of sodium intake from spot urine samples could be an opportunity for adequate monitoring of population means. Implementation of iodine deficiency control policies should include a monitoring program aligned with the commitment of reducing the population salt intake.
Keywords: iodine status; children; urinary iodine; salt iodisation; salt intake; monitoring;
public health
1. Introduction
Iodine is a key micronutrient for the synthesis of thyroid hormones, which are essential for healthy growth, particularly for normal neurological development [1]. Chronic inadequate iodine consumption at an early age may have long term implications in a number of cognitive outcomes including reduced intelligence quotient [2–4].
Globally, the elimination of iodine deficiency among vulnerable populations including school-aged children and pregnant women is regarded as a major public health challenge. Accordingly, the World Health Organization (WHO) promotes salt iodisation at a global level as a cost-effective and safe strategy to control iodine deficiency.
Across Europe, strategies to control and monitor iodine deficiency are limited to a number of countries. Concerns related to the potential adverse consequences of iodine fortification, such as mandatory salt iodisation programs, may delay the implementation of those strategies. Nevertheless, the risks of iodine excess are generally considered to be low and are far outweighed by the substantial risks of iodine deficiency [5].
The implementation of iodine fortification policies is more efficient when integrated with monitoring programs. The importance of these programs is well evidenced by the reappearance of iodine deficiency in the UK, a country that was known as iodine sufficient in the 1990s that had no iodine control or monitoring programs [6].
In Portugal, a national representative study conducted among pregnant women in 2010 indicated an iodine status well below the WHO adequacy interval recommended for this population (150–249µg/L), reporting median urinary iodine concentration (UIC) values ranging from 50µg/L in
the region of Azores to 84.9µg/L in continental Portugal [7]. Another survey reported in 2012 that
Portuguese school-aged children had a median UIC of 106µg/L [8], which is within the adequacy
interval of 100–199µg/L recommended by the WHO for this population group. Nevertheless, it was
highlighted that 47% of this young population had a median UIC below 100µg/L.
2. Methods
2.1. Participants and Study Design
A cross-sectional survey was conducted in three regions of northern Portugal (Tâmega, Grande
Porto, and Entre Douro e Vouga) to evaluate iodine status in a school-aged population (6–12 years). Tâmega is an inland region known for having in the past a great incidence of thyroid disease,
socioeconomic disadvantages, inequalities, and urban-to-rural contrasts. Grande Porto is the most socio-economically developed region in the North of Portugal and it is a coastal region known to have urban-to-suburban-to-rural contrasts. The region of Entre Douro e Vouga is a smaller coastal region with some areas of socioeconomic disadvantage. Geographical differences between these regions provided an opportunity to investigate the influence of living close to the sea on iodine status. A multi-stage sampling method, with clusters at three levels (county, school clusters, and school classes), was implemented to select classes from elementary and middle schools (1st to 6th grade) to provide a representative sample of the population. The 83 schools and 32 school clusters were selected according to the number of children and with stratification for the number of clusters by county and for the type of schools (elementary versus middle). A formal sample size determination was undertaken to ensure the estimation of proportions with an expected margin of error of 3%, assuming a design effect between 1.5 and 2.0 (accounting for the multi-stage complex sampling method), and an intended confidence level of 95%. Based on these assumptions, a sample size higher than 2000 children was needed.
2.2. Data Collection
The study was approved by the Ethical Committee of S. João Hospital Center/Faculty of Medicine
of the University of Porto. Data collection was approved by the National Committee for Data Protection and by the Directorate-General of Education. Recruitment and data collection was conducted between December 2015 and May 2016.
To improve the participation rate, selected school clusters were first invited by the Directorate-General of Education to take part in the survey. In addition, a first visit to the school clusters, involving teachers and school board directors, was promoted by the study researchers to schedule the field work activities, to ensure teachers’ collaboration in recruiting children, and to provide codified sealed kits to teachers of the selected classes. These kits included a consent form, lifestyle and behaviour questionnaires, and urine and salt collection containers. Upon informed consent, participants were asked to provide a first morning urine sample collected at home on the field work day, along with a sample of household salt. These samples, together with the questionnaires completed by parents, were returned to the researchers on the same day. A salt sample used for school meal preparation was also collected in the school canteens. The lifestyle questionnaire was specifically designed for this study and applied in a pilot study to check for inconsistencies, and assess the applicability and data entry protocols. Validation was not conducted as questions were treated independently and aimed to categorize groups. The questionnaire included questions regarding eating frequency (i.e., never, less than once a month, less than once a week, 2–3 times a week, once a day, or more than twice a day) of iodine natural sources (seafood) and iodine fortified food sources (premade baby cereal). Information on iodised salt consumption and awareness, socio-economic and educational background, and living conditions were also collected. Data regarding the consumption of milk products and eggs by children were collected from an additional online questionnaire completed by a sub-sample of parents (n= 615) as these questions were not included in the lifestyle questionnaire.
2.3. Biochemical Analysis
2.3.1. Iodine Determination in Urine Samples
Urinary iodine excretion was measured by inductively coupled plasma-mass spectrometry (ICP-MS), according to the method developed by the Centers for Disease Control and Prevention (CDC) [11].
ICP-MS analyses were performed using an iCAP™ Q instrument (Thermo Fisher Scientific, Bremen, Germany), equipped with a MicroMist™ nebulizer, a baffled cyclonic spray chamber (Peltier-cooled), a standard quartz torch, and a two-cone design (nickel sample and skimmer cones). High purity (99.9997%) argon (Gasin, Portugal) was used as a nebulizar and as a plasma gas source. The ICP-MS instrument operational parameters were as follow: RF power (1550 W); plasma gas flow (14 L/min); auxiliary gas flow (0.8 L/min); nebulizer flow rate (0.95 L/min). The equipment control and data acquisition were made through the Qtegra software (Thermo Fisher Scientific). The iodine (127I) isotope was monitored for analytical determination, and the tellurium (125Te) isotope was monitored as an internal standard. The instrument was tuned daily for maximum signal sensitivity and stability as well as for low oxides and doubly charged ion formation using the Tune B iCAP Q solution (Thermo Fisher Scientific; 1µg/L of Ba, Bi, Ce, Co, In, Li, and U in 2% HNO3+ 0.5% HCl).
All the solutions were prepared with 1.0% (v/v) tetramethylammonium hydroxide, TMAH 25% w/w(Alfa Aesar, Karlsruhe, Germany), 0.01% Triton™ X-100 (Sigma-Aldrich, St. Louis, MO, USA), and 10µg/L Te (Sigma-Aldrich, St. Louis, MO, USA). The calibration curve was obtained with six
solutions of iodine concentrations within the 25–1000µg/L range. The calibration standard solutions
were prepared by adequate dilution of the iodine standard (Plasma CAL, SCP Science, Quebec H9X 4B6, Canada). The internal standard solution was added to all samples and to the standard solutions in order to obtain a 10µg/L final concentration. Urine samples were diluted (10-fold) before
analysis. The base urine used in this method was a pool of the urine samples from several participants. For analytical quality control purposes, certified reference materials, Trace Elements Urine, L1 and L2 (Seronorm™, Sero, Billingstad, Norway), were analyzed under the same conditions as the study participants’ samples.
2.3.2. Creatinine, Sodium, and Potassium Determination
Creatinine, sodium, and potassium measurements were performed using an ADVIA 1800 instrument (Clinical Chemistry System, Siemens, Erlangen, Germany) by a certified laboratory. Urinary creatinine was determined by Jaffe’s reaction and sodium and potassium levels were determined using ion selective electrodes, following the manufacturer’s instructions.
Considering the importance of integrative approaches to monitor salt and iodine consumption for effective salt iodisation programs, the validated INTERSALT equations (a) and (b) to estimate 24-h urinary sodium excretion in young adults were applied [12,13]. This approach was evaluated by comparing our results with recent data from a 24-h urine excretion in a similar Portuguese population [14].
(a) For men: predicted 24-h urinary sodium excretion (mg/day) = 23×{25.46 + [0.46×spot sodium (mmol/L)]−[2.75×spot creatinine (mmol/L)]−[0.13×spot potassium (mmol/L)] + [4.10× BMI (kg/m2)] + [0.26×age (y)]}
(b) For women: predicted 24-h urinary sodium excretion (mg/day) = 23 ×{5.07 + [0.34×spot sodium (mmol/L)]−[2.16×spot creatinine (mmol/L)]−[0.09×spot potassium (mmol/L)] + [2.39×BMI (kg/m2)] + [2.35×age (y)] – [0.03×age2 (y)]}
2.4. Iodine Determination in Salt Samples
dissolved in ultrapure water (arium®pro system, Sartorius, Göttingen, Germany) at a concentration of 10 g/L and then diluted 1:10.
2.5. Statistical Data Analysis
Statistical analyses were carried out using SPSS 23 (IBM) [15]. Descriptive statistics are presented as numbers and percentages for categorical variables, as the mean and standard deviation (SD) for continuous variables or as the median and inter-quartile range (IQR–25th percentile–75th percentile) if the variable empirical distribution function was skewed. When testing hypotheses about continuous variables, parametric tests (Student’sttest and one factor analysis of variance-ANOVA) and nonparametric tests (Mann-Whitney and Kruskal-Wallis tests) were used as appropriate, taking into account normality assumptions and the number of groups compared. The Kolmogorov-Smirnov test was used to test normality assumptions of the variable distributions. When testing hypotheses about categorical variables, the Chi-square test and Fisher’s exact test were used as appropriate.
The median UIC was used to compare iodine status between groups as recommended by the WHO. Parameter estimates and hypothesis tests were adequately adjusted and weighted taking into account the multi-stage complex sampling design used.
Univariate and multivariate weighted logistic regression models were used to assess factors associated with urinary iodine deficiency (concentration below < 100µg/L). The dependent variable
in all models was the urinary iodine deficiency. Independent variables were as indicated in the tables. The model goodness-of-fit was assessed by the Hosmer-Lemeshow statistic and test. The discriminative/predictive power of the model was evaluated by ROC-receiver operating characteristic-curve analysis. The influence of outlier data values on model fit was estimated using leverage statistics, and collinearity was assessed by evaluation of the coefficients correlation matrix. The results are presented as crude and adjusted Odds Ratios (OR) and their respective 95% confidence intervals.
The statistical significance level was set at 5% and differences were considered statistically significant whenp< 0.05.
3. Results
3.1. Sample Characteristics
A total of 2018 schoolchildren aged 6–12 years old were recruited from 83 elementary and middle schools to participate in the survey (Figure1). Urine and household salt samples were obtained from 2013 and 1999 participants, respectively. All invited schools took part in the study and provided a sample of the salt used for meal preparation in the canteens. The participation rate in the study was 92%.
The sample characteristics by regions are described in Table1. The whole study sample included 52% (n= 1050) boys and 48% (n= 968) girls. No significant differences were found for sex and age distribution by regions. There were significant differences for body mass index (BMI) distribution by region (p= 0.021). Additionally, distribution by sex was similar in the different age groups (data not shown) (p= 0.354).
3.2. Urinary Iodine Concentration
3.2.1. Iodine Status by Region
The median UIC was 129µg/L which is within the iodine adequacy interval of 100–199µg/L
recommended by the WHO (Table1). The median iodine-to-creatinine ratio was 126µg/g. Significant
differences were found for the median UIC between regions, ranging from 116µg/L in Grande Porto
to 137µg/L in Tâmega and 138µg/L in Entre Douro e Vouga (p< 0.001). Additionally, the proximity
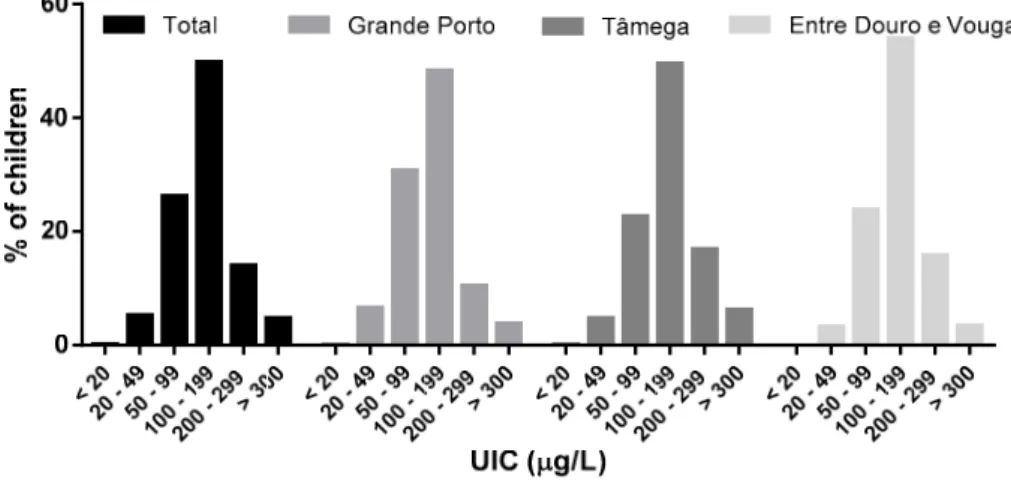
with UIC below 100µg/L was 32%, ranging from 27% in Entre Douro e Vouga to 37% in Grande Porto
(Figure2). Additionally, outside the range of adequate iodine values, 5% of the population displayed elevated iodine levels.
Figure 1.Recruitment diagram.
Table 1.Population characteristics by region.
Variables Total Grande Porto Tâmega Entre Douro e Vouga pValue
Whole (n) 2018 837 831 350
Gender 0.153a
Boys (n; %) 1050; 52 450; 54% 411; 49% 189; 54% Girls (n; %) 968; 48 387; 46% 420; 51% 161; 46%
Age group (n; %) 0.160a
5–6 years old 162; 8 72; 9% 65; 8% 25; 7% 7–8 years old 713; 35 284; 34% 286; 34% 143; 41% 9–10 years old 655; 32 275; 33% 286; 34% 94; 27% 11–12 years old 488; 24 206; 25% 194; 23% 88; 25%
Age (year; mean±sd) 8.9±1.8 8.9±1.8 8.9±1.7 8.9±1.9 0.839b Weight (kg; mean±sd) 35.8±11.1 36.4±11.9 35.6±10.4 35.1±10.7 0.123b Height (cm; mean±sd) 137.0±11.7 136.8±12.0 136.6±11.3 136.4±12.0 0.900b BMI (kg/m2; mean±sd) 18.8±3.4 19.0±3.6 18.7±3.3 18.5±3.0 0.021b Urinary iodine (µg/L; median (P25; P75)) 129 (88; 181) 116 (79; 164) 137 (99; 194) 138 (96; 189) 0.000c
Urinary iodine/creatinine (µg/g; median (P25; P75)) 126 (83; 183) 114 (78; 165) 132 (87; 192) 142 (93; 205) 0.000c
Urinary sodium, est. (mg/day; mean±sd) 2576±782 2587±790 2558±778 2593±770 0.684b Salt intake, est. (g/day; mean±sd) [12] 6.4±2.0 6.5±2.0 6.4±1.9 6.5±1.9 0.684b
n n
Figure 2. Urinary iodine distribution among schoolchildren according to the World Health Organization criteria for iodine adequacy.
3.2.2. Iodine Status by Sex and Age Group
The median UIC in boys was significantly higher than in girls (134 vs. 123µg/L, respectively;
p= 0.002) (Table2). These differences remained significant when urinary iodine was adjusted for creatinine (Table2;p= 0.002). Accordingly, the proportion of the population with UIC below 100µg/L
was significantly lower in boys than in girls (29% vs. 34%, respectively;p= 0.005). When examining UIC >300µg/L, 6% of boys had excessive iodine levels compared to 3% of girls.
UIC also varied with age (Table2). Specifically, the median UIC decreased significantly with age, ranging from 157µg/L in the youngest group (5–6 years old) to 115µg/L in the oldest group
(11–12 years old) (p< 0.001). When adjusted for creatinine, this variation was even more marked with values ranging from 189µg/g in the youngest to 89µg/g in the oldest groups (p< 0.001).
The analysis of the proportions of the age groups according to the WHO cut-off for UIC adequacy categories are shown in Table2. These data indicate that 20% of the children 5–6 years old were below 100µg/L compared to 39% in the 11–12 years age group (p< 0.001). In contrast, 10% of the youngest
age group had excessive iodine intake compared to 2% in the oldest age group (p <0.001).
Table 2.Urinary iodine status by sex and age groups.
Variables UIC ( µg/L)
pValue UIC < 100µg/L UIC > 300µg/L (%) pValue
Iodine-to-Creatinine Ratio (µg/g) pValue
n P25 Median P75 n % n % P25 Median P75
Boys 1050 84 134 177
0.002b 303 29 63 6 0.005c 89 131 185 0.002b Girls 968 91 123 188 331 34 32 3 79 117 182 5–6 years old 161 110 157 208
<0.001a
32 20 16 10
<0.001c
128 189 262
<0.001a 7–8 years old 711 94 138 192 194 27 42 6 104 149 218 9–10 years old 654 84 125 174 220 34 26 4 81 121 169 11-12 years old 487 7 115 160 188 39 11 2 66 89 133
aKruskal-Wallis;bMann-Whitney;cchi-square.
3.2.3. Iodine Status and Dietary Habits
population) confirmed that only 16% of this group was actually consuming iodised salt, corresponding to less than 2% of the whole population (n= 26). Iodised salt consumers had significantly higher UIC levels when compared to non-iodised salt consumers (p< 0.001) and iodine content in household iodised salt samples ranged from 16 mg/kg to 54 mg/kg (n= 26). Although all school canteens were providing lunch meals to the school community, none was using iodised salt (n= 83).
Examination of the impact of milk consumption on iodine levels showed that the group of children that consumed <1 glass of milk/day had a median UIC <100µg/L (96µg/L). This group corresponded
to 23% of the population. In addition, 50% of the children that consumed <1 glass of milk/day and only 20% of the children that consumed at least two glasses of milk a day had a UIC <100µg/L (p< 0.001).
As expected, the risk of UIC <100µg/L was significantly related with milk consumption (Table4).
Multivariate weighted regression models fully adjusted for age, sex, and other food items revealed that the OR of having a UIC <100µg/L is 3.85 times higher with the consumption of <1 glass of milk per
day compared to≥2 glasses milk/day (OR = 3.85; 95% CI (2.42–6.13);p< 0.001). In addition, the OR of having a UIC <100µg/L is 2.2 times higher with the consumption of 1 glass of milk/day compared to
≥2 glasses milk/day (OR = 2.20; 95% CI (1.45–3.34);p< 0.001).
The risk of inadequate iodine consumption among this group (<1 glass of milk/day) was also significantly higher when compared to those consuming 1 glass of milk/day. The analysis of milk consumption also showed that older children consume less milk than younger children (p= 0.045) (Table5), but age remained an iodine deficiency risk factor even when adjusted for milk consumption (Table4). The population mean salt intake was 6.4 g/day, as estimated by sodium excretion in the spot urine samples (Table1). The OR of having a UIC <100µg/L is 2.2 times higher with the consumption of 1 serving of milk
per day compared to two or more servings of milk per day (after adjusting for age and sex).
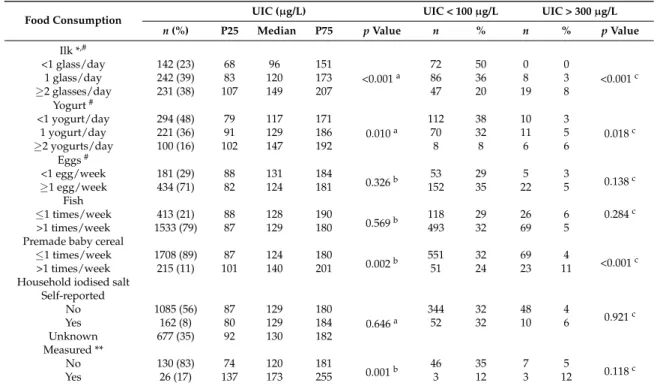
Table 3.Urinary iodine status and dietary habits.
Food Consumption UIC (µg/L) UIC < 100µg/L UIC > 300µg/L
n(%) P25 Median P75 pValue n % n % pValue
Ilk *,#
<1 glass/day 142 (23) 68 96 151
<0.001a
72 50 0 0
<0.001c
1 glass/day 242 (39) 83 120 173 86 36 8 3
≥2 glasses/day 231 (38) 107 149 207 47 20 19 8
Yogurt#
<1 yogurt/day 294 (48) 79 117 171
0.010a
112 38 10 3
0.018c
1 yogurt/day 221 (36) 91 129 186 70 32 11 5
≥2 yogurts/day 100 (16) 102 147 192 8 8 6 6
Eggs#
<1 egg/week 181 (29) 88 131 184
0.326b 53 29 5 3 0.138c
≥1 egg/week 434 (71) 82 124 181 152 35 22 5
Fish
≤1 times/week 413 (21) 88 128 190
0.569b 118 29 26 6 0.284
c
>1 times/week 1533 (79) 87 129 180 493 32 69 5
Premade baby cereal
≤1 times/week 1708 (89) 87 124 180
0.002b 551 32 69 4 <0.001c
>1 times/week 215 (11) 101 140 201 51 24 23 11
Household iodised salt Self-reported
No 1085 (56) 87 129 180
0.646a
344 32 48 4
0.921c
Yes 162 (8) 80 129 184 52 32 10 6
Unknown 677 (35) 92 130 182
Measured **
No 130 (83) 74 120 181
0.001b 46 35 7 5 0.118c
Yes 26 (17) 137 173 255 3 12 3 12
Table 4.Logistic regression models for the association between urinary iodine concentration (UIC) <100µg/L and consumption frequency of different food items.
Variables CrudeaORb(95% CI) pValue AdjustedaORb(95% CI) pValue
Milk (n= 615)
≥2 glasses/day 1.0
<0.001 1.0
<0.001 1 glass/day 2.16 (1.43–3.27) 2.20 (1.45–3.34)
<1 glass/day 4.03 (2.54–6.37) 3.85 (2.42–6.13)
Yogurt (n= 615)
≥2 yogurts/day 1.0
0.019 1 yogurt/day 1.55 (0.90–2.68)
<1 yogurt/day 2.06 (1.22–3.47)
Fish (n= 1946) >1 times/week≤1 times/week 1.00.84 (0.67–1.07) 0.164
Eggs (n= 615) ≥<1 egg/week1 egg/week 1.00.77 (0.53–1.12) 0.169
Premade baby cereal (n= 1923) ≥<1 times/month1 times/month 1.01.54 (1.20–1.99) 0.001
aCrude OR were calculated using univariate weighted logistic regression models. Adjusted OR were calculated
using multivariate weighted logistic regression models. Fully adjusted estimates take into account all three variables (sex, age, and milk) in the model (n= 615);bRisk (OR) of urinary iodine concentration below <100µg/L. 95% CI–95% confidence interval; OR–Odds ratio.
Table 5.Milk consumption * by age group.
Age <1 Glass/Day 1 Glass/Day ≥2 Glasses/Day Total pValue n % per Age Group n % per Age Group n % per Age Group
5–6 years old 4 10% 19 45% 19 45% 42
0.045a
7–8 years old 54 21% 109 42% 98 38% 261
9–10 years old 57 31% 60 32% 68 37% 185
11–12 years old 28 22% 54 42% 46 36% 128
Total 143 242 231 616
* 1 glass or 250 mL of cow milk,aPearson chi-square.
4. Discussion
The present study evaluated the iodine status of school-aged children in the north of Portugal. According to the WHO criteria for iodine status, the median UIC of 129µg/L indicates an adequate
status in this population group, which is in line with the previous national survey conducted in the country [8]. Our data were collected in the northern regions of Grande Porto, Tâmega, and Entre
Douro e Vouga between December 2015 and May 2016. While in 2012 Grande Porto had a median UIC of 95µg/L and 54% of the population below 100µg/L [8], our study indicates a median UIC
increase to 116µg/L and a smaller proportion of the population in this particular region with UIC
<100µg/L (37%). Although the regions of Tâmega and Entre Douro e Vouga were not included in
the previous published national survey [8], the prevalence of iodine deficiency in this population may have decreased in the recent years. In the previously published data [8] it was reported that 47% children had UIC values <100µg/L, which contrasts with 32% in the present study.
In our study, proximity to the sea had no impact on iodine status. Actually, it was observed that the coastal region of Grande Porto had a higher prevalence of iodine deficiency when compared to the innerlands of Tâmega and Entre Douro e Vouga. In contrast, in the past, iodine deficiency and
Across Europe, there has been impressive progress in iodine deficiency control in the last few decades. However, sustaining this progress remains a great challenge as it requires close collaboration between partners at different levels and a strong partnership with the salt industry [18]. In a few countries where mandatory iodine fortification was implemented, an increased prevalence of excessive iodine intake among schoolchildren has been reported [19–21]. This is an important outcome to be monitored in order to re-evaluate iodine nutrition programs, for example in terms of the adjustment of the iodine concentration in fortified salt.
Excess iodine intake is related to an increased risk for hyperthyroidism and autoimmune thyroid diseases, though it is well-tolerated in most people [22]. In individuals with past or present thyroid abnormalities, even modest increases in iodine intake and excessive intakes can precipitate thyroid disorders [23]. In general, iodine intake should not exceed 500µg/day, especially in countries with a
history of iodine deficiency [18]. Nevertheless, it is recognized that the benefits of preventing poor cognitive outcomes from iodine deficiency far outweigh the side-effects of a mildly excessive iodine consumption [18]. While in Portugal this may not represent a problem, as only 5% of the studied population had excessive iodine intake, it is important to consider this group in future monitoring interventions in the country.
The percentage of parents who reported the household usage of iodised salt in our study was just 8% but among these, only 20% were actually using iodised salt, corresponding to less than 2% of the whole population. It was evident that many respondents were convinced that regular cooking salt is a natural source of iodine. These results further indicate that iodised salt consumption in the population is far from the WHO recommendation of 90% household coverage. Similarly, no school canteen (n= 83) was using iodised salt, which demonstrates the lack of efficacy and regulation regarding the current policy of iodised salt usage in Portuguese schools [9]. The fact that 92% of the participating children have lunch in school canteens at least once a week (information collected in the lifestyle questionnaire) suggests that this policy can be a potential effective iodine deficiency control intervention.
The WHO claims that actions towards salt intake reduction and salt iodisation for the control of iodine deficiency disorders are compatible and feasible through the implementation of integrative programs. This relies on the fact that the concentration of iodine added to salt can be adjusted for salt intake [24]. This is a cost effective measure, beneficial for public health, particularly in countries with excessive sodium consumption like Portugal [25]. The opportunity to monitor both iodine and sodium excretion in a large sample lead us to estimate salt consumption in our study population. In spite of the limitation of applying the sodium excretion estimation equation validated for young adults, our results are comparable to those of a 24-h sodium excretion estimated among Portuguese children (6.4±2.0 g/day in our study vs. 6.5±2.2 g/day in Correia-Costa et al.) [14]. The estimation of sodium intake in high risk iodine deficiency population groups from spot urine samples could be an opportunity for adequate monitoring of population means and progress towards public health goals [26]. The fact that sodium intake in our population was estimated to be higher than that recommended by the WHO (<2 g/day) reinforces the importance of integrating salt iodisation and sodium intake reduction interventions in Portugal [25].
While previous Portuguese legislation on iodised salt recommended iodine fortification with potassium iodate at 25–35 mg/kg, which has been a guideline for the salt industry, at the moment no policy exists regarding the adequate concentration intervals for iodine fortification. Lack of cooperation and regulation in the salt industries has led to inadequate iodine prophylactic programs in several countries [19,21,27,28]. The broad iodine concentration range, between 16–54 mg/kg, observed in Portuguese household iodised salt clearly indicates a lack of control and a higher risk for the ineffective usage of iodised salt in the country. This may be a relevant aspect to consider in a future iodine deficiency control program to be implemented in Portugal.
contributing to this improvement compared to the results found in the Limbert study [8]. Among these factors, population age, food consumption, study design, and analytical methodologies could explain these differences. It is our opinion that this comparison is extremely relevant for monitoring purposes. While both studies have included children aged 6–12 years, it was not possible to compare the mean age between them to explore potential differences. As age is a determinant of iodine status, this would be relevant, as food consumption and metabolism requirements during growth may change significantly. Milk consumption was confirmed to be a major determinant of iodine intake and was significantly lower in older compared to younger children. Bath and colleagues have also suggested that iodine status in teenage girls compared to younger girls may be explained by a higher milk consumption in the younger group [29]. Thus, it is not surprising that in our study the proportion of iodine deficient children is almost double in the oldest age group (11–12 years) compared to the youngest age group (5–6 years). We could argue that iodine status differences observed between the present study and Limbert’s study [8] could be due to different methodological approaches, such as urine sampling time or the iodine quantification method used. While total 24 h urine iodine excretion is considered the gold standard for iodine estimation, the use of alternative sampling methods are considered suitable, easier, and more practical to use in population studies [30]. Importantly, the WHO epidemiological criteria for assessing iodine nutrition in schoolchildren is based on the median UIC obtained from spot urine samples. Nevertheless, because urinary iodine excretion is affected by the circadian rhythm, single spot measures can fluctuate during the day [30]. The uniformity of urine sampling methods and analytical methods is desirable to improve the quality of monitoring studies. Regarding methodological approaches for iodine quantification, the use of ICP-MS in our study has offered a reliable, sensitive, and fast method to determine iodine concentration in the population.
In our study, the importance of milk products consumption, but not fish, to the iodine adequacy in the population was evident. Despite the fish iodine content, the frequency of fish intake may not be sufficient to have an impact on iodine status in children. Limbert’s group also reported a reduced iodine deficiency risk among schools that provided milk to children supported by the national program for milk consumption in schools. However, no individual information was collected in that study. In our study, self-reported data from more than 600 households has confirmed that lower milk consumption increased the risk of iodine deficiency. One limitation of this approach was the fact that the data regarding consumption of milk products and eggs by children were not included in the initial lifestyle questionnaire. These data were collected in a second wave of data collection in an additional online questionnaire completed by a sub-sample of parents. Importantly, we identified that the group of children that consumes less than one glass of milk a day (23% of the population) had a median UIC <100µg/L. The identification of this iodine deficiency risk group can be relevant for national public
health entities.
In conclusion, although the present study indicates that the average UIC in school-aged children is within adequacy levels, one third of the population may be at risk of iodine deficiency. While milk consumption is an important determinant of iodine status, the use of iodised salt in Portugal remains far from reaching the international guidelines. Whether or not iodine deficiency control policies are implemented in the country, we stress the need for a monitoring program and regulations aligned with the commitment of reducing population salt intake for an effective public health intervention.
Acknowledgments:The authors would like to thank to all the children, parents, teachers, and school boards who participated in and contributed to the survey. We also thank to the Directorate-General of Education for facilitating the contact between the researchers and the schools. The present project was granted by the Public Health Initiatives Programme (PT06), financed by EEA Grants Financial Mechanism 2009–2014, and supported by FEDER through the operation POCI-01-0145-FEDER-007746 funded by the Programa Operacional Competitividade e Internacionalização—COMPETE2020 and by National Funds through FCT—Fundação para a Ciência e a Tecnologia within CINTESIS, R&D Unit (reference UID/IC/4255/2013). Diogo Pestana and Virgínia Cruz Fernandes are currently funded by Fundação para Ciência e Tecnologia (SFRH/BPD/109158/2015 and SFRH/BPD/109153/2015, respectively).
Author Contributions:Conceição Calhau, Luis Azevedo and Irene Palmares Carvalho conceived the research project. Bruno Peixoto, JoséCarlos Caldas, António Guerra, Manuel Fontoura, Sandra Leal, Roxana Moreira, Rui Matias Lima, Cátia Martins and Cristina Delerue-Matos contributed to the study design. Edgar Pinto and Agostinho Almeida contributed lab equipment and reagents. João Costa Leite, Elisa Keating, Diogo Pestana, Virginia Cruz Fernandes, Sónia Norberto, Diana Sintra, Bárbara Moreira, Ana Costa, Sofia Silva, Vera Costa, Inês Martins, Francisca Castro Mendes and Pedro Queirós conducted data collection. Virgínia Cruz Fernandes conceived the lab experiments. Virginia Cruz Fernandes, Maria Luz Maia and Sónia Norberto analysed urine and salt samples. João Costa Leite, Elisa Keating, Diogo Pestana, Virgínia Cruz Fernandes, Maria Luz Maia, André Moreira-Rosário and Luis Azevedo analysed data. João Costa Leite, Elisa Keating, Diogo Pestana and Virgínia Cruz Fernandes equally contributed to the primarily content of this work and wrote the paper. All the authors read and approved the final version of the manuscript.
Conflicts of Interest:The authors declare no conflict of interest.
References
1. Andersson, M.; Karumbunathan, V.; Zimmermann, M.B. Global iodine status in 2011 and trends over the past decade.J. Nutr.2012,142, 744–750. [CrossRef] [PubMed]
2. Bath, S.C.; Steer, C.D.; Golding, J.; Emmett, P.; Rayman, M.P. Effect of inadequate iodine status in uk pregnant women on cognitive outcomes in their children: Results from the avon longitudinal study of parents and children (alspac).Lancet2013,382, 331–337. [CrossRef]
3. Gordon, R.C.; Rose, M.C.; Skeaff, S.A.; Gray, A.R.; Morgan, K.M.; Ruffman, T. Iodine supplementation improves cognition in mildly iodine-deficient children.Am. J. Clin. Nutr.2009,90, 1264–1271. [CrossRef] [PubMed]
4. Zimmermann, M.B.; Connolly, K.; Bozo, M.; Bridson, J.; Rohner, F.; Grimci, L. Iodine supplementation improves cognition in iodine-deficient schoolchildren in Albania: A randomized, controlled, double-blind study.Am. J. Clin. Nutr.2006,83, 108–114. [PubMed]
5. Zimmermann, M.B.; Jooste, P.L.; Pandav, C.S. Iodine-deficiency disorders. Lancet2008,372, 1251–1262. [CrossRef]
6. Vanderpump, M.P.; Lazarus, J.H.; Smyth, P.P.; Laurberg, P.; Holder, R.L.; Boelaert, K.; Franklyn, J.A.; British Thyroid Association, U.K.I.S.G. Iodine status of uk schoolgirls: A cross-sectional survey.Lancet2011,377, 2007–2012. [CrossRef]
7. Limbert, E.; Prazeres, S.; Sao Pedro, M.; Madureira, D.; Miranda, A.; Ribeiro, M.; Jacome de Castro, J.; Carrilho, F.; Oliveira, M.J.; Reguengo, H.; et al. Iodine intake in portuguese pregnant women: Results of a countrywide study.Eur. J. Endocrinol.2010,163, 631–635. [CrossRef] [PubMed]
8. Limbert, E.; Prazeres, S.; Sao Pedro, M.; Madureira, D.; Miranda, A.; Ribeiro, M.; Carrilho, F.; Jacome de Castro, J.; Lopes, M.S.; Cardoso, J.; et al. Iodine intake in portuguese school children.Acta Medica Port.2012, 25, 29–36.
9. DGE. Orientações Sobre Ementas e Refeitórios Escolares–2013/2014. Available online:http://www.dge. mec.pt/refeitorios-escolares(accessed on 6 December 2016).
10. Rito, A.; Breda, J.; Carmo, I.Guia de Avaliação Do Estado Nutricional Infantil e Juvenil; Instituto Nacional de
11. CDC.Iodine and Mercury in Urine: Nhanes 2011-2012: Method 3002.1. Available online:https://www.cdc.gov/ nchs/data/nhanes/nhanes_11_12/uiouhg_g_met_iodine_mercury.pdf(accessed on 6 December 2016). 12. Cogswell, M.E.; Wang, C.Y.; Chen, T.C.; Pfeiffer, C.M.; Elliott, P.; Gillespie, C.D.; Carriquiry, A.L.; Sempos, C.T.;
Liu, K.; Perrine, C.G. Validity of predictive equations for 24-h urinary sodium excretion in adults aged 18–39 y.Am. J. Clin. Nutr.2013,98, 1502–1513. [CrossRef] [PubMed]
13. Campbell, N.R.; Dary, O.; Cappuccio, F.P.; Neufeld, L.M.; Harding, K.B.; Zimmermann, M.B. Need for coordinated programs to improve global health by optimizing salt and iodine intake. Rev. Panam. Salud Publica2012,32, 281–286. [CrossRef]
14. Correia-Costa, L.; Cosme, D.; Nogueira-Silva, L.; Morato, M.; Sousa, T.; Moura, C.; Mota, C.; Guerra, A.; Albino-Teixeira, A.; Areias, J.C.; et al. Gender and obesity modify the impact of salt intake on blood pressure in children.Pediatr. Nephrol.2016,31, 279–288. [CrossRef] [PubMed]
15. Ibm Spss Statistics for Windows, version 23.0; IBM Corporation: Armonk, NY, USA, 2014.
16. Mendes, H.; Zagalo-Cardoso, J.A. Estudo epidemiológico de prevalência do bócio endémico em oleiros. Acta Medica Port.2002,15, 101–111.
17. Johner, S.A.; Thamm, M.; Nothlings, U.; Remer, T. Iodine status in preschool children and evaluation of major dietary iodine sources: A german experience.Eur. J. Nutr.2013,52, 1711–1719. [CrossRef] [PubMed] 18. Andersson, M.; Benoist, B.; Darnton-Hill, I.; Delange, F.Iodine Deficiency in Europe: A Continuing Public Health
Problem; WHO/UNICEF: Geneva, Switzerland, 2007.
19. Kusic, Z.; Jukic, T.; Rogan, S.A.; Juresa, V.; Dabelic, N.; Stanicic, J.; Boric, M.; Lukinac, L.; Mihaljevic, I.; Punda, A.; et al. Current status of iodine intake in Croatia–the results of 2009 survey.Coll. Antropol.2012,36, 123–128. [PubMed]
20. Laurberg, P.; Jorgensen, T.; Perrild, H.; Ovesen, L.; Knudsen, N.; Pedersen, I.B.; Rasmussen, L.B.; Carle, A.; Vejbjerg, P. The danish investigation on iodine intake and thyroid disease, danthyr: Status and perspectives. Eur. J. Endocrinol.2006,155, 219–228. [CrossRef] [PubMed]
21. Carvalho, A.L.; Meirelles, C.J.; Oliveira, L.A.; Costa, T.M.; Navarro, A.M. Excessive iodine intake in schoolchildren.Eur. J. Nutr.2012,51, 557–562. [CrossRef] [PubMed]
22. Leung, A.M.; Braverman, L.E. Consequences of excess iodine. Nat. Rev. Endocrinol. 2014,10, 136–142. [CrossRef] [PubMed]
23. Emder, P.J.; Jack, M.M. Iodine-induced neonatal hypothyroidism secondary to maternal seaweed consumption: A common practice in some asian cultures to promote breast milk supply. J. Paediatr. Child Health2011,47, 750–752. [CrossRef] [PubMed]
24. WHO. Guideline: Fortification of Food-Grade Salt With Iodine for the Prevention and Control of Iodine Deficiency Disorders. Geneva. Available online:http://www.who.int/nutrition/publications/guidelines/ fortification_foodgrade_saltwithiodine/en/(accessed on 6 December 2016).
25. Salt Reduction and Iodine Fortification Strategies in Public Health: REPORT of a Joint Technical Meeting. Available online:http://apps.who.int/iris/handle/10665/101509(accessed on 6 December 2016).
26. McLean, R.M. Measuring population sodium intake: A review of methods.Nutrients2014,6, 4651–4662. [CrossRef] [PubMed]
27. Peter, F.; Podoba, J.; Muzsnai, A. Iodine status of schoolchildren in hungary: Improvement a decade on. Eur. Thyroid. J.2015,4, 71–72. [CrossRef] [PubMed]
28. Kassim, I.A.; Moloney, G.; Busili, A.; Nur, A.Y.; Paron, P.; Jooste, P.; Gadain, H.; Seal, A.J. Iodine intake in somalia is excessive and associated with the source of household drinking water.J. Nutr.2014,144, 375–381. [CrossRef] [PubMed]
29. Bath, S.C.; Combet, E.; Scully, P.; Zimmermann, M.B.; Hampshire-Jones, K.H.; Rayman, M.P. A multi-centre pilot study of iodine status in uk schoolchildren, aged 8–10 years.Eur. J. Nutr.2015,55, 2001–2009. [CrossRef] [PubMed]
30. Ji, C.; Lu, T.; Dary, O.; Legetic, B.; Campbell, N.R.; Cappuccio, F.P. Systematic review of studies evaluating urinary iodine concentration as a predictor of 24-hour urinary iodine excretion for estimating population iodine intake.Rev. Panam. Salud Publica2015,38, 73–81. [PubMed]
32. Watutantrige Fernando, S.; Barollo, S.; Nacamulli, D.; Pozza, D.; Giachetti, M.; Frigato, F.; Redaelli, M.; Zagotto, G.; Girelli, M.E.; Mantero, F.; et al. Iodine status in schoolchildren living in northeast italy: The importance of iodized-salt use and milk consumption. Eur. J. Clin. Nutr. 2013,67, 366–370. [CrossRef] [PubMed]
33. Dahl, L.; Opsahl, J.A.; Meltzer, H.M.; Julshamn, K. Iodine concentration in norwegian milk and dairy products.Br. J. Nutr.2003,90, 679–685. [CrossRef] [PubMed]
34. Reaching Optimal Iodine Nutrition in Pregnant and Lactating Women and Young Children: A Joint
Statement by WHO and UNICEF. Geneva, World Health Organization. 2007. Available online:
http://www.who.int/nutrition/publications/micronutrients/WHOStatement__IDD_pregnancy.pdf (accessed on 6 December 2016).