GVSOS:
A
NEW
CLIENT
FOR
OGC®
SOS
INTERFACE
STANDARD
GVSOS:
A
NEW
CLIENT
FOR
OGC®
SOS
INTERFACE
STANDARD
Dissertation supervised by PhD Joaquín Huerta PhD Fernando Bacao
Laura Díaz
A
CKNOWLEDGEMENTS
I would like to thank to professors Joaquin Huerta and Michael Gould for their support
during every step of the Master Degree Program. I would also like to thanks the Erasmus
Mundus Scholarship program for giving me the chance to be part of this wonderful
GVSOS:
A
NEW
CLIENT
FOR
OGC®
SOS
INTERFACE
STANDARD
A
BSTRACT
The popularity of sensor networks has increased very fast recently. A major problem with
these networks is achieving interoperability between different networks which are
potentially built using different platforms. OGC’s specifications allow clients to access
geospatial data without knowing the details about how this data is gathered or stored.
Currently OGC is working on an initiative called Sensor Web Enablement (SWE), for
specifying interoperability interfaces and metadata encodings that enable real‐time
integration of heterogeneous sensor webs into the information infrastructure. In this work
we present the implementation of gvSOS, a new module for the GIS gvSIG to connect to
Sensor Observation Services (SOS). The SOS client module allows gvSIG users to interact
with SOS servers, displaying the information gathered by sensors in a layer composed by
features. We present the detailed software engineering development process followed to
build the module. For each step of the process we specify the main obstacles found during the development such as, restrictions of the gvSIG architecture, inaccuracies in the OGC’s specifications, and a set of common problems found in current SOS servers implementations available on the Internet.
K
EYWORDS
GIS Applications Sensor Web Enablement OGC SOS specification gvSIG extensions Software Engineering
A
CRONYMS
OGC – Open Geospatial Consortium SOA ‐ Service‐Oriented Architecture GIS – Geographic Information System WMS ‐ Web Map Service
WCS ‐ Web Coverage Service WFS ‐ Web Feature Service SWE ‐ Sensor Web Enablement O&M ‐ Observation & Measurement SOS ‐ Sensor Observations Service SPS ‐ Sensor Planning Service SAS ‐ Sensor Alert Service WNS ‐ Web Notification Service ADC ‐ Analog to Digital Converter
SIVAM ‐ System for the Vigilance of the Amazon XML ‐ Extensible Markup Language
GML – Geography Markup Language GPL ‐ GNU General Public License MDI ‐ Multiple Documents Interface JTS – Java Topology Suite
OWS – OGC Web Services
I
NDEX
Index of Figures __________________________________________________ ix
1. Introduction____________________________________________________ 1
2. State of the Art__________________________________________________ 5
2.1 Sensor Networks __________________________________________________________5
2.1.1 Sensor Nodes __________________________________________________________7 2.1.2 Applications___________________________________________________________8
2.2 Sensor Web Enablement __________________________________________________11
2.2.1 Services and Encodings _________________________________________________12 2.2.2 Typical workflows_____________________________________________________14 2.2.2 SWE Common________________________________________________________17 2.2.3 O&M implementation specification _______________________________________17 2.2.4 SensorML implementation Specification ___________________________________20 2.2.5 SOS implementation Specification ________________________________________22
2.3 Known SWE implementations ______________________________________________23
2.3.1 52° North’s SWE implementation _________________________________________24 2.3.2 UAH VAST’s SWE implementation _______________________________________24
2.4 Some projects using SWE _________________________________________________25
2.5 Summary _______________________________________________________________26
3. gvSIG ________________________________________________________ 27
3.1. Architecture ____________________________________________________________27
3.2. Plug-in and Extensions ___________________________________________________35
3.2.1 Extensions ___________________________________________________________35
3.3. gvSIG Mobile ___________________________________________________________37
3.4. Supporting Libraries _____________________________________________________37
3.5. Summary_______________________________________________________________39
4. Analysis ______________________________________________________ 40
4.1 Plug-in Requirements _____________________________________________________40
4.1 Use case model___________________________________________________________41
4.2 High Level Architecture ___________________________________________________42
4.3 Summary _______________________________________________________________43
5. Design and Implementation______________________________________ 44
5.1 gvSIG layer _____________________________________________________________44
5.2 Fmap layer______________________________________________________________46
5.3 SubDriver layer__________________________________________________________48
5.4 Initialize extension _______________________________________________________51
5.5 Add SOS Layer __________________________________________________________52
5.5.1 gvSIG layer __________________________________________________________53 5.5.2 Fmap and Remote Services layers _________________________________________54
5.6 Showing sensors and observations data ______________________________________57
5.7 Tests and Preliminary Results ______________________________________________59
5.8 Summary _______________________________________________________________61
6. Conclusions ___________________________________________________ 62
References ______________________________________________________ 63
I
NDEX
OF
F
IGURES
Figure 1: Generic architecture of sensor networks (Akyildiz et al., 2002) 5
Figure 2: Components of a sensor node. Adapted form (Akyildiz et al., 2002) 8
Figure 3: SWE framework context (OGC, 2008) 13
Figure 4: SOS client requesting observation’s data from a server (OGC, 2008) 15
Figure 5: SOS client accessing streaming data from the source (OGC, 2008) 16
Figure 6: SOS client accessing sensor’s data from a server (OGC, 2008) 16
Figure 7: Basic Observation Model (OGC, 2007) 18
Figure 8: Conceptual model for Processes (OGC, 2007b) 21
Figure 9: Functional components of gvSIG. 28
Figure 10: Component diagram of the gvSIG subsystem (gvSIG, 2008a) 29
Figure 11: Component diagram of the Fmap subsystem (gvSIG, 2008a) 31
Figure 12: Component diagram of the SubDriver subsystem(gvSIG, 2008a) 32
Figure 13: ANDAMI functional blocks (gvSIG, 2008a) 33
Figure 14: IExtension relationships (gvSIG, 2008a) 36
Figure 15: Use case diagram for gvSOS. 41
Figure 16: Package diagram showing the gvSOS architecture. 43
Figure 17: gvSIG‐SOS package diagram. 45
Figure 18: Class diagram showing SOSWizard and its relationships 46
Figure 19: Fmap‐SOS package diagram. 47
Figure 20: Fmap‐SOS class diagram. 47
Figure 21: Remote Services package diagram. 49
Figure 22: Class diagram of the RemoteServices‐SOS package. ________ 50
Figure 23: gvSOS configuration file (config.xml). 52
Figure 24: Diagram showing how connection is established at the user interface level. 53
Figure 25: Sequence diagram showing the layer creation process. _______54
Figure 27: Sequence diag. showing how information regarding procedures is read. 56
Figure 28: Sensor systems located in four Mediterranean harbours. 56
Figure 29: Table containing the information about the sensors included in the view. 57
Figure 30: Sequence diagram showing how observations are read from the server. 58
Figure 31: Table showing observation times and values. 58
Figure 32: Displaying observations on a graph. 59
1
I
NTRODUCTION
The popularity of sensor networks has increased very quickly. The production of sensors
that become cheaper every day is possible due to continuous advances in semiconductor
technology. At present, a low‐cost processor, a group of sensors and a radio transmitter, can
be easily combined in a single and inexpensive unit. These devices, although useful
individually, offer maximum effectiveness when used together for sensing complex physical
phenomena. Sensor nodes can be distributed inside a particular phenomenon or in its
neighbourhood to measure its main properties. Sensor networks can be used in a wide
variety of applications. Examples include environmental monitoring (Martinez et al., 2004),
habitat monitoring (Mainwaring et al., 2002)(Szewczyk et al., 2004), structural health
monitoring (Paek et al.,2005)(Chintalapudi et al., 2006), seismic detection (Werner‐Allen et
al., 2005) (Werner‐Allen et al., 2006) and military surveillance.
Sensor networks can be implemented using a large range of technologies regarding
sensors and communication devices. Many design aspects must be considered such as fault tolerance, scalability, production costs, operating environment, network topology, hardware
constraints, transmission media and power consumption (Akyildiz et al., 2002). For these
reasons, building such networks is not a trivial task. Apart from dealing with the inherent
complexity of a single network, another problem is achieving interoperability between
different networks that are potentially built using different software and hardware
technologies. Consider the problem of different government agencies trying to integrate
their data sources to build a unified model of the environment. Each agency might gather
their data using sensors that cannot interoperate with devices from other agencies because
gathered data might also be stored using different formats because interoperability was not a primary goal when the system was built.
Over the last few years, a lot of work has been devoted to standardise the components
and interfaces, including hardware and software interfaces, composing sensor networks.
This standardisation simplifies the interoperability between the components inside a specific network, which we call internal interoperability, and the interoperability of different clients with different networks, which we call external interoperability. The latter is frequently
achieved using a Service‐Oriented Architecture (SOA). This architecture presents an
approach for building distributed systems that deliver application functionality as services
to either end‐user applications or other services (Endrei et al, 2004). Some of the benefits of SOS are the reuse of existing software assets just by wrapping them up as services, the minimization of the impact of future changes because they focus on an interface and not in the implementation, and the possibility of composing existing services to build new ones (Endrei et al, 2004).
This architecture is widely used in the GIS field to access geospatial data through
implementation specifications like: Web Map Service Implementation Specification (WMS)
(OGC, 2006a), Web Coverage Service Interface Implementation Specification (WCS) (OGC,
2006) and Web Feature Service Implementation Specification (WFS) (OGC, 2005). These
specifications maintained by the Open Geospatial Consortium (OGC) allow GIS clients to
access geospatial data without knowing details about how this data is gathered or stored.
The use of standard specifications addresses the following needs of the GIS community
(OGC, 2005b):
• To share and reuse data in order to decrease costs (avoid redundant data
collection), get more or better information, and increase the value of data
holdings.
• To choose the best tool for the job, and the related need of reducing technology
and procurement risk (i.e., the need to avoid being locked‐in to one vendor).
• To allow people with less training to benefit from using geospatial data in more
At present, OGC is working on an initiative called Sensor Web Enablement (SWE), for
“specifying interoperability interfaces and metadata encodings that enable real time
integration of heterogeneous sensor webs into the information infrastructure. Developers
will use these specifications to create applications, platforms, and products involving Web‐ connected devices such as flood gauges, air pollution monitors, stress gauges on bridges,
mobile heart monitors, Webcams, and robots as well as space and airborne earth imaging
devices” (OGC, 2008b). This framework should allow sensor nodes and their corresponding sensor networks to be monitored and controlled through web interfaces using GIS clients.
SWE includes several implementation specifications and best practices papers. Each one
of them addresses a specific area within the topic. They can be divided in two groups: specifications dealing with schemata of data and processes, and specifications of services. In the first category we can find the following specifications (OGC, 2008): Observation &
Measurement (O&M) Schema (OGC, 2007), Sensor Model Language (SensorML) (OGC,
2007b) and Transducer Markup Language (TransducerML or TML) (OGC, 2007d). In the
second category we can find four different services: Sensor Observations Service (SOS)
(OGC, 2007g), Sensor Planning Service (SPS) (OGC, 2007c), Sensor Alert Service (SAS) (OGC, 2007a) and Web Notification Services (WNS) (OGC, 2007e).
The goal of this project is to implement an extension for the GIS client gvSIG (gvSIG, 2008) to connect to Sensor Observation Services providers. gvSIG is an open source GIS designed for managing geographic information. This tool provides support for common data formats,
including vector and raster spatial data, remote spatial databases, and standard OGC web
services. gvSIG allows the combination in a single view of geospatial data with different
formats and coming from different sources. Its name is an abbreviation of ”Generalitat
Valenciana, Sistema dʹInformació Geográfica”.
A gvSIG extension is a software component that can be installed to a client to add new
functionality. In this case, the SOS client extension allows gvSIG users to interact with SOS
servers displaying the information gathered by sensors in a layer composed by features.
With this extension, the community of gvSIG users is able to access these networks without
depending on any proprietary software or any specific internal protocols used by the
software company Prodevelop, and independent developers. Our role in the project is
implementing the communication and user interface layers, although the whole extension
architecture is presented here.
The rest of this document is structured as follows: Chapter 2 presents an introduction to
the sensor networks topic. The chapter presents basic concepts and some general
information about these networks, but it focuses mainly in the current OGC standards
related with SWE. Chapter 3 introduces gvSIG, presenting its architecture and extension
2
S
TATE
OF
THE
A
RT
In this chapter, we present a general introduction to the topic of sensor networks. First,
the main concepts of the subject are presented. After that, a set of applications examples is shown. Last, an extensive introduction to the SWE framework is presented, especially to the Sensor Observation Service implementation specification.
2.1
Sensor
Networks
Sensors are devices for the measurement of physical quantities (OGC, 2007b). A sensor network can be described as a collection of sensor nodes that coordinate to perform some
specific action. The sensors nodes form a computer accessible network of many, spatially distributed, devices to monitor conditions at different locations (OGC, 2007g). Figure 1 shows a generic architecture of such networks taken from (Akyildiz et al., 2002).
Sensor nodes are located in the sensor field. These nodes collect and route data about the
field to the sink, which make the data available to the end user over the communication
network (e.g. Internet).
Sensor networks provide several advantages when compared with traditional sensor
platforms (Akyildiz et al., 2002) (Rentala et al, 2001):
• Sensors can be easily deployed “within” the actual phenomenon in an ad‐hoc
manner.
• Sensors have (limited) processing capabilities to pre‐process the gathered data.
Traditional models usually performed all the processing on central nodes in
charge of gathering the raw data from the sensors.
• Greater fault tolerance is provided through redundancy.
• Coverage of large areas is provided through the union of individual nodes
coverage area
• Sensors can be deployed in areas without energy infrastructure.
Sensor networks present different operational and technical characteristics than ad‐hoc
and cellular networks, in which the main goal is to optimize Quality of Service (QoS) and
high bandwidth efficiency. On the other hand, the main goal in a sensor network is to
maximize the network lifetime focusing mostly on power conservation. Next, we mention
some of the differences between these networks (Akyildiz et al., 2002)(Rentala et al, 2001):
• The network is composed by hundreds to thousands of nodes that are densely
deployed.
• The position of sensor nodes need not be engineered or pre‐determined implying
that the network must present self‐organizing capabilities.
• The network topology may change frequently because of mobile nodes, defective
nodes, new added nodes, or changes in the environment.
• Designed for unattended operation; the network must work without human
intervention maybe because it might be located in inaccessible or hostile areas.
• The sensor nodes are not usually connected to an energy source, so energy must
• Sensors are prone to failure. The network must be fault tolerant; its overall functioning should not be compromised by the failure of individual nodes.
• Sensor nodes use mainly broadcast communication
• Sensors have limited computational capacities and memory. However, they
partially process raw data to minimize communication which is the most energy consuming operation (Culler et al, 2004).
2.1.1
Sensor
Nodes
A sensor node must satisfy the following requirements (Vieira et al., 2003):
• Energy‐efficiency: Energy is the major resource. It determines the node lifetime.
• Low‐cost: A node must be low‐cost to keep a network with hundreds or thousand
cost‐effective.
• Wireless: usually an installed communication infrastructure is not available.
It is composed of the following main components (Akyildiz et al., 2002) (Vieira et al., 2003):
• Sensing unit: usually formed by sensors and analog to digital converters (ADC).
Sensors estimate the values of observed properties and produce analog signals.
These analog signals are converted to a digital one by the ADCs and sent to the
processing unit.
• Processing Unit: it is composed of a microcontroller and memory to store data
and applications programs. The processing unit executes procedures for
gathering the data read by sensors and in some cases it pre‐processes the data before sending it to the sink.
• Transceiver unit: connects the node to the network. Possible choices of
transmission technologies are optical, infrared and radio frequency
Fig. 2: Components of a sensor node
Apart from the basic components two others are commonly found on sensor nodes
(Akyildiz et al., 2002):
• Location finding system: frequently the location of the must be known with high
accuracy.
• Mobilizer: Useful to change the position of nodes
Typically, sensors (and therefore sensor nodes) can be classified in two basic categories:
In‐situ sensors measuring a physical property of the phenomenon surrounding the sensor,
and remote sensors measuring physical properties associated with features at some distance
from the sensor (OGC, 2007b).
2.1.2
Applications
In this section we present examples of how sensor networks have been applied in
different fields. Specifically, we selected examples from environmental monitoring, habitat
monitoring, structural health monitoring and seismic detection.
Environmental
monitoring
Monitoring the environment has been one of the main applications of sensor networks
have been developed. In (Martinez et al., 2004) a system for monitoring a glacial environment is presented. The system’s aim was to record the behaviour of ice caps and glaciers over a reasonable geographic area and over a relatively long time in an autonomous
way. (Tolle et al.,2005) presents a study of complex spatial variations and temporal
dynamics of the microclimate surrounding a coastal redwood tree. A sensor network was
deployed where each sensor was able to measure air temperature, relative humidity, and
photosynthetically active solar radiation.
The FLOODNET project (Envisense, 2008) uses sensor network for flood warning. The
network nodes adapts dynamically in presence of environmental or infrastructural
circumstances. The SECOAS project uses smart sensors to measure sea bed movement. The
sensors are capable of dynamic self‐configuration and use decentralized algorithms that
enable automated adaptation to failures, upgrades and requirement changes (Envisense,
2008b).
As an example of a large scale network for environmental monitoring we can mention the System for the Vigilance of the Amazon (SIVAM). SIVAM is a project including a network of
surveillance radars, environmental sensors, communications systems, an air traffic control
centre, and coordination centres scattered throughout a the Brazilian Amazon region
(Jensen, 2002).
Habitat
Monitoring
Another field with many sensor networks applications is habitat monitoring. The
characteristics of sensor networks make them specially well‐suited for this kind of
application. They can be inserted into the observed habitat without altering the parameters
to be measured. Thanks to the wireless technology used commonly in these networks the
behaviour of subjects can be studied without intrusions by observers. Last, the health and
status of the instrumentation can be monitored remotely (Szewczyk et al., 2004). Maybe the best known example in this field is the study of sea birds at Great Duck Island, Maine
(Szewczyk et al., 2004)(Mainwaring et al., 2002)(Szewczyk et al., 2004a). In this project, the
et al., 2004) where a wireless sensor network is used for studying how the number of
location of microorganisms is correlated with chemical and physical parameters in the
marine environment.
Seismic
detection
Volcanoes are studied for predicting possible eruptions, measuring the level of volcano
unrest or just to understand physical processes occurring inside the volcano (Werner‐Allen
et al., 2006a). The seismometer is the most commonly used instrument when studying
volcanoes. It measures round‐propagating elastic radiation from both sources internal to the volcano (e.g., fracture induced by pressurization) and on the surface (e.g., expansion of gases during an eruption) (McNutt, 1996).
In (Werner‐Allen et al., 2006) a wireless network for monitoring volcanic eruptions at the
Tungurahua volcano in Ecuador is presented. This network was built using low frequency
acoustic sensor for collecting infrasonic signal that were transmitted to a remote base station. In (Werner‐Allen et al., 2006a) a sensor network was deployed at the Reventador volcano in
Ecuador. Network nodes used an event‐detection algorithm to trigger on interesting
volcanic activity and initiate reliable data transfer to the base station.
A large scale project in this field is being carried out by Jet Propulsion Laboratory, California Institute of Technology. The Sensor Web Project uses a network of sensors linked
by software and the internet to an autonomous satellite observation response facility. This
system has been used to implement a global surveillance program to study volcanoes. Tests to study flooding, cryosphere events, and atmospheric phenomena have been also executed (NASA, 2008) (Chien at al., 2007) (Sherwood&Chien, 2007).
Structure
Health
Monitoring
Structure Health monitoring (SHM) is focused in assessing integrity in a variety of
structure such as buildings or bridges. Different techniques are used to detect and locate
damages in the structures. These techniques rely on measuring structural response to
ambient vibrations or forced excitation. Ambient vibrations can be caused by earthquakes,
piezoelectric shakers. The existence and location of damage can be inferred by detecting
differences in local or global structural response before and after damage (Chintalapudi et
al., 2006). According to (Paek et al.,2005) most existing implementations use wired data
acquisition systems to collect structural vibration data from various locations in the
structure. The installation of a large scale system of this kind can be a very time consuming and expensive task. For these reasons, the use of sensor networks is considered a more appropriate solution.
In (Chintalapudi et al., 2006) the design of NETSHM is described. NETSHM is a
programmable, re‐usable and evolvable sensor network system that can be used to
implement a variety of structural monitoring techniques. The system implements
programming abstractions that allow structural engineers to use it without knowing low
level details about the network details. (Paek et al.,2005) presents Wisdem, a system
consisting of wireless nodes, placed at various locations on a large structure, to collect and
transmit time‐synchronized structural vibration data to a base‐station. Each Wisden node
measures structural vibrations with the help of a vibration card specifically designed for high quality low‐power vibration sensing
2.2
Sensor
Web
Enablement
Despite the large number of existing sensor networks deployed, most of them remained
traditionally close to certain sensor communities offering limited mechanisms for
interoperability. Sensors within these communities are not easily discovered, accessed or
tasked. Each type of sensor usually uses its own metadata, its own data format and its own software. Hence, the extension and modification of networks containing them is restricted at a serious degree (OGC, 2008). The OGC’s1 Sensor Web Enablement (SWE) initiative is a
framework that specifies interfaces and metadata encodings to enable real time integration
1 The Open Geospatial Consortium, Inc (OGC) is an international industry consortium of
of heterogeneous sensor webs into the information infrastructure. It provides services and encodings to enable the creation of web‐accessible sensor assets (OGC, 2008b). According to
(OGC, 2007g) the models, encodings, and services of the SWE architecture enable
implementation of interoperable and scalable service‐oriented networks of heterogeneous
sensor systems and client applications. The functionality implemented in SWE must allow
the implementation of solutions capable of:
• Discovery of sensor systems, observations, and observation processes that meet
an application’s or user’s immediate needs;
• Determination of a sensor’s capabilities and quality of measurements;
• Access to sensor parameters that automatically allow software to process and geo‐
locate observations;
• Retrieval of real‐time or time‐series observations and coverages in standard
encodings
• Tasking of sensors to acquire observations of interest;
• Subscription to and publishing of alerts to be issued by sensors or sensor services
based upon certain criteria.
Figure 3 shows the role of SWE in an information infrastructure. SWE acts like a
middleware between the physical sensor networks and the software clients operated by final users. It can also be seen in this figure that the term “sensor” is not only applied to physical
sensors but can be also applied to observation archives, simulations, and observation
processing algorithms (OGC, 2008).
2.2.1
Services
and
Encodings
SWE includes several implementation specifications and best practices papers defining
services and encodings. Implementation specifications for encodings are (OGC, 2007g): • Observation & Measurement Schema (O&M): It defines standard models and XML
schemata for encoding observations and measurements from a sensor, both archived and real‐time. (OGC, 2007).
Fig. 3: SWE framework context (OGC, 2008)
• Sensor Model Language (SensorML): It defines standard models and XML schemata
for describing sensors systems and processes; provides information needed for
discovery of sensors, location of sensor observations, processing of low‐level sensor observations, and listing of taskable properties (OGC, 2007b).
• Transducer Markup Language (TransducerML or TML): It defines the conceptual
model and XML schemata for describing transducers and supporting real‐time
streaming of data to and from sensor systems (OGC, 2007d). Implementation specifications for services are (OGC, 2007g):
• Sensor Observations Service (SOS): Standard web service interface for requesting,
• Sensor Planning Service (SPS): Standard web service interface for requesting user‐
driven acquisitions and observations. This is the intermediary between a client and a sensor collection management environment (OGC, 2007c).
Best practices papers specifying services are (OGC, 2007g):
• Sensor Alert Service (SAS): Standard web service interface for publishing and
subscribing to alerts from sensors (OGC, 2007a).
• Web Notification Services (WNS): Standard web service interface for asynchronous
delivery of messages or alerts from SAS and SPS web services and other elements of service workflows (OGC, 2007e).
All these services and encodings working together enable Internet‐accessible sensors to be accessed and possibly controlled via Web. The vision is the construction of the “Sensor
Web”, a collaborative, coherent, consistent, and consolidated sensor data collection, fusion,
and distribution system for monitoring spatio‐temporal phenomena appearing in the
physical environment in real time (OGC, 2008). XML encodings provides standard formats for exchanging information regarding sensors. This information can be interpreted and used by any client implementing the specification without knowing low‐level details of the actual
sensor network. The service specifications provide standard interfaces for exchanging the
aforementioned information, giving the users a broad set of tools for building sophisticated systems.
From all the specifications only O&M, SensorML, and SOS are relevant for the work we
are presenting here. In subsequent sections they are explained in further detail.
2.2.2
Typical
workflows
In this section we present some of the SWE typical workflows. A subset of the workflows introduced in (OGC, 2008) is discussed below to illustrate the general functioning of the SWE building blocks relevant to our work.
Request
of
discrete
observation
data
Requesting discrete observation data is one of the most used functionalities provided by
SWE framework. Data about sensor observations is published by some data producer in a
SOS server. Then, SOS client connects to the server and reads some of this data. Figure 4
shows a sequence diagram illustrating this workflow. First, the client must send a
GetCapabilities request to the server to know for sure which data is published on it. After
that, the client sends a GetObservation request specifying the specific information to be
retrieved. The response to this request is a XML file in O&M format.
Fig. 4: SOS client requesting observation’s data from a server (OGC, 2008)
Request
of
streaming
(out
of
band)
observation
data
Streaming data can be accessed through an SOS server in two ways: using the GetResult
SOS operation or by connecting directly to the real source using a hyperlink returned from
the server. In neither case the observation data is returned inline within the GetObservation
operation’s response. Figure 5 shows how this works when the information is read from the source. First, the client must send a GetCapabilities request to the server. Next, the client
sends a GetObservation request specifying the specific information to be retrieved. The
request, the client reads the information from the SOS server sending GetResult request in a
continuous way until all the data has been read.
Fig. 5: SOS client accessing streaming data from the source (OGC, 2008)
Access
to
Sensor
Descriptions
Sensor descriptions in SensorML format can be accessed from the client in a similar way as the observations (Figure 6). After doing the GetCapabilities request, a DescribeSensor
request is sent to the server specifying an identifier for the sensor we want information
about. The SensorML descriptions of every sensor were previously stored in some kind of
data storage associated to the SOS server.
2.2.2
SWE
Common
All SWE schemata and services share common data types and data encodings defined in a single namespace are called SWE Common. SWE Common provides data types and related components that fall in the following categories (OGC, 2007b):
• Primitive data types, complementing those implemented in GML
• General purpose aggregate data types, including records, arrays, vectors and
matrices
• Aggregate data types with specialized semantics, including position, curve, and
time‐aggregates
• Standard encodings to add semantics, quality indication and constraints to both
primitive and aggregate types
• Specialized components to support semantic definitions, as required above
• A notation for the description of XML and non‐XML array encodings.
2.2.3
O&M
implementation
specification
As mentioned before O&M defines standard models and XML schemata for encoding
observations and measurements from a sensor, both archived and real‐time. Most of the
concepts included in this specification are defined in the following paragraph taken from (OGC, 2007):
“An observation is an act associated with a discrete time instant or period through which a
number, term or other symbol is assigned to a phenomenon [FOW1998]. The phenomenon is a property of an identifiable object, which is the feature of interest of the observation. The
observation uses a procedure, which is often an instrument or sensor [NRC1995] but may be a
process chain, human observer, an algorithm, a computation or simulator. The key idea is
that the observation result is an estimate of the value of some property of the feature of
interest, and the other observation properties provide context or metadata to support
evaluation, interpretation and use of the result.”2
Fig. 7: Basic Observation Model (OGC, 2007)
In this paragraph the definitions for observation, property, feature of interest, procedure and result in which the Observation Model is based are clearly stated. These definitions and their
relationships are shown in an UML diagram in Figure 7. As can be seen in the figure, an
Observation is related with:
• A feature of interest: feature of any type representing the real world object which
is the observation target. Note that as an Observation object can be related with a single feature of interest, a feature of interest can be related to, or be the real world object associated with, several Observation objects (OGC, 2007).
• An Observed property: identifies or describes the phenomenon for which a value
• A procedure: description of a process used to generate the result. It must be
suitable for the observed property (OGC, 2007).
• A result: contains the value generated by the procedure. The type of the
observation result must be consistent with the observed property, and the scale
or scope for the value must be consistent with the quantity or category type (OGC, 2007).
O&M defines several specializations of the generic observation. For single‐value
properties, the corresponding observation result is a scalar, or a record whose components
correspond to a thematic decomposition of the observed property. These properties ca be
modelled as (OGC, 2008) (OGC, 2007):
• CountObservation, if the result is an integer representing the count of the
observed property
• CategoryObservation, if the result is a textual value from a controlled vocabulary
• TruthObservation, if the result is a boolean value representing the truth value
(usually existence) of the observed property • GeometryObservation, if the result is a geometry
• TemporalObservation, if the result is a temporal object
• ComplexObservation, if the result is a record representing a multi‐component
phenomenon
• Measurement, if the result is a Measure, i.e. the result is a value described using a
numeric amount with a scale or using a scalar reference system
If the values of the property vary over time and/or space, then the observation‐type is modeled as discrete coverages of the following types (OGC, 2008) (OGC, 2007):
• PointCoverageObservation, if the result is a point coverage which samples prop‐
erties at points in the feature of interest,
• DiscreteCoverageObservation, if the result is a generalized discrete coverage
• TimeSeriesObservation, if the result is a time‐instant coverage which samples a
• ElementCoverageObservation, if the result is a coverage whose domain elements
contain references to objects encoded elsewhere, which provide the sampling
geometry of the feature of interest
Finally, observations can be aggregated into Observation collections when certain
conditions of homogeneity for a group of observations exist, such as: having the same
feature of interest, the same sampling time and different observed properties; or having the same feature of interest, the same observed property and different sampling time.
2.2.4
SensorML
implementation
Specification
SensorML defines standard models and XML schemata for describing sensors systems
and processes; provides information needed for discovery of sensors, location of sensor
observations, processing of low‐level sensor observations, and listing of taskable properties
(OGC, 2007b). This language, although an important component of SWE can be used
independently to describe any sensor system, as well as the processes that might be
associated with it. According to (OGC, 2007b), the purposes of SensorML are to:
• Provide descriptions of sensors and sensor systems for inventory management
• Provide sensor and process information in support of resource and observation
discovery
• Support the processing and analysis of the sensor observations
• Support the geolocation of observed values (measured data)
• Provide performance characteristics (e.g., accuracy, threshold, etc.)
• Provide an explicit description of the process by which an observation was
obtained (i.e., it’s lineage)
• Provide an executable process chain for deriving new data products on demand
(i.e., derivable observation)
• Archive fundamental properties and assumptions regarding sensor systems
One of the main concepts in SensorML is process, which defines inputs, outputs,
parameters, and a method for that process, as well as a collection of metadata useful for discovery and user assistance. In SensorML, all elements are modelled as processes. This
processors, sensors and sensor platforms (OGC, 2007b). Sensor systems are modelled as a collection of physical and non‐physical processes. The first category applied to physical
processes such as detectors, actuators and sensor systems. These processes have some
relationship with space and time. The second category includes processes that can be
modelled by mathematical operations.
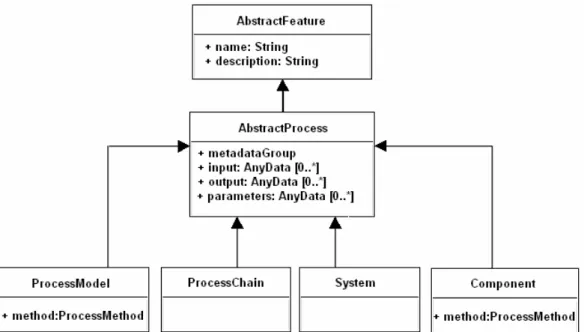
Figure 8 is a class diagram showing the main type relationships between the main
SensorML concepts. All processes are derived from the AbstractProcess class which have
among its fields the input and output “ports” for exchanging data with exterior entities. The subclasses of AbstractProcess are (OGC, 2007b):
Fig. 8: Conceptual model for Processes (OGC, 2007b)
• ProcessModel: it defines non‐physical processes used to build more complex
processes.
• ProcessChain: a collection of processes that executed sequentially produce a
result. A process chain may contain zero or more physical of non‐physical
processes. It is built using the Composite design pattern (Gamma et al., 1995); therefore it can be included inside other process chains.
• Component: Physical process that cannot be subdivided into smaller sub‐
• System: physical equivalent of a ProcessChain. It is also implemented using the
Composite design pattern.
The metadata describing processes includes identifiers, classifiers, constraints (time, legal, and security), capabilities, characteristics, contacts, and references, in addition to inputs, outputs, parameters, and system location (OGC, 2008) (OGC, 2007b).
2.2.5
SOS
implementation
Specification
The SOS specification provide access to observations from sensors and sensor systems in a
standard way that is consistent for all sensor systems, including remote, in‐situ, fixed and
mobile sensors (OGC, 2007g). The information exchanged between SOS clients and servers
follows the O&M specification for observations and the SensorML specification for sensors
or system of sensors descriptions.
The main goal of SOS is to provide access to observations, which are grouped into Observation offerings. An observation offering is a set of related observations that follow some criteria. Unfortunately, the specification does not provide a more precise definition or any clear guidance on this grouping. The only clue provided is that classifiers must be factored into offerings in such a way that in response to a GetObservation request the
likelihood of getting an empty response for a valid query should be minimized (OGC,
2007g).
The offerings are constrained by the following parameters (OGC, 2007g):
• Specific sensor systems that report the observations,
• Time period(s) for which observations may be requested (supports historical
data),
• Phenomena that are being sensed,
• Geographical region that contains the sensors, and
• Geographical region that contains the features that are the subject of the sensor
observations (may differ from the sensor region for remote sensors)
The SOS implementation specification defines three operation profiles: core profile
operations needed for any data consumer to access sensor observations stored in an SOS
server. GetCapabilities is an operation that is common for all the OGC’s web services, and as
such is defined in (OGC, 2007f). The operation allows clients to access metadata about the
capabilities provided by the server. The DescribeSensor operation allows SOS clients to
retrieve SensorML or TML description of a given sensor specified as parameter of the
operation. The GetObservation operation is used to retrieve observation data from the server.
Several parameters for filtering the observations must be supplied.
The transactional profile offers support for data producer. Using the supplied operations
RegisterSensor and InsertObservation, a data producer can register its sensor systems and
insert the observations produced by them into the server. Later, clients can read this
information using the core profile operations.
The third and last profile is the enhanced profile, which provides clients with a richer
interface for interacting with the server. The operations are GetResult, and allows clients to
obtain sensor data repeatedly without having to send and receive requests and responses
that largely contain the same data except for a new timestamp; GetFeatureOfInterest returns a
featureOfInterest that was advertised in one of the observation offerings of the SOS
capabilities document; GetFeatureOfInterestTime returns the time periods for which the SOS
will return data for a given advertised feature of interest; DescribeFeatureOfInterest returns
the XML schema for a given feature; DescribeObservationType returns the XML schema that
describes the Observation type that is returned for a particular phenomenon; and
DescribeResultModel returns the schema for the result element that will be returned when the
client asks for the given result model by the given ResultName.
2.3
Known
SWE
implementations
(52North, 2009) and University of Alabama in Huntsville (UAH VAST, 2009). More details about these implementations are provided in the following sections. Another popular server implementation of the SOS 1.0.0 specification is included in MapServer (Mapserver, 2008), a
very popular open source platform for publishing spatial data and interactive mapping
applications to the web.
2.3.1
52°
North’s
SWE
implementation
52°North Initiative is an international research and development company for developing open source geo‐software for research, education, training and practical use (52North, 2009).
One of its core communities is the Sensor Web Community. This community is focused on
development of SWE services and encodings. They have developed implementations of all
the services and encodings specifications within SWE. In addition to this, they have
developed the OX‐Framework, providing a client architecture where the information of all kind of OGC Services can be accessed, visualized and integrated.
2.3.2
UAH
VAST’s
SWE
implementation
The VisAnalysis Systems Technologies (VAST) Team, from The University of Alabama in
Huntsville (UAH), works on research and development on visualization and analysis,
as well as standard web‐based technologies (UAH VAST, 2009). This team has developed
multiple tools related with SWE specifications, most of them specialized in working with
SensorML. In our opinion the most relevant ones are the SensorML Processing Engine,
which allows for the execution of process chains obtained from SensorML documents; and
the Space Time Toolkit (STT), which provides capabilities for integrating spatially and
temporally‐disparate data in a highly interactive 3D display environment (UAH VAST,
2009a). Data retrieved from different OGC services including SOS can be handled and
2.4
Some
projects
using
SWE
At present, several projects using SWE related technologies exist in different parts of the world. Some of these projects are listed below:
• Marine Metadata Interoperability (MMI) project and OOSTethys: The MMI is a
project for promoting the exchange, integration and use of marine data through
enhanced data publishing, discovery, documentation and accessibility (Marine
Metadata Interoperability, 2009). Within this project OOSTethys (OOSThetys,
2008) is a provider‐to‐user data system framework, using interoperable standards, enabling discovery and use of data. OOSTethys allows a data provider to setup an OGC Sensor Observation Service with minimal effort.
• OSIRIS (Open architecture for Smart and Interoperable networks in Risk
management based on In‐situ Sensors): is one of the GMES’ supporting projects.
GMES (Global Monitoring for Environment and Security) is a European initiative which will provide us with the tools to improve our environment and will help us
keep our planet safe and healthy (GMES, 2008). OSIRIS provides a Service
Oriented Architecture based on standards and delivers functions ranging from in‐ situ earth observation to user services (OSIRIS, 2009).
• SANY IP (Sensors Anywhere Integrated Project): This project focuses on
interoperability of in‐situ sensors and sensor networks. The project’s aim is to
deliver a standard SOA for environmental sensor networks, reference
implementations of re‐usable sensor‐ and domain‐agnostic services, and three risk management applications covering the areas of air pollution, marine risks and geo hazards (SANY, 2009).
• Advanced Fire Information Service: is a near real‐time operational satellite fire
monitoring system. Its main goal is assisting in the prediction, detection and assessment of fires using Remote Sensing and GIS technology. It is part of the
Wide Area Monitoring Information Service (WAMIS) which delivers relevant
sensor based information for supporting decision‐making in the monitoring of the
2.5
Summary
In this chapter, we presented a general introduction to the topic of sensor networks. We
introduced the main concepts such as sensors networks and their advantages over
traditional sensor platforms; sensor nodes and their components; and examples of fields
where these networks have been applied. We also introduced the Sensor Web Enablement
initiative and presented an introduction to the specifications that are relevant to our work.
Finally, we mentioned some known implementations and projects applying SWE.
3
GV
SIG
gvSIG3 is an open source tool designed for managing geographic information. This tool
provides support for common data formats, including vector and raster spatial data, remote
spatial databases, and standard OGC web services. gvSIG allows for the combination of
geospatial data with different formats and from different sources in a single view. gvSIG is
developed using Java under the GNU General Public License (GPL). In this chapter we
present a general description of the gvSIG architecture and the plug‐in model used to add
new functionality in the form of extensions. Its name is an abbreviation of ”Generalitat Valenciana, Sistema dʹInformació Geográfica” (gvSIG, 2008).
3.1.
Architecture
gvSIG is built using a plug‐in model where functionality can be added to a generic
framework called ANDAMI. ANDAMI is an extensible framework for building Multiple
Documents Interface (MDI) applications, which can be customized for different kinds of
applications. ANDAMI starts the application and then loads a group of previously
registered plug‐ins, which provides the domain‐specific behaviour. ANDAMI also assists
plug‐ins with a set of services such as user interface initialization, windows management and internalization support.
The GIS‐specific behaviour is added to the application by the three main subsystems
(gvSIG, 2008a):
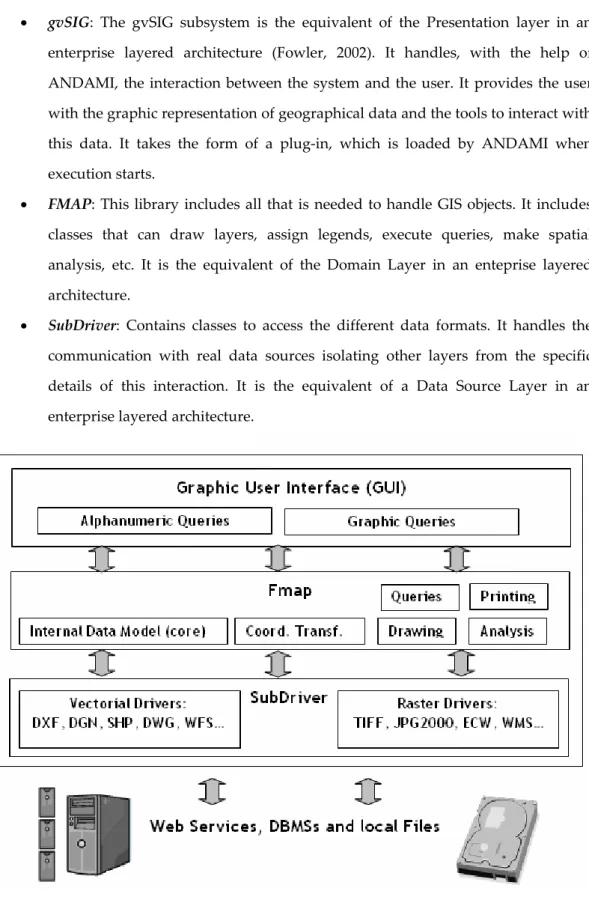
• gvSIG: The gvSIG subsystem is the equivalent of the Presentation layer in an
enterprise layered architecture (Fowler, 2002). It handles, with the help of
ANDAMI, the interaction between the system and the user. It provides the user
with the graphic representation of geographical data and the tools to interact with
this data. It takes the form of a plug‐in, which is loaded by ANDAMI when
execution starts.
• FMAP: This library includes all that is needed to handle GIS objects. It includes
classes that can draw layers, assign legends, execute queries, make spatial
analysis, etc. It is the equivalent of the Domain Layer in an enteprise layered architecture.
• SubDriver: Contains classes to access the different data formats. It handles the
communication with real data sources isolating other layers from the specific
details of this interaction. It is the equivalent of a Data Source Layer in an enterprise layered architecture.
Figure 9 shows all these components and their interconnections. The general functioning of the system can be explained in a few words: the drivers are responsible for accessing the
data sources, reading and/or writing spatial data stored in different formats. Vectorial
drivers transforms GIS entities retrieved from the data source to objects of the internal data
model. The FMAP module performs operations using this data such as: drawing layers,
executing alphanumeric and graphic queries, making spatial analysis or transforming
coordinates between the different reference systems. Finally, the GUI module handles the
user interaction through user interface elements. (gvSIG, 2008a)
In the following sections we provide a more detailed explanation of the four main
components of gvSIG: the gvSIG subsystem4, FMAP, SubDriver and ANDAMI.
3.1.1
The
gvSIG
Subsystem
As mentioned before, the gvSIG subsystem handles the interaction between the system and
the user. It provides the user with the graphic representation of geographical data and the
tools to interact with this data.
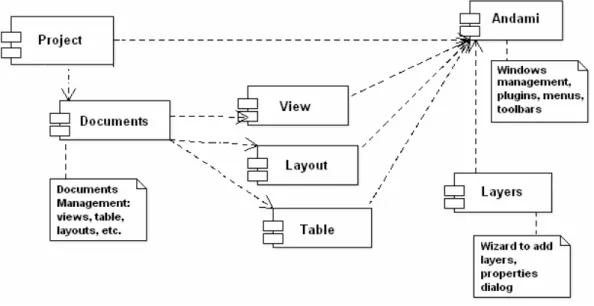
Fig. 10: Component diagram of the gvSIG subsystem (gvSIG, 2008a)
4 Note that the main subsystem has the same name as the application; this may sometimes
Figure 10 shows the main components of this subsystem, which we explain next: (gvSIG, 2008a):
• Project: Container of the document structure opened at a given time. It may
contain several documents of different types in addition to general information such as project name, location or date.
• Documents: Different document types supported by the application. Current
supported document types are: Views, Tables and Layouts. It also provides
extension points for new document types.
• Views: Contains the graphical representation of geospatial information and its
corresponding legend (TOC5).
• Tables: Tabulated representation of alphanumeric data related with the geospatial
information contained on the project
• Layouts: Representation of a view in a printer friendly format.
• Layers: User interface elements utilized to add a new layer to the current view.
Although we do not consider ANDAMI as part of this subsystem, it is shown in the figure to illustrate its relationships with the rest of the components.
3.1.2
The
Fmap
Subsystem
Fmap is the GIS engine of the gvSIG application. It provides the internal model used to
represent geospatial data and it provides the main operations to process and display such
data. It is implemented as an independent library that can be reused in other projects. The
main component in this library is MapControl, in charge of storing, handling and displaying
the geospatial information.
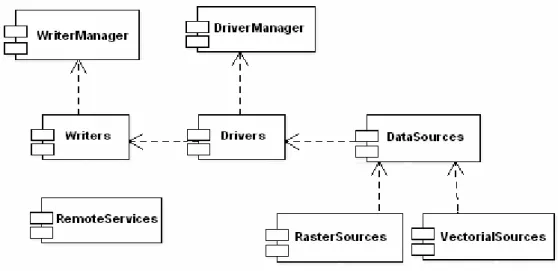
Figure 11 shows the main components contained in Fmap. A short description of the
components is provided next (gvSIG, 2008a):