267
Reef fish community structure on three islands of Itaipu, Southeast Brazil
José Policarpo de Mendonça-Neto, Cassiano Monteiro-Neto and Luiz Eduardo Moraes
We provide here the first assessment of the composition, abundance and distribution of rocky reef fishes of Itaipu Sound, Rio de Janeiro, off the southeastern Brazilian coast. Monthly visual censuses, benthic quadrats and chain link transects were conducted over one year on rocky reefs at three islands (Menina, Mãe and Pai). A total of 2466 individual fish, belonging to 29 families and 42 species were recorded. The most abundant fish species were Parablennius pilicornis, Haemulon steindachneri, Orthopristis ruber and Diplodus argenteus. Sheltered and complex habitats showed the most abundant and diverse fish populations. There was a major significant separation between sampling sites and a secondary seasonal pattern. The three sites showed similar fish communities with locally structured environmental gradients according to their inherent habitat characteristics.
Apresentamos aqui o primeiro estudo da composição, abundância e distribuição de peixes recifais nos recifes rochosos da enseada de Itaipu, Rio de Janeiro, Brasil. Foram realizados mensalmente censos visuais, quadrats de composição bentônica e transectos com correntes durante um ano em recifes rochosos de três ilhas (Menina, Mãe e Pai). Um total de 2466 peixes pertencentes a 29 famílias e 42 espécies foi registrado. Os peixes mais abundantes foram Parablennius pilicornis, Haemulon steindachneri,Orthopristis ruber e Diplodus argenteus. Os recifes mais abrigados e com maior complexidade de hábitats foram os que apresentaram maior abundância e diversidade de espécies. Análises estatísticas revelaram distinções significativas entre as áreas amostradas e um padrão sazonal secundário. As três áreas apresentaram basicamente a mesma comunidade de peixes, estruturadas a partir de gradientes ambientais e de características estruturais próprias de cada ilha.
Key words: Rocky reef fishes, Habitat complexity, Benthic biota.
Laboratório de Biologia do Nécton e Ecologia Pesqueira, Programa de Pós Graduação em Biologia Marinha, Departamento de Biologia Marinha, Universidade Federal Fluminense, Cx Postal 100644, 24001-970 Niterói, RJ, Brazil. [email protected] (JPM)
Introduction
Most studies about the community ecology of Brazilian reef fishes began in the late 1990s, and applied underwater visual census techniques (Rosa & Moura, 1997; Rocha et al., 1998; Ferreira et al., 1998; Rocha & Rosa, 2001). These stud-ies were conducted at several sites throughout the tropical and subtropical Brazilian coastline, from below the mouth of the Amazon River at the Manuel Luiz Reefs (0o52’ S) (Rocha & Rosa, 2001), to the south to Santa Catarina State (27o30’ S) (Floeter et al., 2001).
On the southeastern Brazilian coastline, rocky shores com-prise the habitat for reef fishes and other reef-associated biota (Floeter et al., 2004; Rangel et al., 2007). Despite an overall lower complexity when compared to coral reefs, rocky reefs are characterized by a high fish diversity and endemism (Ferreira et al., 2001; Rocha, 2003). Considering the continen-tal dimension of the Brazilian coast (almost 8000 km), a limited set of scientific works on the ecology and community
struc-ture of reef fishes is currently available.
Differences in reef fish communities can be found along geographic gradients (Parrish, 1989; Sale, 1991; Joyeux et al., 2001) and distinct reef types (Ebeling & Hixon, 1991; Ferreira
et al., 2001; Bellwood & Wainwright, 2002). Patterns of occur-rence and distribution of these assemblages often vary over space and time, influenced by a set of integrated physical and biological factors (McCormick, 1989; Syms & Jones, 2000; Acosta & Robertson, 2002). Wave exposure, water depth and topographic complexity may exert variable degrees of inter-ference upon many ecological processes, such as recruitment, predation and territoriality (Caley, 1993; Cheney & Côté, 2003; Kawasaki et al., 2003).
Materials and Methods
Study Site.
This study was carried out on three islands of Itaipu Sound, Niterói, RJ, Brazil (22°58’S; 43°02’W) from April 2002 to March 2003. Menina Island, Mãe Island and Pai Island are, respectively, 1 km, 2.5 km and 4.2 km off the Brazilian coast. Pai Island is the farthest and most exposed study site. We selected one sampling station located on the sheltered face of each island (Fig. 1). This selection was based on water visibility and diving conditions which could enable surveys to be conducted throughout the year.
Environmental variables and benthic biota.
At each site, we measured water visibility (Secchi disk), water temperature at diving depth (°C, mercury thermometer) and site rugosity using the chain method (Luckhurst & Luckhurst, 1978) as an index of habitat complexity. Benthic organisms were pooled into ecological and morpho-functional groups: grazers (black and purple sea urchins), sessile con-structive (mussels, oyster and barnacles), mobile (gastropoda, sea cucumbers and star fish) and sessile (anemones, turf al-gae and bryozoans). Individual counts and percent coverage were conducted on replicate 1-m² aluminum squares (quad-rats) at different points within the same area where visual censuses for reef fishes were performed.
Reef fish community.
Reef fish community was assessed through 20 m x 2 m underwater strip transects (40 m2), varying from the shallow-est zones to the bottom rocky/sand interface, about 6-9 meters deep. All sites were visited once a month, and censuses were conducted within the same day between 8:00 and 12:00, start-ing at Pai Island and finishstart-ing at Menina Island. We con-ducted a total of 108 transects, 36 on each site. Fish counts were conducted in a slow constant swimming velocity (Russ & Gladstone, 1990) and performed by the same observer (J. P. Mendonça-Neto). Sighted fishes were identified and counted,
and the information was recorded on a PVC plate (Williams, 1982). Afterwards, fish count data were expressed as fre-quency of occurrence and relative abundance.
Statistical analysis.
Renyi´s graphic ordination method was used to check if species diversity was comparable between sites (Hill, 1973; Legendre & Legendre, 1998). According to the method, when diversity patterns are parallel to each other, species diversity may be compared, but when diversity patterns cross each other, no comparisons are possible. Differences among aver-age diversity were statistically tested with bootstrapping fol-lowing the model proposed by Solow (1993). The Species Diversity & Richness v.2.3 software was used for all proce-dures (Henderson & Seaby, 1998).
Multivariate analysis of the data including non-metric multidimensional scaling (nMDS) and analysis of similarities (ANOSIM) was performed with PRIMER 5 software (Primer-E 2000). Both procedures used a Bray–Curtis similarity matrix. MDS is a 3-dimensional ordination of samples brought down to a 2-dimensional plot. The quality of the plot is indicated by its stress value: values <0.2 give a potentially useful 2-dimen-sional picture, stress <0.1 corresponds to a good ordination, and stress <0.05 is an excellent representation. The ANOSIM significance test compares similarities between species by sample matrices. The global R indicates the degree of similar-ity between the tested groups, with values between –1 and 1. If all replicates within sites are more similar to each other than any replicate from different sites, the value of R is 1; values close to zero indicate that the similarity between sites is very high. A two-way crossed analysis of ANOSIM was performed with the original data, where no transformation or standard-ization was conducted (Clarke & Warwick, 1994).
The relationship between fish community and environ-mental variables (water visibility, temperature, bottom com-plexity and benthic coverage) was investigated by canonical correspondence analysis (CCA) (Legendre & Legendre, 1998). The primary matrix consisted of abundance data of fish spe-cies (row) per sample (column), and the secondary matrix en-vironmental consisted of data including the variables previ-ously mentioned and the relative abundance of benthic cov-erage data. Monte Carlo permutation tests were employed to determine the statistical significance of the main correlations, and their relative contribution to the final model. Only statis-tically significant variables were maintained. A similar proce-dure was applied to determine the statistical significance of the first four canonical axes. This analysis was entirely per-formed on CANOCO for Windows 4.0 (ter Braak & Smilauer, 1998).
Results
A total of 2446 fishes from 29 families and 42 species were recorded through visual censuses at the three sites during the survey (Tab. 1). Parablennius pilicornis was the most abundant species in all sites pooled, followed by Haemulon Fig. 1. Map of Itaipu Sound, showing the three study sites:
Table 1. Fish families, species, symbols, number of individuals (n) and relative abundance (%) at each site (Pai, Mãe, and Menina Islands) and pooled for all sites (Total).
Table 2.Summary of fish community (means ± standard deviation), habitat complexity and benthic composition (relative percent abundance) plus ANOVA results among sites. * Significant difference.
Pai Island Mãe Island Menina Island Total
Family Species Symbol n % n % n % nT %T %F
Acanthuridae Acanthurus chirurgus ACACHI 5 0.65 11 1.03 8 1.26 24 0.97 22.2
Ariidae Bagre spp. BAGSPP 0 0.00 4 0.38 0 0.00 4 0.16 5.6
Belonnidae Hemiramphus spp. HEMSPP 0 0.00 9 0.85 0 0.00 9 0.36 8.3
Blennidae Parablennius pilicornis PARPIL 147 19.09 182 17.12 159 25.12 488 19.79 80.5
Blennidae Scartella cristata SCACRI 25 3.25 10 0.94 8 1.26 43 1.74 52.7
Blennidae Parablennius spp. PARSPP 6 0.78 3 0.28 1 0.16 10 0.41 13.8
Bothidae Bothus ocellatus BOTOCE 0 0.00 11 1.03 0 0.00 11 0.45 16.6
Carangidae Caranx spp. CARSPP 1 0.13 2 0.19 30 4.74 33 1.34 8.3
Carangidae Pseudocaranx dentex PSEDEN 5 0.65 5 0.47 0 0.00 10 0.41 16.6
Chaetodontidae Chaetodon striatus CHASTR 16 2.08 45 4.23 41 6.48 102 4.14 80.5
Chaetodontidae Chaetodon sedentarius CHASED 0 0.00 0 0.00 3 0.47 3 0.12 2.8
Dactylopteridae Dactylopterus volitans DACVOL 41 5.32 66 6.21 44 6.95 151 6.12 86.1
Diodontidae Chylomicterus spinosus CHYSPI 5 0.65 21 1.98 0 0.00 26 1.05 36.1
Diodontidae Diodon hystrix DIOHYS 0 0.00 0 0.00 1 0.16 1 0.04 2.8
Gerreidae Eucinostomus spp. EUCSPP 7 0.91 9 0.85 0 0.00 16 0.65 13.8
Haemulidae Haemulon steindachneri HAESTE 131 17.01 77 7.24 61 9.64 269 10.91 83.3
Haemulidae Orthopristis ruber ORTRUB 119 15.45 74 6.96 67 10.58 260 10.54 86.1
Haemulidae Anisotremus virginicus ANIVIR 5 0.65 1 0.09 0 0.00 6 0.24 13.8
Holocentridae Myriprists jacobus MYRJAC 0 0.00 2 0.19 0 0.00 2 0.08 2.8
Labridae Halichoeres poeyi HALPOE 6 0.78 38 3.57 2 0.32 46 1.87 41.6
Labridae Halichoeres dimidiatus HALDIM 0 0.00 9 0.85 0 0.00 9 0.36 8.3
Labrisomidae Labrisomus nuchipinnis LABNUC 1 0.13 14 1.32 7 1.11 22 0.89 38.8
Labrisomidae Malacoctenus spp. MALSPP 0 0.00 0 0.00 4 0.63 4 0.16 2.8
Lutjanidae Lutjanus spp. LUTSPP 0 0.00 6 0.56 3 0.47 9 0.36 11.1
Monacanthidae Stephanolepis hispidus STEHIS 57 7.40 54 5.08 37 5.85 148 6.00 88.8
Mullidae Pseudupeneus maculatus PSEMAC 11 1.43 32 3.01 6 0.95 49 1.99 47.2
Muraeneidae Gymnothorax spp. GYMSPP 0 0.00 5 0.47 0 0.00 5 0.20 8.3
Pomacanthidae Pomacanthus paru POMPAR 0 0.00 4 0.38 1 0.16 5 0.20 11.1
Pomacentridae Abudefduf saxatilis ABUSAX 29 3.77 91 8.56 2 0.32 122 4.95 52.7
Pomacentridae Chromis multilineata CHRMUL 38 4.94 26 2.45 3 0.47 67 2.72 41.6
Pomacentridae Stegastes fuscus STEFUS 1 0.13 4 0.38 21 3.32 26 1.05 25.0
Priacanthidae Heteropriacanthus cruentatus HETCRU 0 0.00 2 0.19 0 0.00 2 0.08 2.8
Scaridae Sparisoma axillare SPAAXI 0 0.00 8 0.75 0 0.00 8 0.32 11.1
Scianidae Pareques acuminatus PARACU 12 1.56 24 2.26 2 0.32 38 1.54 44.4
Scorpaenidae Scorpaena spp. SCOSPP 0 0.00 1 0.09 1 0.16 2 0.08 5.6
Serranidae Mycteroperca acutirostris MYCACU 10 1.30 22 2.07 3 0.47 35 1.42 50.0
Serranidae Epinephelus marginatus EPIMAR 4 0.52 21 1.98 3 0.47 28 1.14 36.1
Sparidae Diplodus argenteus DIPARG 62 8.05 88 8.28 49 7.74 199 8.07 83.3
Sparidae Pagrus pagrus PAGPAG 0 0.00 6 0.56 0 0.00 6 0.24 2.8
Synodontidae Synodus spp. SYNSPP 0 0.00 4 0.38 1 0.16 5 0.20 11.1
Tetraodontidae Sphoeroides spengleri SPHSPE 26 3.38 66 6.21 65 10.27 157 6.37 83.3
Tetraodontidae Sphoeroides greeleyi SPHGRE 0 0.00 6 0.56 0 0.00 6 0.24 8.3
Total 770 100 1063 100 633 100 2466 100
Pai (P) Mãe (M) Menina (Me)
Fish species richness (species per census) 11 ± 7.7 19 ± 6.3 10 ± 4.9 p<0.05* M≠P=Me Total number of fishes per census 64 ± 4 88 ± 7.6 53 ± 4.9 p<0.01* M≠P=Me Habitat complexity (chain link rugosity index) 1.24 ± 0.1 1.36 ± 0.09 1.17 ± 0.17 p<0.05* M≠P=Me
GRAZERS % % %
Black sea urchin - Echinometra lucunter 29.3 9.4 31.2 p<0.05* M≠P=Me
Purple sea urchin - Litechinus variegatus 15.2 10.9 13.7 p=0.2 M=P=Me SESSILE CONSTRUCTIVE
Mussel - Perna perna 3.8 5.6 22.1 p<0.01* M=P≠Me Oyster - Crassostrea spp. 2.9 - 13.1 p<0.05* M≠P≠Me
Barnacle - Balanus spp. 3.1 5.7 5.2 p<0.01* M=P=Me MOBILE
Sea cucumber - Isosthicopus badionatus 0.6 14.3 - p<0.01* M≠P=Me Star fish - Echinaster brasiliensis 3.1 1.8 - p=0.72 M≠P≠Me Sessile invertebrates - Gastropoda 2.3 2.9 - p=0.48 M=P≠Me SESSILE
steindachneri, Orthopristis ruber and Diplodus argenteus. Together, they comprised 49% of the total number of fishes recorded. Stephanolepis hispidus was the most frequent spe-cies at all sites, followed by Dactylopterus volitans and
Orthopristis ruber. The three sites sustained basically the same community of fish species, despite differences in abun-dance (Table 1). Fish species richness and total number of fishes per census were significantly higher at Mãe than at the Pai and Menina sites (Table 2). Reyni´s diversity showed that Mãe reached a significantly higher diversity when compared with Menina and Pai Islands (Fig. 2).
A total of 770 fishes belonging to 25 species of 17 families were sighted at Pai Island. The top three species in terms of relative abundance were Parablennius pilicornis, Haemulon steindachneri and Orthopristis ruber. Together they repre-sented 51% of all observations (Table 1). This site was char-acterized by a mean water visibility of 5.7 m and low habitat complexity; the greatest proportion of the benthic communi-ty was represented by grazers and turf algae (Table 2).
At Mãe Island, a total of 1063 fishes from 39 species and 27 families were recorded. Parablennius pilicornis, Abudefduf saxatilis and Diplodus argenteus were the most abundant species, totaling 34% of the local abundance (Table 1). This site showed the best water visibility, varying between 6 and 12 m, and the highest habitat complexity. Turf algae and gas-tropod mollusks had the greatest abundance among mem-bers of the benthic community (Table 2).
Menina Island showed intermediate species richness and the lowest overall abundance (633 fishes from 28 species and 21 families). Parablennius pilicornis, Orthopristis ruber and the Sphoeroides spengleri were the most abundant species and accounted for 46% of the total sightings at this site (Tab. 1). Menina Island was characterized by the lowest water vis-ibility, with a mean of 4.6 m, often at the technical limits for visual census, and lowest habitat complexity. Grazers and sessile constructive organisms dominated the benthic com-munity (Table 2).
Multidimensional scaling revealed an apparent pattern of separation between sampling sites, with Mãe clearly differ-ing from both Pai and Menina Islands. A secondary seasonal pattern was less evident, suggesting a separation between
summer and winter samples (Fig. 3).
The two-way analysis of similarities (ANOSIM) further indicated that significant spatial differences were predomi-nant, nevertheless with some degree of overlapping between factor levels. Pairwise tests showed that Mãe and Menina Islands were significantly different from each other. Differ-ences between Mãe and Pai Islands and Pai and Menina Is-lands were less evident. Seasonal analysis was also signifi-cant, but results were less conclusive due to the high degree of overlapping between factor levels. Pairwise comparisons suggested that summer samples were significantly discern-ible from a pooled group of fall – spring samples (Table 3).
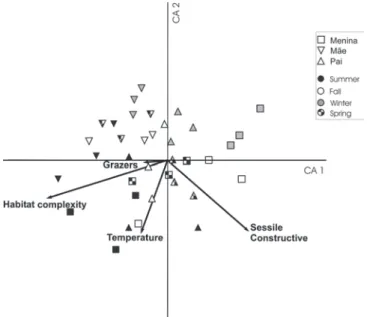
Results from the CCA analysis yielded a total explained variance of 15.1 % at the first two canonical axes. Significant relationships between species distribution and environmen-tal variables were restricted to four variables including bot-tom complexity, water temperature, percent cover of grazers and sessile constructive organisms (Fig. 4). The first canoni-cal axis explained 8.5% of the total variance (Monte Carlo, p = 0.02) and was positively correlated with the ‘x’ component of
Fig. 2. Renyi´s diversity ordination scale parameter compar-ing Menina, Mãe and Pai Islands.
Fig. 3. Nonmetric multidimensional scale (nMDS) analysis of individual samples from Menina, Mãe and Pai Islands indi-cating a Summer – Winter seasonal gradient.
Table 3. Results of the two-way crossed analysis of similarity considering sites (Menina, Mãe and Pai Islands) and sea-sons (fall, winter, spring and summer) as the main effects.
Factors R Statistic Significance
Sites
Global 0.461 0.001
Pairwise Comparisons
Pai vs Mãe 0.407 0.006
Pai vs Menina 0.269 0,011
Mãe vs Menina 0.694 0.001
Season
Global R 0.305 0.001
Pairwise Comparisons
Fall vs Winter 0.247 0.005
Fall vs Spring 0.049 0.347
Fall vs Summer 0.296 0.058
Winter vs Spring 0.370 0.006
Winter vs Summer 0.580 0.007
sessile constructive benthic organisms, and negatively cor-related with grazers and the ‘x’ component of both bottom complexity and water temperature. The second axis explained 6.6% of the total variance (Monte Carlo, p = 0.02) and showed a negative correlation with the ‘y’ projection of all variables (Figs. 4 and 5).
Samples from Mãe Island were mostly separated from the other two sites in the two- dimensional canonical space, were
negatively associated with the presence of sessile construc-tive organisms, and partly associated with the ‘x’ component of bottom complexity. Separation between samples from the Pai and Menina Island sites was less evident, but a seasonal gradient was apparent, with a tendency of winter samples to occur on the positive side of the canonical axis 2. Summer samples though followed the water temperature vector in the canonical space (Fig. 4).
Most species clustered in the middle of the diagram indi-cating a weak association with both principal axes. Neverthe-less, Acanthurus chrirurgus, Diodon Hystrix, Caranx spp. and Scorpaena spp. were associated with spring and sum-mer samples at Pai Island and correlated with the presence of the sessile constructive benthos. Bothus ocellatus,
Pomacanthus paru, Halichoeres poeyi, Myripristis jacobus,
Lutjanus synagris and Malacoctenus spp. were predominant in summer samples at Menina Island, whereas
Heteropriacanthus cruentatus, Parablennius spp.,
Halichoeres dimidiatus, Eucinostomus spp. were mostly as-sociated with Mãe Island samples (Fig. 5).
Discussion
Underwater censuses at Pai, Mãe and Menina Islands in Itaipu yielded a total of 42 species and 29 families. Our results suggest that our three study sites display low reef fish spe-cies diversity when compared to other sites where reef fish studies have been conducted in Brazil (e g., Floeter et al., 2001). Compared with lower latitude sites, these differences may be explained by the natural north-south latitudinal de-cline in species richness of reef fishes on the Brazilian coast, a consequence of regional environmental gradients and local processes (Rocha, 2003; Floeter et al., 2004). Also, due to geographic location, the studied site is potentially under the influence of water discharge from the Guanabara Bay (Mendonça Filho et al., 2003; Vilela et al., 2003). The contri-butions of low-salinity waters, high sediment loads, and pol-lution runoff derived from such a large body of water, may cause low species richness, as other authors have observed in similar habitats (Roberts & Hawkins, 1999; Silva & Araújo, 2003). In fact, such influences tend to be higher with strongly site-attached fish species, as most of the reef fishes are, than with species having a wider home range (Roberts & Ormond, 1987).
The most abundant species in our study sites were repre-sentative of the coastal rocky reef fish fauna of SE Brazil (Ferreira et al., 2001; Ferreira et al., 2004; Rangel et al., 2007). Species such as Haemulon steindachneri, Orthopristis ruber
and Diplodus argenteus are frequently captured by local artisanal fishers with hook and line or gill nets near the reefs (Tubino et al., 2007). The blenny, Parablennius pilicornis,
was the dominant species at all sites, probably reflecting the shallow and sheltered habitat characteristics (Schofield, 2003). Nevertheless, the low density and absence of natural preda-tors, such as groupers and large piscivores, may probably lead to a greater abundance of small bleniid fishes.
Large-Fig. 4. Canonical Correspondence Analysis (CCA) of indi-vidual samples from Menina, Mãe and Pai Islands, indicating a Summer – Winter seasonal gradient and the correlated vari-ables that most probably explain sample distribution in the canonical space.
sized fishes were nearly absent from the sites, but occurred sporadically in the local artisanal fisheries landings (Tubino
et al., 2007), suggesting that fishing pressure reduced their abundance in more accessible and protected sites at the is-lands. Floeter et al. (2006) provided evidence that fishing pressure on target species leads to unbalanced reef fish com-munities, with a possible reduction of top-down control mechanisms.
There are several possible factors that may determine reef fish distribution on Itaipu islands. Local differences observed among sites reflected spatial patterns and seasonal changes associated with structural complexity and species life histo-ries. Several authors have tried to explain the structure of reef fish communities by looking at their exposure to wave energy (e. g. Williams, 1982; Russ, 1984; Galzin, 1987). Although we searched for sheltered sites with comparable hydrodynam-ics, our results suggested a subtle exposure gradient existed from the most exposed, Pai Island, to the least exposed, Menina Island. Wave exposure in Pai Island may produce a signifi-cant difference in the benthic composition, leading to de-creased habitat complexity when compared to the other two sites.
CCA analysis further evidenced the influence of habitat complexity upon species abundance and diversity. We ob-served a distribution pattern with the most abundant, sighted species being grouped closer to the center of the CCA axis (e.g.,Orthopritis ruber and Halichoeres poeyi), while rare, least abundant species were distributed farthest from the CCA center (e.g., Heteropriacanthus cruentatus and Diodon hystrix). Close to the CCA center, we observed the presence of two major groups, one formed by benthic invertebrate feed-ers (Haemulidae, Diplodus argenteus and Parablennius pilicornis), and the other by territorial herbivores (damself-ishes, Stegastes fuscus) and resident predators (groupers,
Epinephelus marginatus). Both groups, considered key spe-cies, greatly influence reef fish communities (Almany & Webster, 2004). Nevertheless, their ecological role at Itaipu appears less important due to their central distribution in the canonical space. The high fishing pressure upon top preda-tors in the area may explain, at least, the low abundance of groupers, minimizing their role as a key species in the reef fish community at the studied area.
The highest diversity was attained at Mãe Island; prob-ably as a consequence of the greatest habitat structural com-plexity. Habitats with high structural complexity usually sup-port more species and individuals by providing shelter and refuge against predation and competition (Holt, 1987; Greenberg et al., 1995; Beukers & Jones, 1997; Connel, 1997; Charbonnel et al., 2002; Gratwicke & Speight, 2005). Com-plexity appears to have a marked influence on abundance of territorial and sedentary fish species, such as damselfishes (Pomacentridae) and groupers (Serranidae) (Sale & Douglas, 1984). Also, sheltered habitats may be a bottleneck for re-cruitment and growth of many reef species (Williams, 1991; Montgomery et al., 2001). The presence of large-sized rocks forming burrows and shelters at different size scales was a
distinctive factor, and especially at Mãe Island, these factors are particularly important for small, site-attached fish spe-cies.
Fish fauna at Menina Island was depauperate compared with the other sites probably due to its proximity to the shore, suggesting that both intensive fishing and coastal runoff influenced fish community (Dulvy et al., 2002). Menina Is-land was also the most visited site by artisanal fishers and weekend divers (Mendonça-Neto, J. P. pers. observation).
Seasonal patterns were observed as a reflection of abun-dance and occurrence of some species throughout the year, with a clear distinction of species composition during sum-mer and winter months. The observed seasonal tendencies were greater in species diversity during the summer months at all of the sites. This tendency may be related to the cyclic upwelling phenomena which occurs in summer months in the Brazilian southeastern region, bringing cold and nutrient-rich waters close to the coastal zone. Other studies on this region showed that plankton biomass, production and consump-tion were higher in summer months than in winter (Freitas & Muelbert, 2004).
Our work showed that despite the fact that reef fish com-munity within the Itaipu coastal zone showed similar elements, differences between sites were evident, mostly mediated by differences in the structural patterns of the rocky reefs, but also by environmental factors that vary considerably from one site to another and also throughout the year.
Acknowledgments
We thank L. Vidal and C. Barcellos for support in field-work and C.E.L. Ferreira and R.A. Tubino for their sugges-tions and critical revisions. Financial support came from Ministério da Ciência e Tecnologia - PADCT-MCT, and Fundação Carlos Chagas de Amparo a Pesquisa – FAPERJ. CAPES and CNPq provided fellowships at different levels for the authors. We are thankful to students and colleagues at the Laboratório de Biologia do Nécton e Ecologia Pesqueira -ECOPESCA, Departamento de Biologia Marinha, Universidade Federal Fluminense – UFF. A. Leyva helped with English editing of the manuscript.
Literature Cited
Acosta, C. A. & D. N. Robertson. 2002. Diversity in coral reef fish communities: the effects of habitat patchiness revisited. Marine Ecology Progress Series, 227:87-96.
Almany, G. R. & M. S. Webster. 2004. Odd species out as predators reduce diversity of coral-reef fishes. Ecology, 85(11): 2933-2937.
Bellwood, D. R. & P. C. Wainwright. 2002. The history and biogeography of fishes on coral reefs. Pp. 5–32. In: P. F. Sale (Ed.). Coral Reef Fishes: Dynamics and Diversity in a Complex Ecosystem. San Diego, Academic Press, 576 p..
ter Braak, C. J. F. & P. Smilauer. 1998. Canoco reference manual and user’s guide to Canoco for Windows: software for canonical community ordination (version 4). Microcomputer Power, Ithaca, New York, USA. 110 p.
Caley, M. J. 1993. Predation, recruitment and the dynamics of communities of coral-reef fishes. Marine Biology, 117: 33-43. Charbonnel, E., C. Serre, S. Ruitton, J. G. Harmelin & A. Jensen. 2002. Effects of increased habitat complexity on fish assembla-ges associated with large artificial reef units (French Mediterranean coast). ICES Journal of Marine Science, 59: 208-213.
Cheney, K. L. & I. M. Côté. 2003. Habitat choice in adult longfin damselfish: territory characteristics and relocation times. Journal of Experimental Marine Biology and Ecology, 287: 1-12. Clarke, K. R. & R. M. Warwick. 1994. Similarity-based testing for
community pattern: the two-way layout with no replication. Marine Biology, 118: 167-176.
Connell, S. D. 1997. The relationship between large predatory fish and recruitment and mortality of juvenile coral reef-fish on arti-ficial reefs. Journal of Experimental Marine Biology and Ecology, 209: 261-278.
Dulvy, N. K., R. E. Mitchell, D. Watson, C. J. Sweeting & V.C. Nicholas. 2002. Scale-dependent control of motile epifaunal community structure along a coral reef fishing gradient. Journal of Experimental Marine Biology and Ecology, 278: 1-29. Ebeling, A. W. & M. A. Hixon. 1991. Tropical and temperate reef
fishes: comparison of community structure. Pp. 509-563. In P. F. Sale (Ed.). Coral Reef Fishes: Dynamics and Diversity in a Complex Ecosystem. San Diego, Academic Press, 576 p. Ferreira, C. E. L, S. R. Floeter, J. L. Gasparini, J. C. Joyeux & B. P.
Ferreira. 2004. Trophic structure patterns of Brazilian reef fishes: a latitudinal comparison. Journal of Biogeography, 31: 1093-1106.
Ferreira, C. E. L., J. E. A. Gonçalves & R. Coutinho. 2001. Commu-nity structure of fishes and habitat complexity in a tropical rocky shore. Environmental Biology of Fishes, 61: 353-369. Ferreira, C. E. L., A. C. Peret & R. Coutinho. 1998. Seasonal grazing
rates and food processing by tropical herbivorous fishes. Journal of Fish Biology, 53: 222-235.
Floeter, S. R., C. E. L. Ferreira, A. Dominici-Arosemen & I. R. Zalmon. 2004. Latitudinal gradients in Atlantic reef fish communities: trophic structure and spatial use patterns. Journal of Fish Biology, 64: 1680-1699.
Floeter, S. R., R. Z. P. Guimarães, L. A. Rocha, C. E. L. Ferreira, C. A. Rangel & J. L. Gasparini. 2001. Geographic variation in reef-fish assemblages along the Brazilian coast. Global Ecology and Biogeography, 10: 423-433.
Floeter, S. R., B. S. Halpern & C. E. L. Ferreira. 2006. Effects of fishing and protection on Brazilian reef fishes. Biological Conservation, 128: 391-402.
Freitas, D. M. & J. H. Muelbert. 2004. Ichthyoplankton distribution and abundance off southeastern and southern Brazil. Brazilian Archives of Biology and Technology, 47(4): 601-612. Galzin, R. 1987. Structure of fish communities of French Polynesian
coral reefs. I: Spatial scales. Marine Ecology Progress Series, 41: 129-136.
Gratwicke, B. & M. R. Speight. 2005. Effects of habitat complexity on Caribbean marine fish assemblages. Marine Ecology Progress Series, 292: 301-310.
Greenberg, L. A., C. A. Paszkowski & W. M. Tonn. 1995. Effects of prey species composition and habitat structure on foraging by two functionally distinct piscivores. Oikos, 74: 522-532.
Henderson, P. A. & R. H. M. Seaby. 1998. Species diversity and richness, 2.3. Pisces Conservation Ltd. 117p.
Hill, M. O. 1973. Diversity and evenness: a unifying notation and its consequences. Ecology, 54: 427-473.
Holt, R. D. 1987. Prey communities in patchy environments. Oikos, 50: 276-290.
Joyeux, J. C., S. R. Floeter, C. E. L. Ferreira & J. L. Gasparini. 2001. Biogeography of tropical reef fish: the South Atlantic puzzler. Journal of Biogeography, 28: 1-11.
Kawasaki, H., M. Sano & T. Shibuno. 2003. The relationship between habitat physical complexity and recruitment of the coral reef damselfish, Pomacentrus amboinensis: an experimen-tal study using small-scale artificial reefs. Ichthyology Research, 50: 73-77.
Legendre, L. & P. Legendre. 1998. Numerical ecology, 2nd English edition, Amsterdam, The Netherlands, Elsevier Science BV, 420p.
Luckhurst, B. E. & K. Luckhurst. 1978. Analysis of the influence of substrate variables on coral reef fish communities. Marine Biology, 49: 317-323.
McCormick, M. I. 1989. Spatio-temporal patterns in the abundance and population structure of a large temperate reef fish. Marine Ecology Progress Series, 53: 215-225.
Mendonça Filho, J. G., T. R. Menezes, A. E. Oliveira & M. B. Iemma. 2003. Caracterização da Contaminação por Petróleo e seus Derivados na Baía de Guanabara: Aplicação de Técnicas Organogeoquímicas e Organopetrográficas. Anuário do Institu-to de Geociências (UFRJ), 26: 69-78.
Montgomery, J. C., N. Tolimieri & O. S. Haine. 2001. Active habitat selection by pre-settlement reef fishes. Fish and Fisheries, 2: 261–277.
Parrish, J. D. 1989. Fish communities of interacting shallow-water habitats in tropical oceanic regions. Marine Ecology Progress Series, 58: 143-160.
Primer-E. 2000. PRIMER 5. Plymouth Routines in Multivariate Ecological Research. PRIMER-E Ltd, Plymouth Marine Laboratory, Plymouth, UK. 87 p.
Rangel, C. A., L. C. T., Chaves, C. Monteiro-Neto. 2007. Baseline assessment of the reef fish assemblage from Cagarras Archipelago, Rio de Janeiro, Southeastern Brazil. Brazilian Journal of Oceanography, 55(1): 7-17.
Roberts, C. M. & J. P. Hawkins. 1999. Extinction risk in the sea. Trends in Ecology and Evolution 14(6): 241-246.
Roberts, C. M. & R. F. G. Ormond. 1987. Habitat complexity and coral reef fish diversity and abundance on Red Sea fringing reefs. Marine Ecology Progress Series, 41: 1-8.
Rocha, L. A. 2003. Patterns of distribution and processes of speciation in Brazilian reef fishes. Journal of Biogeography, 30: 1161-1171.
Rocha, L. A. & I. L. Rosa. 2001. Baseline assessment of reef fish assemblages of Parcel Manuel Luiz Marine State Park, Maranhão, north-east Brazil. Journal of Fish Biology, 58: 985-998. Rocha, L. A., I. L. Rosa & R. S. Rosa. 1998. Peixes recifais da costa
da Paraíba, Brasil. Revista Brasileira de Zoologia, 15(2): 553-566.
Rosa, R. S. & R. L. Moura. 1997. Visual assessment of reef fish community structure in the Atol das Rocas Biological Reserve, off northeastern Brazil. Proceedings of 8th International Coral Reef Symposium 1, 983-986.
Russ, G. R. & W. Gladstone. 1990. Accuracy and bias of visual estimates of numbers, size structure and biomass of a coral reef fish. Marine Ecology Progress Series, 64: 253-262.
Sale, P. F. 1991. The ecology of fishes on coral reefs. Academic Press: San Diego, 754p.
Sale, P. F. & W. A. Douglas. 1984. Temporal variability in the community structure of fish on coral patch reefs and the relation of community structure to reef structure. Ecology, 65(2): 409-422.
Schofield, P. J. 2003. Habitat selection of two gobies (Microgobius gulosus, Gobiosoma robustum): influence of structural complexity, competitive interactions and presence of a predator. Journal of Experimental Marine Biology and Ecology, 288: 125-137.
Silva, M. A. & F. G. Araújo. 2003. Influência das variáveis ambientais na fauna acompanhante na pesca da manjuba Anchoa tricolor
(Agassiz) (Actinopterygii, Engraulidae) na Baía de Sepetiba, Rio de Janeiro. Revista Brasileira Zoologia, 20(3): 367-371. Solow, A. R. 1993. A simple test for change in community structure.
Journal of Animal Ecology, 62: 191-193.
Syms, G. & G. P. Jones. 2000. Disturbance, habitat structure and the dynamics of a coral-reef fish community. Ecology, 81(10): 2714-2729.
Tubino, R. A., C. Monteiro-Neto, L. E. S. Moraes & E. T. Paes. 2007. Artisanal fisheries production in the coastal zone of Itaipu, Niterói, RJ, Brazil. Brazilian Journal of Oceanography, 55(3): 187-197.
Vilela, C. G., A. E. S. Sanjinés, R. O. Ghiselli, J. G. Mendonça Filho, J. A. B. Neto & C. F. Barbosa. 2003. Search for Bioindicators of Pollution in the Guanabara Bay: Integrations of Ecologic Patterns. Anuário do Instituto de Geociências (UFRJ), 26: 25-35.
Williams, D. McB. 1982. Patterns in the distribution of fish communities across the central Great Barrier Reef. Coral Reefs, 1: 35-43.
Williams, D. McB. 1991. Patterns and processes in the distribution of coral reef fishes. Pp. 437–474. In: P. F. Sale (Ed.). The Ecology of Fishes on Coral Reefs. San Diego, Academic Press. 576p.