Examination of low schooling level of a cohort of young
Brazilian mothers
IHumberto CorrêaII
Abstract
Worldwide research on fertility in the second decade of life has shown that young mothers complete fewer years of schooling than their nulliparous age peers and women who postpone their first childbirth until age 20 or later. In Brazil, few studies have identified the extent to which these gaps were already present before fertility. Thus, it is difficult to assess the real effect of pregnancy and fertility on young mothers’ education. This paper comprises an analysis of the educational progress of a representative sample (n = 225) of young women living in Campinas, a municipality of one million inhabitants in the state of Sao Paulo, Brazil. All individuals in the sample had their first live-born child between the ages of 17 and 19 in 2005 and were interviewed between 2006 and 2007. Their schooling histories from age seven to 16 (when all were still nulliparous) were then reconstituted longitudinally by the use of retrospective questions. The high incidence of academic failures and interruptions in studies prior to the subjects’ pregnancies and first live births indicates that many of them had encountered obstacles in their schooling career before fertility: 28.0% failed and dropped out while 78.2% failed or dropped out of at least one school grade before pregnancy and their first live birth. Thus, cross-sectional studies that analyze the schooling deficits of young mothers only after their first pregnancy or childbirth and directly compare them to the school achievements of childless women—or those who delayed their first childbirth after the age of 20—may not properly identify the origins of age-school grade gaps and the few years of schooling completed.
Keywords
Adolescent fertility — Teenage pregnancy — Age-school grade gap.
I- The author thanks the support of the National Counsel of Technological and Scientific Development of Brazil (CNPq) for the Ph.D. scholarship (#141645/2004-0), which made this article possible.
II- Universidade Estadual de Campinas (UNICAMP), Sao Paulo, Brasil.
Antecedentes do baixo nível de escolarização alcançado
por uma coorte de jovens mães brasileiras
IHumberto CorrêaII
Resumo
Em todo o mundo, pesquisas sobre a fecundidade efetivada na segunda década da vida demonstram que jovens mães completam menos anos de escolarização se comparadas com pares etárias nulíparas ou, ainda, com mulheres que postergam o nascimento do primeiro filho para os 20 ou mais anos de idade. No Brasil, poucos estudos identificaram em que medida os diferenciais observados já estavam presentes antes da fecundidade e, por essa razão, torna-se difícil avaliar os efeitos do nascimento de um filho sobre as carreiras escolares das jovens mães. O presente estudo analisou a trajetória escolar de uma amostra representativa (n=225) para uma coorte de mães adolescentes residentes em Campinas, município com mais de 1 milhão de habitantes, localizado no Estado de São Paulo. Todas as jovens da amostra tiveram seu primeiro filho nascido vivo entre as idades de 17 e 19 anos no ano de 2005 e foram entrevistadas entre 2006 e 2007. Os anos de estudos concluídos foram mensurados por meio de uma observação transversal e pós-fecundidade. No entanto, a partir de questões retrospectivas, as histórias escolares das jovens mães foram reconstituídas longitudinalmente desde os 7 até os 16 anos, idades em que todas eram nulíparas. As elevadas proporções de repetências e interrupções em período anterior à gravidez e também ao nascimento do primeiro filho das jovens amostradas indicam que muitas tiveram suas histórias escolares cingidas por obstáculos que ultrapassam a questão da fecundidade: 28,0% repetiram de série e interromperam suas carreiras escolares, enquanto 78,2% repetiram ou evadiram ao menos uma série antes da gravidez e do nascimento do primeiro filho. Concluiu-se que, em função da metodologia adotada, estudos transversais que analisam os déficits educacionais das jovens mães somente após a fecundidade e os comparam diretamente com os anos de estudo alcançados por mulheres sem filhos – ou com aquelas que alcançaram a fecundidade após completarem 20 anos de idade – podem não identificar adequadamente a origem temporal da defasagem idade-série usualmente observada.
Palavras-chave
Fecundidade na adolescência — Gravidez na adolescência — Defasagem escolar.
I- O autor agradece ao Conselho Nacional de Desenvolvimento Científico e Tecnológico (CNPq) a concessão da bolsa de doutorado (no 141.645/2004-0) que
propiciou a realização da pesquisa na qual se baseia o presente artigo.
II-Universidade Estadual de Campinas, Campinas, SP, Brasil.
Schooling career in the context of adolescent fertility
Formal education represents a key portion of human social capital and
is deemed a condicio sine qua non for
improving well-being. For one, as today’s labor market is becoming more demanding and technologically dependent, proper schooling is indispensable for producing a qualified labor force. For another, education helps build citizenship and minimize the differentiation among genders and races (CORRÊA, 2009). Education is considered so crucial that it is one of the three dimensions of the Human Development Index adopted by the United Nations to measure and compare the levels of well-being among populations (HUMAN DEVELOPMENT REPORT, 2003). School attendance, literacy, and a minimum amount of formal education during childhood and adolescence do not automatically clear a path to upward social mobility in adulthood. However, they may be regarded as proxies
that create the contexts for achieving the qualification standards demanded by
contemporary societies (CALDWELL et
al., 1998). Actual or likely obstacles to school development are thus interpreted as predecessor or contributing agents to various levels of instability, poverty, or even social exclusion. Education is, consequently, a dimension generally used as a backdrop for a wide range of social questions.
Several studies on adolescent fertility (hereafter understood as occurring under the age of 20) have attested that, among other negative consequences, young mothers spend fewer years in school and also complete fewer grades than their nulliparous age peers or older first-time mothers. Although this frequent association does not necessarily constitute a cause-and-effect relationship this idea is still appealing because provides an apparently straightforward and actionable interpretation to a complex subject.
Age-school grade gap (ASGG, hereafter understood as the difference between the age of the student and the age-appropriate grade in school) is often observed in populations of young mothers and is attached to discourses on adolescent pregnancy/fertility
The main purpose of this paper is to investigate the school careers of a cohort of young Brazilian mothers who delivered their first live-born child between 17 and 19 years of age. Specifically, it undertook a longitudinal reconstitution of their school careers from the beginning until the age of 16; in other words, up to a stage of their lives in which none of them had yet delivered their first child. We intend to compare any delay in schooling up to this point to the level of education reported during the interviews. Such a comparison may indicate how much of the schooling gap was already present before pregnancy and the birth of the first child.
Brazilian school system
Until fairly recently, the minimum mandatory schooling in Brazil was eight years: First grade started at the age of seven, and eighth grade was completed by the age 14 or 15. In 1996, the Law of Guidelines in Education stipulated that minimum compulsory schooling would last nine years. This parameter has become a national education goal through Federal Law 10.172 of January 9th, 2001, which approved the National Education Plan (BRASIL, 2001a). Nonetheless, elementary education was officially extended to nine years only with the approval of the Bill of Law 3.675/2004. Local governments, however, declared that they needed more time to adapt to the new setup and another law — 11.114/2005 — settled the year 2010 as the deadline for states and municipalities to fulfill the requirements of Law 3.675/2004.
years of ensino médio (high school) precede college, but these are not mandatory and are far from being universal in Brazil. For the cohort studied in this paper, the optimal synchronism for the age-grade match would have been obtained if the subjects had all enrolled in first grade of elementary school in the calendar year that they turned seven years old. However, if a child turned seven from August to the end of the year, she would be enrolled in the following calendar year. In general, we expected second graders to be eight years old, third graders nine, and so forth. Thus, eighth grade would be completed by the age 14 or 15. For the purposes of checking optimum synchronism, we accepted in this paper the completion of the eighth grade in the calendar year that the young girls turned 15.
Municipality of Campinas
Campinas is located in Sao Paulo, the
most populous state in the Brazilian Federation, and is the one with the largest economy.Campinas sits on more than 796 km2 and
around 30% of its area is considered urban where 98.3% of its 1.080 million inhabitants live. Currently, it has the 14th largest population among 5,565 Brazilian municipalities and is the third most populous city in Sao Paulo, after only the state’s homonymous capital and the municipality of Guarulhos (IBGE, 2013).
Campinas is one of the industrial centers of the country. Some of the most important national and multinational computer, telecommunication, and petrochemical companies have facilities or branches in the area and enjoy a steady supply of the skilled labor generated by the local universities. The municipality has the second-largest air cargo terminal in the country and a call for bids is now underway for the construction of a high-speed railroad connecting the city to the two major metropolitan areas of the country, Sao Paulo and Rio de Janeiro (PREFEITURA MUNICIPAL DE CAMPINAS, 2013). Therefore, it is not surprising that Campinas also attracts
unskilled workers from surrounding areas, some of which are considered mere dormitory towns. Despite its demographic and economic strength, Campinas has very poor outskirts, where basic public services such as transportation, health facilities, and even running water and sewerage are weak or absent. These conditions contrast with other areas of the region, which boast infrastructure comparable to that of the best cites in the world. The city, indeed, reflects the conditions found in the more developed regions of Brazil but also reveals the characteristics of its most vulnerable ones, especially those found in the peripheries of the country’s large urban centers. Fertility among female adolescents, especially among the poorest of them, is not uncommon. Moreover, it is a phenomenon of interest to researchers that encompasses a wide range of related social issues.
Method
All data presented were extracted from the SFYW — Survey of Families formed by Young Women (CORRÊA, 2007) — and carried out in the city of Campinas as part of the author’s PhD thesis. The survey was based on a representative probability sampling of the target population formed by a set of young women with the following characteristics: (a) At least one child born alive in 2005 (even if the child had already died by the time of the interview, the young mother remained eligible for the survey). (b) The child indicated in (a) was the mother’s first live-born child. Multiple pregnancies (twins or triplets), however, were considered single events. For the purpose of this paper, eventual miscarriages, stillbirths, or abortions reported, and even those that occurred before the birth of first live-born child1 did not count as first fertility events. (c) The young mother was 17 to 19 years old (using the demographic concept of
age at last birthday) at the time of childbirth.
(d) The young mother was living in the city of Campinas when she delivered the child in 2005. Even if she had moved to another city by the time of the interview (2006–2007), she would still be eligible for the survey. (e) The parturition mentioned in (a) took place in the city of Campinas.
After registering the project with the Ethics Committee on Research on Human Beings (SISNEP, 2006)2 and with the approval of Ethics Committee in Research of the Faculty of Medical Sciences and the Demography Department of the State University of Campinas, the author obtained from the Municipal Health of Campinas a file containing all the data arranged on Live Birth Certificates (BRASIL, 2001b). These documents are completed by the staff of hospitals where births occur and contain extensive information about newborns and their mothers, including home addresses on the date of delivery.
The cases that did not meet all the above criteria were excluded, and 1,250 eligible records were obtained to form a reference system for the sample extraction. Although SFYW used a modus operandi similar to that of household sampling surveys, its Elementary Units (EU) were the young women who met the inclusion criteria and lived at the addresses reported in the birth certificates.
In accordance with the predetermined criteria for sampling, two or more records representing the same pregnancy (twins or triplets) would be counted as one — the mother herself. Meanwhile, if two or more young mothers lived at the same address, they would be counted as multiple EUs referenced to a single household. After the data were passed through search filters, the number of EUs was reduced to 1,239 from the 1,250 birth records associated with 1,238 households.
To determine the sample size (n) and desired statistical precision for estimating the SFYW indicators, we considered the available
2- Project # 0213.0.146.000-06.
resources to carry out the project. The final sample size consisted of 225 cases, based on a confidence level of 90%, a confidence interval of 5%, and a response distribution of 50%. Because of their intrinsically descriptive nature, no statistical tests were used in the data presented in this paper.
All interviews were carried out between October 26th, 2006, and October 9th, 2007, by the author alone. The beginning of the field survey was planned in such a way that the young mothers would be at least 18 years old at the time of interview and thus would no longer need a parent’s or guardian’s consent to answer it.
The subjects were asked to read and sign an informed term of consent form that described the nature, purpose, and confidentiality of the survey.
To minimize the incidence of missing interviews, no a priori limit was set on the number of visits to find an EU before discarding it. Of the completed interviews, 67 (29.8%) required just one visit to establish contact and obtain cooperation. In 20.4% of the cases, four or more attempts were necessary. An average of 2.49 contact attempts were made per concluded interview, but all of them were started and finished in a single day. The application time ranged from 21 to 77 minutes; the average duration was 36 minutes.
The questionnaire contained more than 200 closed questions on topics such as school career, work insertion, fertility, migration, and socioeconomic conditions, plus a set of questions about sexual and reproductive behavior. However, this paper will deal with only a fraction of the topic of education.
by the interviewee was associated with a calendar year and the interviewee’s age at the end of the same year.
Each subject was asked — directly or through answers derived from a set of questions — the following topics about her schooling career: if she attended preschool; the calendar years in which she attended private or state schools; the calendar years in which she moved to another school; the calendar years in which she was promoted to the following grade; the calendar years in which she repeated a grade; the calendar years in which she did not attend classes regularly; and the calendar years in which she did not attend classes at all.
Other events, when identified by specific questions, were also transferred to the calendar form: pregnancies, suspicions of pregnancy, miscarriages, abortions, and stillbirths; age at the time of giving birth; age when parents separated; age when a parent died; the calendar years in which any jobs started up to the date of the interview and their duration; age at menarche; age at the time of first sexual intercourse; age at the beginning of marriages or cohabitations and the duration of these relationships.
Some questions served as filters to check the consistency of prior responses to minimize the possibility of interviewee memory lapses. The sequence of the questionnaire’s topics and specific questions was intended to produce a chronological recall of events.
In summary, the calendar form facilitated the construction of a consistent timeline of events for each of the young women interviewed. This would probably not have been possible without cross-checking responses during the interviews. Furthermore, the use of the calendar form allowed the tabulation of data in a format that would not have been feasible using only the filled-out questionnaires.
All the information was stored and tabulated using the software applications
Statistical Package for the Social Sciences® 13.0 for Windows® and Microsoft® Excel 2003.
Results
It is well documented that worldwide (MENSCH, 1998; CALDWELL, 1998) and in Brazil (FERRAZ and FERREIRA, 1998; BERQUÓ and CAVENAGHI, 2005; CAVENAGHI and ALVES, 2011; HEILBORN and CABRAL, 2011) adolescent fertility is predominant among the poorest populations. This pattern could be verified for this group through the application of Brazilian criteria for economic classification — the Critério de Classificação Econômica
Brasil proposed by the Brazilian Association
of Research Institutes to “estimate the power of consumption of urban individuals and families” (ABEP, 2003). Reflecting the expected composition of the target population, the sample comprised individuals essentially belonging to lower economic strata: A1-0.0%; A2-0.9%; B1-3.6; B2-12.4%; C-65.4%; D-17.3%; and E-0.4%. Furthermore, we observed the predominance of groups that are traditionally most vulnerable in Brazilian society, with non-Whites counting for as many as 56.9% of the sample.
Other household characteristics confirm the vulnerable scenarios uncovered during the interviews. Almost all households (99.1%) had electricity and piped water, but sewage systems were available to only 76.0%. The majority of the subjects were born in Campinas (66.2%), but an important subgroup was composed of migrants born in other cities of Sao Paulo (14.7%) or even in other states (18.7%). One respondent was born in another Latin American country but her family had immigrated during her infancy. Labor insertion was very much present in their lives, as 86.7% had worked at least once before pregnancy — all had at least one informal job. At the time of the interview, 60.4% lived exclusively with their child and partner but 17.8% did not live with the baby’s father.
assumption and the fact that the young women averaged 20.5 years3 of age at the time of the interview, only 28.9% of them had reached the third grade of high school or gone beyond that level (Figure 1: a).
3 - The calculation considered the difference between the date of the interview and date of birth of the interviewee. The result was obtained in days and converted into years of 365 days. Under this assumption, we found that only 7.6% of the respondents had ages in the 18.2 – 19.0 range; i.e., from exactly 18.2 up to (less than, exclusive) 19 years old. The percentage distribution of the other subjects was: 19 – 20 years = 23.1%; 20 – 21 years = 37.3%; 21 – 22 years = 28.0%; 22 years or above = 4.0%. Therefore, considering the age of 18 for the calculation of the ASGG can be interpreted as conservative parameter, as it dismissed, on average, 2.5 academic potential grades. However, since only primary education (eight first years) is compulsory in Brazil and higher education is not always set as a goal or even a desire of the individuals, we considered the ensino médio (high school) as a parameter for the measurement of the ASGG.
13,8
Total
High school College
4,0 b
28,9 a
First and second
grades Third grade First up to third year 18,7
32,4
1,8
24,4 26,2
2,2 0,4 2,7 Last school grade finished with approval
Elementary school
Currently attending this level or in the one which interrupted school career* Currently not attending school, but has already attended Currently attending school
*Considers the last finished grade, when interruption of school career has been observed or; current school grade, if the subject is still in the education system. Source: CORRÊA, 2007.
25,3 d
28,4 c
Second up to fourth grade
Fifth up to seventh
grade Eighth grade 0,0 3,6 3,6 3,1
21,8 24,9
2,7
7,6 10,2
3,1
32,9 38,7
16,4
43,1 58,7
4,0 0,4
2,7 first grade of elementary school, and using
that age as the sole criterion to measure school performance, we expected that by the time they were 18, all cohort subjects would have finished high school. In spite of this reasonable
Figure 1 – Percentage distribution of young mothers by current unfinished school grade, school grade finished with approval and the last school grade finished or dropped out. Sample of survey of families formed by young women (n=225)
Only one in every 25 young women (4.0%) had completed or gone beyond the third grade of high school (11th grade) and remained in the formal education system at the time of the interview (Figure 1: b).
We also observed that 28.4% of the young women had not yet concluded the eighth grade (Figure 1: c). Moreover, 25.3% of the sample — 89.1% of those who had not finished the basic cycle up to the eighth grade — were already out of the educational system when interviewed (Figure 1: d).
As observed in many surveys, the figures presented above result from a cross-sectional observation after the event of fertility and almost nothing can be inferred about the processes
experienced pregnancy and child delivery in the second decade of life.
In fact, the figures presented suggest that, if any, the influence of fertility on the educational progress of the subjects was expressed by more complex mechanisms than those of a supposed direct cause-and-effect relationship. This statement stems from the realization that the SFYW interviews were conducted on average 22 months4 after the young mothers delivered their first child. For this reason, we can safely infer that an important portion of the ASGG observed for the sample cohort occurred prior to fertility. Otherwise, we would not have encountered such high proportions of young women with an ASGG of more than two or three years.5 This can be confirmed by analyzing the subgroup of young women who had finished high school at the time of the interview; or, using a more conservative parameter, if we considered only the proportion of young women who had not even finished elementary school when they were interviewed.
Moreover, it is relevant to mention that even when using conservative assumptions to assess the schooling progress of this group, an ASGG of up to three years is not necessarily an effect of fertility. However, on an individual level, one can ensure that any gap of over three years, continuously or intermittently, began before the birth of the first child.
Hence, it would be worth investigating how the school careers of these young mothers unfolded as well as the extent to which the indicated deficits were present before fertility. Adopting a longitudinal perspective and analyzing the schooling progress of the subjects
4- Minimum = 10.4 months; 1st Quartile = 18.9 months, mean = 21.9 months, median = 21.8 months; 3rd Quartile = 25.3 months; Maximum = 32.6 months. Moreover, 64% of the interviews were conducted within 24 months after the date of birth of the first child; 70%, up to 24.9 months; 80%, up to 25.9 months; and 90%, up to 27.6 months.
5- Roughly, if we consider the average of 22 months between the date of delivery and the date of the interview, and add to it about nine months of pregnancy, the delay attributable to the maximum individual fecundity could not exceed two years and seven months.
before they reached the age of fertility seems a good way of finding answers to these questions.
Age-school grade gap
As previously stated, constitutionally mandatory education for the considered cohort — young women born between 1985 and 1988 — lasts until the end of elementary school; that is, through the first eight grades of schooling. If we consider that the girls had entered the formal education system at age of seven or eight, we could expect to see all of them reaching the eighth grade by 14 or 15. Therefore, we analyzed the young women’s schooling career through age of 15.
It is worth mentioning that by age 15, none of the young mothers included in the SFYW had yet become pregnant with their first live-born child (Figure 2). In fact, for the sample considered, we only observed a small number of pregnancies at age 16 and first deliveries at age 17.
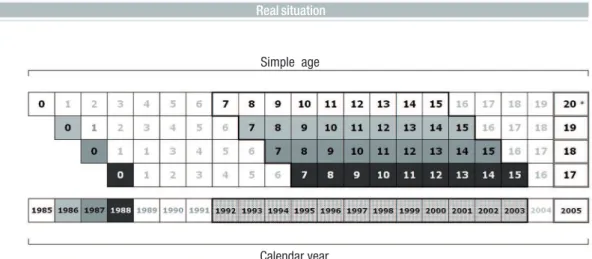
As we simultaneously analyzed information about young people of different ages that also started school in different times, we disregarded the calendar years and considered the aggregated information by simple ages. Figure 3 schematically summarizes the adaptation of the Lexis diagram presented in Figure 2.
The method applied rendered an age match to simultaneously analyze the schooling career of these three groups, who are relatively homogeneous in age and may be considered both a birth and a childbearing cohort. Furthermore, this age matching overcomes the hypothetical results that a simple age standardization would produce over a direct cross-sectional observation of the school careers of these young mothers with three similar albeit distinct ages (17, 18, and 19 years).
corresponding to its calendar year. Otherwise, if she failed to be promoted to the following grade or dropped out of school during the calendar year, she would be wasting potential time to advance. We shall call this theoretical opportunity to advance a single grade in a specific calendar year as the space for schooling progression (SSP).
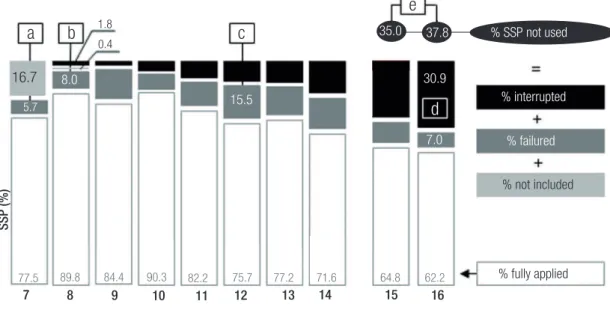
Under this assumption, we can briefly note that by the age of seven, 16.7% of the future young mothers were not yet in school, while 5.7% had already failed one grade (Figure 4: a). Thus, at age seven, 22.5% of this group did not maximize their SSP.
By the end of the following year, the girls had turned eight. At this age, failure rates had reached 8.0% of the total, while the level of dropouts — those who had gone a year without
any record of attendance — were 1.8%. In addition, one participant (0.4%) was still outside the schooling system. In total, therefore, they had wasted 10.2% of their SSP (Figure 4: b).
A measure of failure, often hidden by interruptions of less than one complete school year, was observed from the very beginning of their schooling careers. The peak of such failure occurred at 12 years of age, when 15.5% of young women had not been promoted to the following grade (Figure 4: c).
It is worth mentioning that transition from fourth to fifth grade occurs approximately at age 12. This age is an important turning point in one’s educational career in the Brazilian school system because it traditionally corresponds to passing from formely primário (first to fourth grade) to the beginning of ginásio (fifth to Figure 2 – Lexis diagram: key events from birth to the end of field survey
Survey of families formed by young women. Campinas, 2007
*If 17-year-old women at the beginning of field survey (October, 2006) was selected to be included in the sample, they would be interviewed only in 2007, that is, after they turned 18. Nevertheless,
there were no occurrences of such this characteristic. Source: CORRÊA, 2007.
Birth of subjects in the studied cohort (young mothers)
Period of school career without the experience of fertility
Observation of the first pregnancies
Birth of the first child of young mothers
Field survey / Interviews
Simple age
Interviews postponed to
2007*
eighth grade). Although elementary school is no longer divided into these two levels, it is true that an intangible division persists, particularly in the public education system. It is still quite common for students to move compulsorily to another school after the fourth grade as many educational institutions still do not offer all eight elementary grades and/or have adopted complex time schedules to address the heterogeneity of their students’ ages and grade ranges. In fact,
the aggregate numbers generated in this study suggest that moving to another institution after primary school may have contributed to the ruptures in the subjects’ educational progress.
Finally, interruptions in the subjects’ educational progress were observed from age eight. From age 10 onward, the annual proportion of interruption was characterized by a clear growth trend, which by age 16 reached 30.9% of the sample (Figure 4: d).
Figure 3 – Methodology applied to match age information
* Under 20 years old. Source: CORRÊA, 2007.
Survey of families formed by young women. Campinas, 2007
Real situation
Simple age
Calendar year
Simple age
Calendar year
Figure 4 – Percentage distribution of the Space of School Progression (SSP) by simple age. Sample of survey of families formed by young women (n=225)
Source: CORRÊA, 2007.
a
b
c
e
d
% SSP not used
% interrupted
% failured
16.7 8.0
5.7
7.0 35.0
% not included
% fully applied 1.8
0.4
15.5
30.9 37.8
77.5 89.8 84.4 90.3 82.2 75.7 77.2 71.6 64.8 62.2
7 8 9 10 11 12 13 14 15 16
Age at the end of the calendar year
SSP (%)
Thus, at age 15, when none of the respondents had yet gotten pregnant, 35.0% of the SSP had not been used. At age 16, when the first pregnancies that produced live-born children occurred, the rate went up to 37.8% (Figure 4: e).
These figures confirm that a portion of the ASGG captured in the interviews — conducted about 22 months after the birth of the first child — began prior to fertility.
While expanding our analytical perception, these numbers still do not allow us to make safe inferences. SSP rates by age, for example, tell us little about failure and/ or dropout patterns. In other words, would the patterns have manifested in the same individuals or were these events disseminated in large segments of the sample? To answer this question, the data were disaggregated to identify the profiles of the failures and dropouts.
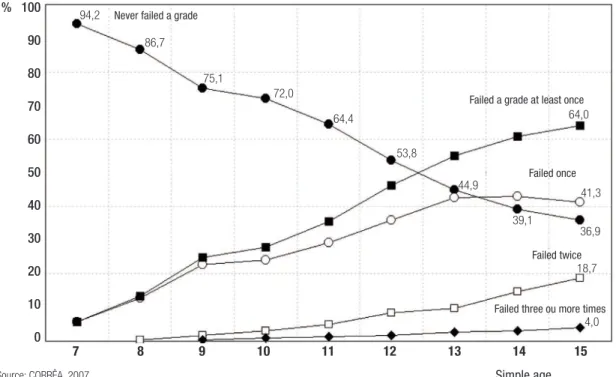
Figure 5 shows an increasing proportion of young women who have an
event of grade failure from age seven. By the time the subjects were 15 years old, 64.0% of them had already failed at least one grade; 41.3% failed exactly once; 18.7, twice; and 4.0%, three or more times.
The figures revealed a well-defined trend on school interruptions as well: At age 15, 42.2% of the young women had left school at least once for a whole school year or longer (Figure 6).
The scenarios of grade failure and schooling interruptions were even grimmer when their frequency and/or duration were taken into account. The high percentages of young women who had dropped out of the educational system for at least one year (42.2%) or had failed at least once (64.0%) indicate that some had experienced both events (Figures 7 and 8).
Figure 5 – Evolution of accumulated proportions of young women with grade failures by the number of repetitions declared. Sample of survey of families formed by young women (n=225)
Source: CORRÊA, 2007.
% 100
90
80
70
60
50
40
30
20
10
0
7 8 9 10 11 12 13 14 15 94,2
86,7
75,1
72,0
64,4
53,8
44,9
41,3
Never failed a grade
64,0
Failed a grade at least once
Failed once
39,1
36,9 18,7
4,0
Failed three ou more times Failed twice
Simple age
Figure 6 – Evolution of accumulated proportions of young women with interrupted grades by the declared duration of interruption. Sample of survey of families formed by young women (n=225)
Source: CORRÊA, 2007.
% 100
90
80
70
60
50
40
30
20
10
0
7 8 9 10 11 12 13 14 15 Simple age
100,0
Never interrupted school career
98,2
96,4
93,8
88,9
85,8
80,0
69,8
57,8
42,2
Interrupted for AT LEAST one school year
20,4
exact 1 year
15,6 6,8
2 years
Figure 8 – Evolution of accumulated proportions of young women who failed and/or interrupted their school careers by simple age and the number of times the events were declared. Sample of survey of families formed by young women (n=225)
Note: The curves of the accumulated proportions are inclusives. Source: CORRÊA, 2007.
Source: CORRÊA, 2007.
Simples age
Figure 7 – Evolution of accumulated proportions of young women who failed and interrupted their school careers by simple age and the number of times the events were declared. Sample of survey of families formed by young women (n=225)
7 8 9 10 11 12 13 14 15
% 30
25
20
15
10
5
0
At least... 1 LYF E 1LYI 1 LYF E 2LYIs 1 LYF E 3LYIs 2 LYFs E 1LYI 2 LYFs E 2LYIs 2 LYFs E 3LYIs
At least: one Lost Year due to Failure (LYF) AND one Lost Year due to Interruption (LYI) 28,0
21,3
0,4 8,0
5,8 4,4
2,7
0,9
14,7
9,8
6,7
2,7 1,8
0,9
9,3
4,9
1,8 0,9
4,4
2,2 1,3
14,2
0,4
7 8 9 10 11 12 13 14 15
% 100
90
80
70
60
50
40
30
20
10
0
Once... failed OR interrupted failed
interrupted failed AND interrupted
78,2
69,8
60,9
42,2 40,9
29,8 25,8
14,2
5,8
64,0 60,9
55,1
46,2
35,6
28,0 24,9
13,3
30,2 52,4
20,0
14,2 11,1
6,2 3,6
1,8
28,0
21,3
14,2 8,0
5,8
Figure 9 – Evolution of accumulated proportions of young women with Age-School Grade Gap (ASGG) by the number of years lost. Sample of survey of families formed by young women (n=225)
Soucre: CORRÊA, 2007.
% 100
80
60
40
20
0
7 8 9 10 11 12 13 14 15 Whit at least...
1 year ASGG 2 year ASGG 3 year ASGG 4 year ASGG Without ASGG 88,0
Simples age Without ASGG 84,9
78,7
75,6
68,9
57,8
50,7
41,8
34,7
21,8
28,9
40,0
7,1 7,6
13,3 31,1
49,3
15,1
21,3
24,4
12,0
58,2 65,3
9,3 17,8
4,4 12,0
5,3 4,4
42,2
4,0 1,8
4,0 3,1
Discussion
The longitudinal figures on grade failures and school dropouts, whether consecutive or not, are sufficient to demonstrate that significant subgroups of the studied cohort had encountered obstacles to their school career before fertility. The extent to which the respondents’ school careers would eventually have been interrupted or resumed if they had not become mothers is beyond the scope of this paper. In previous work (CORRÊA, 2004 and 2009), however, it was possible to infer that approximately 70% of school non-attendance among Brazilian adolescents from 17 to 19 years of age in 2000 were not directly related to fertility.
In summary, despite an important amount of literature suggesting that fertility is a main cause of interrupted schooling in young mothers, the figures presented here point to the
possible existence of other variables, and reveal relevant educational scenarios as observed for the analyzed cohort. The existence of such possibilities nonetheless tends to escape notice in an aggregated analysis, especially when the number of schooling years achieved by the young mothers is considered only after fertility in a single cross-sectional observation.
For the analyzed cohort in this paper, as in many others, the scenario observed seems to be more a result of a bias selection of young students with school careers threatened by factors other than fertility, rather than the impact of fertility on their school careers (FURSTENBERG; BROOKS-GUNN; MORGAN,
1987; GERONIMUS; KORENMAN, 1992 and 1993; HOFFMAN; FOSTER; FURSTENBERG, 1993; FURSTENBERG, 1998 and 2007; HOTZ; McELROY; SANDERS, 2005).
Based on the SFYW data, future papers will explore the determining factors for schooling interruption up to the age of 16.
References
ABEP (Associação Brasileira de Empresas de Pesquisa). Critério de classificação econômica Brasil 2003. Disponível em: <http://www.abep.org/novo/Content.aspx?ContentID=302>. Acesso em: 12 jul. 2013.
BERQUÓ, Elza; CAVENAGHI, Suzana. Increasing adolescent and youth fertility in Brazil: a new trend or a one-time event? In: ANNUAL MEETING OF THE POPULATION ASSOCIATION OF AMERICA, Apr. 2005, Philadelphia. Proceedings... Philadelphia: Population Association of America, 2005. (Session 51, Adolescent Fertility in Developing Countries).
BRASIL. Lei nº 10.172, de 9 de janeiro de 2001. Aprova o Plano Nacional de Educação e dá outras providências. Diário Oficial da União, Brasília, DF, 10 jan. 2001a. Disponível em: <http://portal.mec.gov.Br/arquivos/pdf/L10172.pdf>. Acesso em: 11 ago. 2013.
______. Ministério da Saúde. Fundação Nacional de Saúde. Manual de instruções para o preenchimento da declaração de
nascido vivo. 3. ed. Brasília: Ministério da Saúde: Fundação Nacional de Saúde, 2001b. Disponível em: <http://portal.saude.gov.
br/portal/arquivos/pdf/declaracao_nasc_vivo.pdf>. Acesso em: 11 ago. 2013.
CALDWELL, John Charles et al. (Orgs.). Adolescent reproductive behavior in the developing world. (Special issue of) Studies in
Family Planning, New York, v. 29, n. 2, June 1998.
CALDWELL, John Charles et al. The construction of adolescence in a changing world: implications for sexuality, reproduction, and marriage. Studies in Family Planning (Special issue: Adolescent reproductive behavior in the developing world), New York, v. 29, n. 2, p. 137-153, June 1998.
CAMPINAS. Secretaria de Planejamento e Desenvolvimento Urbano. Planejamento urbano e cadastro técnico. Campinas, 2013. Disponível em: <http://2009.campinas.sp.gov.br/seplama/>. Acesso em: 7 jul. 2013.
CAVENAGHI, Suzana; ALVES, José Eustáquio Diniz. Diversity of childbearing behavior in the context of below-replacement fertility in Brazil. United Nations Expert Paper, New York, n. 8, 2011. Disponível em: <http://www.un.org/esa/population/publications/ expertpapers/2011-8_Cavenaghi_Expert-Paper_FINAL_ALL-Pages.pdf>. Acesso em: 7 jul. 2013.
CORRÊA, Humberto. A fecundidade na adolescência: a interpretação de um problema ou um problema de interpretação? Dissertação (Mestrado em Demografia e Estudos Populacionais) – Escola Nacional de Ciências Estatísticas, Instituto Brasileiro de Geografia e Estatística, Rio de Janeiro, 2004.
______. Pesquisa sobre famílias formadas por jovens mulheres. Campinas, 2007.
______. A fecundidade na adolescência e a educação formal: convergências e divergências interpretativas a partir de uma avaliação do Censo Demográfico 2000. In: IBGE. Prêmio Ence 50 anos: o censo 2000 e a pesquisa social no Brasil. Rio de Janeiro: IBGE, Escola Nacional de Ciências Estatísticas, 2009. p. 79-131.
FURSTENBERG, Frank F. When will teenage childbearing become a problem? The implication of western experience for developing countries. Studies in Family Planning. New York, v. 29, n. 2, p. 246-253, Jun. 1998. Special issue: Adolescent reproductive behavior in the developing world.
______. Destinies of the disadvantaged: the politics of teenage childbearing. New York: Russell Sage Foundation, 2007.
FURSTENBERG, Frank F.; BROOKS-GUNN, Jeanne; MORGAN, S. Philip. Adolescent mothers in later life. Cambridge [Cambridgeshire]; New York: Cambridge University, 1987.
GERONIMUS, Arline T.; KORENMAN, Sanders. The socioeconomic consequences of teen childbearing reconsidered. Quarterly
Journal of Economics, Cambridge, v. 107, n. 4, p. 1187-1214, nov. 1992.
______. The socioeconomic costs of teenage childbearing: evidence and interpretation. Demography, Silver Spring, v. 30, n. 2, p. 281-290, may 1993.
HEILBORN, Maria Luiza; CABRAL, Cristiane S. A new look at teenage pregnancy in Brazil. International Scholarly Research
Network: obstetrics and gynecology, v. 2011, 2011.
HOFFMAN, Saul D.; FOSTER, E. Michael; FURSTENBERG, Frank F. Reevaluating the costs of teenage childbearing. Demography, Silver Spring, MD, v. 30, n. 1, p. 1-13, Feb. 1993. Disponível em: <http://www.jstor.org/stable/pdfplus/2061859.pdf>. Acesso em: nov. 2010.
HOTZ, Joseph V.; McELROY, Suzan Williams; SANDERS, Seth G. Teenage childberaring and its life cycle consequences. Exploiting a natural experiment. The Journal of Human Resources, Wisconsin, v. 40, n. 3. p. 683-715, summer, 2005.
HUMAN DEVELOPMENT REPORT 2003. Millennium development goals: a compact among nations to end human poverty. New York: United Nations Development Programme, 2003.
IBGE (Instituto Nacional de Geografia e Estatística). IBGE Cidades@. Disponível em: <http://www.ibge.gov.br/cidadesat/index. php>. Acesso em: 7 jul. 2013.
MENSCH, Barbara S.; BRUCE, Judith; GREENE, Margaret E. The uncharted passage: girls’ adolescence in the developing world. New York: Population Council, 1998.
SISNEP (Sistema Nacional de Informações Sobre Ética em Pesquisa envolvendo Seres Humanos). Projetos aprovados no estado
de São Paulo no ano de 2006. Disponível em: <http://portal2.saude.gov.br/sisnep/extrato_projeto.cfm?codigo=97046>. Acesso
em: 28 jul 2013.
Received on: 04.03.2013
Accepted on: 27.06.2013