Article
Printed in Brazil - ©2017 Sociedade Brasileira de Química 0103 - 5053 $6.00+0.00
*e-mail: [email protected]
Facile Synthesis of Tellurium Nanowires and Study of Their Third-Order Nonlinear
Optical Properties
Robson R. Silva,*,a Hans A. G. Mejia,b Sidney J. L. Ribeiro,a Lok K. Shrestha,c
Katsuhiko Ariga,c Osvaldo N. Oliveira Jr.,d Vanessa R. Camargo,a Lauro J. Q. Maiae and
Cid B. Araújof
aInstituto de Química, Universidade Estadual de São Paulo, 14801-970 Araraquara-SP, Brazil
bDepartamento de Física, Universidade Federal do Piauí, 64049-550 Teresina-PI, Brazil
cWorld Premier International Center for Mater Nanoarchitectonics (WPI-MANA), National Institute
for Materials Science (NIMS), 305-0044 Tsukuba, Ibaraki, Japan
dInstituto de Física de São Carlos,Universidade de São Paulo, 13560-970 São Carlos-SP, Brazil
eInstituto de Física, Universidade Federal de Goiás, 74001-970 Goiânia-GO, Brazil
fDepartamento de Física, Universidade Federal de Pernambuco, 50670-901 Recife-PE, Brazil
We report on the synthesis of single-crystalline tellurium nanowires with different aspect-ratios prepared via facile surfactant-assisted synthesis under mild conditions. Short and long Te nanowires were synthesized by the reduction of tellurium dioxide by hypophosphorous acid with the assistance of polyoxyethylene (23) laurylether and cetyltrimethylammonium bromide, respectively. We obtained uniform single-crystal Te nanowires with diameter below 30 nm and tunable length from 600 nm to 5 µm. Short and long Te nanowires showed remarkable nonlinear absorption and their third-order nonlinear optical properties were investigated by the Z-scan technique with single 80 ps laser pulses at 532 nm. For the first time, it was observed a distinguished switching behavior from saturated absorption to reverse saturated absorption as a function of the laser intensity in one-dimensional Te nanostructures. Although both short and long Te nanowires display such interesting behavior, the short ones exhibited superior optical limiting performance.
Keywords: tellurium, nanowire, nonlinear optical absorption, z-scan
Introduction
One-dimensional semiconductor nanostructures (1D-SNS)-nanowires, nanotubes, nanobelts, nanorods have attracted attention in the last years.1-7 Indeed, rich and exciting physics comes into play when the optical properties of 1D-SNS are investigated using high intensity laser beams. In this case, the emergence of nonlinear (NL) effects on the optical properties of 1D-SNS has been explored fetching their use as all-optical switching,8 light-emitting diodes9,10 and lasers.11-13 Because of the limited size of 1D-SNS in different dimensions, the confinement of electrons and holes14,15 may induce anisotropic optical behavior like giant birefringence16 and highly polarized photoluminescence anisotropy.15 Important research
has been conducted looking for correlations among the NL optical properties and the shape and the structure of 1D-SNS.17 In particular, the chalcogens elements, more specifically, selenium (Se) and tellurium (Te) draw special attention because they display large NL response and naturally grow into anisotropic structures. In this work, the investigation is focused on one-dimensional Te (1D-Te) nanostructures with the shape of nanowires displaying different aspect ratios.
by the fascinating pursuits for photoconductivity29,30 and gas sensing studies31-33 involving 1D-Te nanostructures. Beyond that, 1D-Te nanostructures combine with other elements to produce materials of high technological relevance such as CdTe, PbTe and Bi2Te3.34
In particular, 1D-Te nanostructures seem to hold a great promise in optical limiting.35,36 For instance, optical limiting can be denoted by the decrease of material transmission with the increase of the incident laser intensity, whose feature is usually explored to protect optical devices from damage at high power density. Sandeep et al.35 studied the optical limiting property of aqueous suspension of Te nanowires with 15-20 µm in length. They report NL absorption coefficients of0.17 cm GW-1 and 0.38 cm GW-1 obtained at 1064 and 532 nm, respectively,using laser pulses durations of 9 ns (1064 nm) and 7 ns (532 nm). The optical limiting behavior was attributed to excited state absorption (ESA) with contribution of NL light scattering.35 In addition, Liao et al.36 studied the NL properties of bacterial biosynthesized Te nanorods hosted in poly(phenylenevinylene)-co-2,5-dioctoxyp-phenylenevinylene (PmPV) in toluene. The nanocomposites displayed very large effective NL absorption coefficient, α
2 = 141 cm GW-1, for pulses of 6 ns at 532 nm. The anomalously large NL response was attributed to the light scattering caused by laser-induced solvent bubbles and microplasmas. It is worthwhile pointing out that these effects are commonly found in experiments with nanosecond lasers. Indeed, the large laser pulses energies cause thermal fluctuations and, in many cases, produce damage in the samples. Therefore, the actual electronic NL properties were not unambiguously measured and the results already published deserve careful analysis.
Herein, the third-order optical nonlinearity of Te nanowires displaying different aspect ratios was investigated in aqueous solution using laser pulses of low energy and small repetition pulse rate to prevent thermal effects or destruction of the samples. Cetyl-trimethylamonium bromide (CTAB) and polyoxyethylene (23) laurylether (Brij), cationic and non-ionic surfactants, respectively, were used for the preparation of stable 1D-Te colloidal aqueous suspensions. The short and long Te nanowires, (S-Te NWs) and (L-Te NWs), synthesized in the present research presented large NL absorption and their behavior switches from saturated absorption (SA) to reverse saturated absorption (RSA) as a function of the incident laser intensity. The experiments show that short tellurium nanowires displayed better optical limiting performance than the long ones. The herein presented results were obtained using picosecond lasers delivering low energy pulses at low repetition rate (7 Hz) to prevent thermal effects and destruction of the samples.
Experimental
Synthesis of aqueous suspensions of Te nanowires with different aspect-ratios
Te nanowires were prepared through the reduction of TeO2 by hypophosphorous acid (H3PO2) in a surfactant-assisted synthesis at 40 ºC. Firstly, TeO2 solution was prepared by completely dissolving TeO2 into HCl 12 mol L-1 and further diluting it to yield a solution of 0.02 g L-1 TeO
2 in
HCl 4.8 mol L-1. In a glass vial of 25 mL, 50 × 10-3 mL of this last solution was added into 20 mL of Brij 2.5 mmol L-1 (in terms of monomer) and CTAB 0.88 mmol L-1 (0.032 wt.%) solutions under vigorous stirring and at room temperature to synthesize short (S-Te NWs) and long Te nanowires (L-Te NWs), respectively. Afterwards, H3PO2 8.6 mol L-1 was added into the mixture upon a Te:H3PO2 molar ratio of 1:50 and 1:10 for S-Te NWs and L-Te NWs, respectively. The mixture was vigorously stirred during 10 min. The glass vial was capped and transferred to an air convection drying oven set at 40 ºC for 24 h.
Structural characterization of Te nanowires
High-resolution transmission electron microscopy (HRTEM) images were obtained with JEOL JEM 3010 and JEOL 2100F microscopes operating at 300 and 200 kV, respectively. Scanning electron microscopy (SEM) images were acquired in a field emission JEOL equipment model 7500F. For SEM and HRTEM analysis, the samples were dropped and dried at 37 °C directly on silicon substrates and copper grids, respectively. The dried samples were subjected to analysis without any treatment.
For the Raman scattering spectroscopy and ultraviolet-visible spectrophotometry measurements, the Te nanowires suspensions were analyzed without dilution. The Raman spectra were measured in a micro-Raman LabRAM Horiba Jobin Yvon Model HR 800, working with a He-Ne laser at 632.81 nm and equipped with a CCD (charge-coupled device) camera. The diffraction grating used was 1800 lines mm-1. The absorption spectra were obtained on a dual beam UV-Vis-NIR spectrophotometer Cary 500. The samples were contained in quartz cuvettes with optical path of 0.5 cm and measured in the region of 200-800 nm using air as reference.
The X-ray photoelectric spectroscopy (XPS) analysis was carried out at a pressure smaller than 10-7 Pa using
a UNI-SPECS UHV spectrometer. The Mg Kα line was
The composition of the near surface region was determined with an accuracy of ± 10% from the ratio of the relative peak areas corrected by Scofield’s sensitivity factors of the corresponding elements. The binding energies of the spectra were corrected using the hydrocarbon component of the polymer fixed at 285.0 eV. The spectra were fitted without constraints using multiple Voigt profiles. The width at half maximum (FWHM) varied between 1.2 and 2.1 eV and the accuracy of the peak positions was ± 0.1 eV.
Nonlinear measurements of aqueous suspensions of Te nanowires
The Z-scan technique37 was used to determine the NL optical properties of the 1D-Te aqueous suspensions. The measurements were carried out with the suspensions of 1D-Te nanostructures inside silica cuvettes with a path length of 1 mm. The light source used was the second harmonic of a Q-switched and mode-locked Nd:YAG laser at 532 nm. Single pulses of 80 ps at low repetition rate (7 Hz) were selected using an electro-optical switch to prevent influence of thermal effects on the measurements. Lens of 5 cm focal length was used to focus the beam on the sample that was mounted on a translation stage to be moved in the focus region, along the beam propagation direction (the Z axis). Positions of the sample between the focusing lens and its focal plane correspond to Z < 0. Photodetectors located in the far-field region were used to monitor the incident and the transmitted laser intensity passing through the sample. The signal-to-noise ratio was improved using a reference channel with geometrical parameters equivalent to the ones of the sample channel.38
Results and Discussion
The synthesis of 1D-Te nanostructures underlies the prior dissolution of tellurium precursor (e.g., TeO2) with a concentrated HCl solution as described by the following reaction:39
TeO2 + 6 HCl → H2TeCl6.2H2O
The reduction of soluble chlorotellurate(IV) species by H3PO2 can be described according to the redox reaction:40
H2TeCl6.2H2O + 2 H3PO2→2 H3PO3 + Te + 6 HCl Eº = 1.568 V
During the synthesis of L-Te NWs and S-Te NWs, the suspensions displayed several color changes as a function of the time: a clear pale yellow followed by a brownish
color were observed within 60 min after the introduction of H3PO2. Afterwards, the suspension developed a purple color which progressively became blue within 24 h. The color shift from brownish to blue is associated with the increase of aspect ratio of the 1D-Te nanostructures.41,42
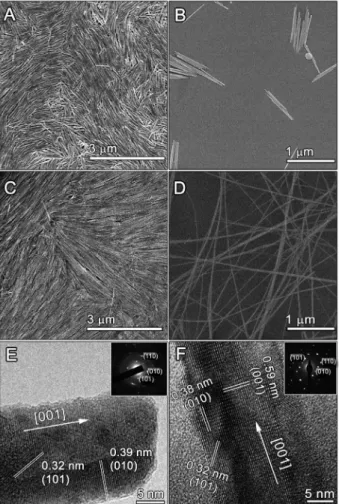
SEM images of the resulting 1D-Te nanostructures are shown in Figure 1. The S-Te NWs with average length of 600 nm and diameters of ca. 28 nm (Figures 1A and 1B) and L-Te NWs with lengths larger than 5 µm and diameter of ca. 20 nm (Figures 1C and 1D) were obtained using Brij and CTAB surfactants, respectively. It is suggested that the presence of surfactant molecules plays a key role to prevent the aggregation among the nanoparticles via electrostatic and steric hindrance. Additionally, it should be pointed out that the presence of charged species such as halide ions could play an important role on the nucleation and growth steps since these species are naturally smaller than surfactant molecules. During the reduction of TeO2, the excess of chloride was used to dissolve the tellurium precursor, thereby it could attach onto the surface of the initial seeds and help to prevent eventual aggregation through electrostatic repulsion. Therefore, the reaction was carried on over additional 24 h at 40 ºC to ensure that the seeds have been consumed to produce 1D-Te nanostructures. The suspensions of L-Te NWs and S-Te NWs displayed excellent stability and no change of shape or occurrence of aggregation was observed within a period of 6 months.
agent in order to generate many crystalline Te seeds with very uniform size at room temperature. At this point, the absence of surfactants would lead to the self-catalytic growth of large Te urchin-like particles somehow based on the consumption of remaining small Te seeds to support the growth of bigger ones. The electrostatic repulsion provided by chloride ions on the surface of very small Te seeds might not be continuously extended towards the generation of newly crystallographic facets. Owing to the high surface energy of the small Te seeds, the growth of bigger particles may not be overcome without surfactant and their aggregation leads to micrometric Te urchin-like particles.
In spite of the ability of surfactants to stabilize suspensions of nanoparticles, they also play an important role on the shape of nanocrystals by controlling the growth
rates of different crystallographic facets. As the seed grows, the surfactant molecules can adsorb specifically to an individual facet of the nanocrystals and decrease its surface energy. As a result, the deposition rate onto the covered facet is significantly decreased. For example, there have been many works showing that gold, a metal possessing a highly symmetric face-centered cubic structure, can produce rod shape nanostructures due to the selective binding of CTAB molecules over the {110} facets.44 When dissolved in water, CTAB forms positive spherical micelles above the critical micelle concentration (CMC).45 Basically, such micelles are based on the assembly of cetyl portion (hydrophobic tail) side-by-side through weak van der Waals interactions whereas the trimethyl ammonium groups (hydrophilic portion) are exposed to water.Particularly, the trimethyl ammonium groups of CTAB molecules could coordinate with [TeCl6]2− ions and stabilize the former Te seeds as well. As the tellurium anisotropic nanostructures grow, the CTAB molecules may interact with the newly-formed facets and control the deposition of Te atoms onto their lateral surface. In this case, the tips of 1D-Te nanostructures hold the highest energetic sites to drive the deposition of Te atoms. Over the time, L-Te NWs with high aspect ratio (> 2500, ratio between length to diameter) were synthesized in the presence of CTAB.
On the other hand, Brij is a non-ionic surfactant and it is assumed that Brij molecules typically arrange into a neutral random coil conformation in aqueous solutions. It is noteworthy that the micelle shape is still not clear in the literature although most of the works have pointed to nearly spherical conformation above the CMC.46 Because the concentration of Brij (0.08 g L-1) was slightly higher than the CMC (i.e., 0.072 g L-1 at 25 ºC), we assumed that the initial solution is basically formed by a mixture of spherical micelles and negligible random coil conformations. In this case, the core is presumed to be mainly occupied by hydrocarbons (hydrophobic) and the entrapped water surrounded by a shell of hydrated poly(oxyethylene glycol) chains (hydrophilic). During the synthesis of S-Te NWs, the [TeCl6]2− ions may have initially coordinated with the hydroxyl groups tangled onto the hydrophilic tail of the free Brij molecules and micelles. The hydrophilic tail offers a feasible site to stabilize the initial Te seeds that further evolve into uniform S-Te NWs on the course of the reaction with the continuous deposition of Te atoms. While the S-Te NWs displayed a smooth surface, their diameter was larger than the obtained for L-Te NWs which presumes that the deposition of Te atoms would also occur extensively over the lateral facets of S-Te NWs. Therefore, we conceive that CTAB molecules could act as an effective soft template to consistently assist the growth of long
L-Te NWs by controlling the addition of atoms onto the side surface while Brij seems unable to mediate the growth of high-aspect ratio 1D-Te nanostructures.
The HRTEM images of S-Te NWs and L-Te NWs pictured in Figures 1E and 1F, respectively, show that both shapes were single crystals. The space fringes of 0.59, 0.39 and 0.32 nm can be indexed to (001), (100) and (101) of tellurium hexagonal structure (i.e., JCPDS file No. 36-1452). The insets of Figures 1E and 1F show the selected area electron-diffraction (SAED) patterns of S-Te NWs and L-Te NWs. The SAED pattern suggests that they can be essentially indexed to the [101] zone axis – of a single crystal grown along the [110] direction with the (110) planes covering the sides. The energy-dispersive X-ray spectroscopy (EDS) analysis of the composition of a single S-Te NW is shown in the Supplementary Information section (Figure S2). The spectrum confirms the presence of pure tellurium in the 1D-Te nanostructure whereas the extra peaks are due to the carbon coated copper grids.
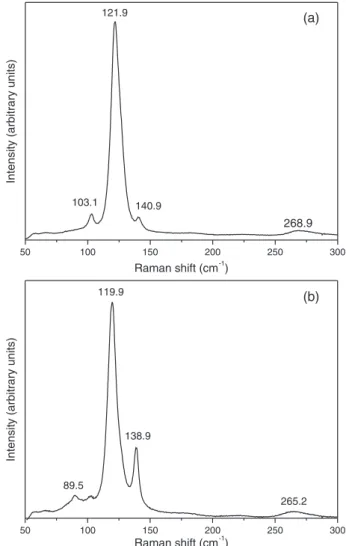
Raman scattering measurements of S-Te NWs and L-Te NWs are presented in Figures 2a and 2b, respectively.
Te exhibits strong Raman-active phonon modes due to its high atomic number and large electronic polarizability. Essentially, tellurium has three atoms per unit cell which belong to an infinite chain, parallel to the c-axis. The Raman spectra show typical bands corresponding to the D3 symmetry group of the Te lattice47-49 with one A
1 mode and two degenerate E modes. The strong bands at 121.9 cm-1 for S-Te NWs and 119.9 cm-1for L-Te NWs are assigned to the A1 mode, described by the symmetric intrachain expansion and comprehension in the ab plane (basal plane);48,49 the weak bands centered at 103.1 cm-1 for S-Te NWs and 89.5 cm-1 for L-Te NWs are assigned to E(1) modes ascribed by the rigid-chain rotation over the a- and b-axis.49 The bands at 140.9 cm-1 for S-Te NWs and 138.9 cm-1 for L-Te NWs are assigned to the E(2) mode mainly described by the asymmetric stretching along the c-axis.26,47,49 The broad bands at 268.9 and 265.2 cm-1 for S-Te NWs and L-Te NWs, respectively, are related to the second order harmonic of the E mode of tellurium.42,48,50 Notice that the Raman bands for L-Te NWs are slightly shifted to lower energy values in comparison to S-Te NWs. Analogous results were presented in Yu and co-workers25 and Li et al.30
Additionally, the relative intensity of the A1 mode of L-Te NWs is smaller than the one displayed for S-Te NWs. According to Marini et al.49 this result can be interpreted as a weakening of intrachain bonds (covalent bonds) in favor of interchain interactions (van der Waals). In this case, the L-Te NWs might exhibit weaker intrachain bonds compared to S-Te NWs. In fact, previous results based upon X-ray absorption fine structure (XAFS) analysis51
Figure 2. Raman scattering spectra of (a) short and (b) long Te nanowires. The Raman spectra show characteristic peaks of the D3 symmetry of tellurium trigonal lattice. The inset shows the ball-and-stick model of the array of helices in tellurium with a perspective view towards the c-axis.
50 50
100 100
150 150
200 200
250 250
300 300
In
te
n
s
it
y
(a
rb
it
ra
ry
u
nits
)
Intensit
y
(a
rb
it
ra
ry
u
n
it
s
)
138.9 119.9
89.5
265.2
Raman shift (cm-1)
Raman shift (cm-1)
140.9 121.9
103.1
268.9 (a)
(b)
suggest that the covalent bonds strengthen when the size of the Te nanoparticles is decreased. Taking into account the differences in length between L-Te NWs and S-Te NWs, it is reasonable to expect a Raman intensity for A1 mode considerably smaller for L-Te NWs.
It is important to stress that the measurements have been carefully conducted to ensure that no substantial chemical modification of the 1D-Te nanostructures took place during the optical properties analysis. For example, Te4+ ions (e.g., resultant of the oxidation of Te) have large polarizability and can give an important contribution to the optical properties.52-55 In addressing this issue, XPS analysis has been performed with S-Te NWs and L-Te NWs samples before the optical measurements. The XPS results obtained are summarized in Figure 3.
and 3d5/2 core electrons of elemental Te, respectively, and do not show any significant shift throughout different 1D-Te nanostructure shapes. The compositional evolution of the Te/TeO2 ratio was estimated from the fitted high-resolution 3d5/2 peak shown in Figures 3c and 3d, for S-Te NWs and L-Te NWs, respectively. Two different structural components are observed at 573.4 and 575.1 eV assigned to Te-Te and Te-O bonds, respectively.51 The quantitative analysis showed 91.4 and 8.6% for Te and TeO2 phase for S-Te NWs while L-Te NWs displayed a composition of 86.9% for Te and 13.1% of TeO2 phase. As such, a slight surface oxidation of S-Te NWs and L-Te NWs was noticed from XPS results, whose investigation of their optical properties was taken into account considering negligible the presence of TeO2 phase.
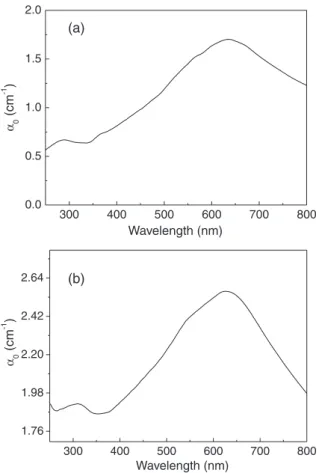
Figures 4a and 4b show the linear optical absorption spectra of the S-Te NWs and L-Te NWs. Both nanostructures display two characteristic broad bands in the UV-Vis region.25 The bands centered at 285 nm for S-Te NWs and 300 nm for L-Te NWs are related to electronic transitions
from the valence band (ligand p-triplet) to the conduction band (antibonding p-triplet). The intense and broad absorption bands centered at 636 nm for S-Te NWs and 630 nm for L-Te NWs are related to transitions from the valence band (non-bonding p-triplet) to the conduction band (antibonding p-triplet).56
The NL absorption coefficient, α
2, and NL refractive index, n2, of the samples were investigated using the Z-scan technique.57 This technique allows the measurement of α2 in the open-aperture scheme, by recording the NL
transmittance of a sample while it is moved along the laser propagation direction (Z-axis). On the other hand, n2 can be measured detecting the light transmitted through the sample followed by an iris positioned in the far-field region in front of the detector (closed-aperture scheme). As in the open-aperture scheme the sample is moved in the focal region, along the Z-axis to measure the NL transmittance. In the present experiments no signal was obtained in the closed-aperture scheme and this indicates that the value
577 576 575 574 573 572 571
Te TeO2 Intensit y (a rb it ra ry u nits )
Binding energy (eV)
(b)
577 576 575 574 573 572 571
Intensit y (a rb it ra ry u nits )
Binding energy (eV)
TeO2
Te
(d)
590 585 580 575 570 565
280000 290000 300000 310000 320000 330000
Binding energy (eV)
3d5/2 3d3/2 R e la ti v e in te n s it y (C P S ) (a)
590 585 580 575 570 565
620000 640000 660000 680000 700000 720000 740000 760000 780000 800000 820000 840000 R e la ti v e in te n s it y (CPS)
Binding energy (eV)
3d3/2
3d5/2
(c)
Figure 3. X-ray photoelectron spectra of Te 3d level core for short and long Te nanowires are shown in (a) and (c), respectively. The corresponding high resolution spectrum showing the curve fitting of Te 3d5/2 level is shown in (b) and (d) for short and long Te nanowires, respectively.
577 576 575 574 573 572 571
Te TeO2 Intensit y (a rb it ra ry u nits )
Binding energy (eV)
(b)
577 576 575 574 573 572 571
Intensit y (a rb it ra ry u nits )
Binding energy (eV)
TeO2
Te
(d)
590 585 580 575 570 565
280000 290000 300000 310000 320000 330000
Binding energy (eV) 3d5/2 3d3/2 R e la ti v e in te n s it y (C P S ) (a)
590 585 580 575 570 565
620000 640000 660000 680000 700000 720000 740000 760000 780000 800000 820000 840000 R e la ti v e in te n s it y (CPS)
Binding energy (eV) 3d3/2
3d5/2
of n2 is smaller than the detection limit of our apparatus (1.53 × 10⁻¹⁵ cm2 W-1).
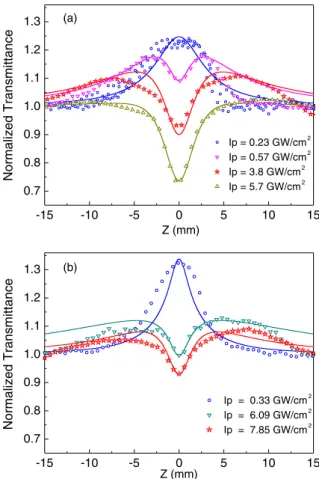
The open-aperture Z-scan profiles for the S-Te NWs and L-Te NWs are shown in Figure 5 for several laser intensities. Both samples exhibited saturated absorption (SA) at laser intensities lower than 0.33 GW cm-2. However, for higher intensities, the Z-scan profiles reveal a competition between SA and reverse saturated absorption (RSA). The dip centered at Z = 0 indicates that excited state absorption (ESA) and/or two-photon absorption (TPA) contribute for the NL transmittance of the Te nanostructures. When the excitation intensity is increased, ESA and/or TPA become the dominant phenomena as shown for intensities in the range of 5.74 to 7.85 GW cm-2. NL absorption was not observed for the pure solvent (water without Te nanoparticles) in the whole range of intensities investigated.
We attributed the switching from SA to RSA to the competition between ground-state bleaching, ESA, and direct TPA from the ground-state. It is important to outline that the laser wavelength (532 nm) is inside the profile of the broad absorption band shown in Figure 4 and then a strong SA should be expected. From Figure 4, we also observe that there is a large absorption for wavelengths in the UV
range. Therefore, a two-step one-photon absorption is possible starting from the ground-state. Of course, in order for RSA to occur, an excited state absorption cross-section larger than the ground-state cross-section is required. Direct TPA transition from the ground-state is also possible and cannot be discarded. However we expect a TPA probability smaller than the RSA probability.
Therefore the open-aperture Z-scan data were analyzed considering the simultaneous contributions of SA, ESA and/or TPA yielding a total absorption coefficient described
by:58,59
(1)
where α
0 is the linear absorption coefficient, I is the laser intensity, IS is the saturation intensity and α2 is the parameter that describes the contribution of SA, ESA and/or TPA. α2 is negative in the case of SA and positive for ESA and TPA.
The expression for the normalized NL transmittance, using equation 1, can be written as:37,38,60-62
(2)
where A(z) = exp[α0LI / (I + Is)], and q(z) = α2I0Leff/1 + (z / z0)2 with I0 being the peak intensity at the focal point, z0 is the Rayleigh length, Leff = [1 – exp(–α0L)]/α0 and L is the sample thickness.
The Z-scan profiles for different laser intensities, shown in Figure 5, were fitted using equation 2. The saturation intensities were determined to be3.7 × 107 W cm-2 for S-Te NWs and3.0 × 107 W cm-2 for L-Te NWs. The obtained NL absorption coefficients for both samples are given in Table 1 for different laser intensities.
Previous works showed that only RSA was found in open-aperture Z-scan experiments performed with nanoseconds pulsed lasers for aqueous suspensions of Te nanowires with similar size and shape.35 The authors observed a small SA signal only at higher concentrations of Te nanowires. Due to the large pulse energy, Z-scan measurements performed with nanosecond laser pulses are usually affected by thermal effects or destruction of the samples which in turn, also prevent the investigation of purer electronic contributions of the NL optical properties. In the present experiment clear evidence of SA or RSA was possible because laser pulses with low energy were employed.
Additional experiments were performed with other nanostructures shapes such as spine-like and nanobrooms, achieved by modifying the surfactant (i.e., sodium
300 400 500 600 700 800
0.0 0.5 1.0 1.5 2.0
Wavelength (nm)
300 400 500 600 700 800
1.76 1.98 2.20 2.42 2.64
Wavelength (nm)
α 0
(c
m
-1 )
α
0
(c
m
-1 )
(a)
(b)
dodecylsulphate and poloxamers) as well as the Te:H3PO2 molar ratio. However, we observed very small NL absorption from those samples and bad reproducibility of the results which was consistently supported with the significant degradation of those nanostructures when they are exposed to the laser beam.
Conclusions
The synthesis of one-dimensional tellurium nanostructures displaying similar interesting nonlinear
optical behavior in the visible region has been described. Short and long Te nanowires were synthesized via surfactant-assisted synthesis into solution-phase approach at low temperature. Particularly, we observed the occurrence of SA and RSA phenomena at 532 nm in Te nanowires displaying different aspect ratios for excitation with 80 ps pulses by using the Z-scan technique. To the best of our knowledge, this is the first report on SA and RSA at the same wavelength in the case of 1D-Te nanostructures. This interesting property could be observed because picosecond laser pulses with small energies were employed. We modeled the results assuming that the competition between ground-state bleaching, excited state absorption (ESA), and direct two-photon absorption (TPA) transitions starting from the ground-state, are responsible for the observed switching behavior from SA to RSA. As a final remark we point out that although both nanostructures have large potential to be tested for applications such as laser pulse compression and optical limiting, short Te nanowires may be more appropriate because they present larger nonlinear absorption coefficient than the long ones. In addition, these Te nanowires can be potentially embedded in rigid or flexible solid-state matrix for the development of more robust and longer lasting optical devices.
Supplementary Information
Supplementary information (Figures S1-S2) is available free of charge at http://jbcs.org.br as PDF file.
Acknowledgments
We acknowledge the financial support from the Brazilian agencies: Coordenação de Pessoal de Ensino Superior (CAPES), Conselho Nacional de Desenvolvimento Científico e Tecnológico (CNPq), through the National Institute of Photonics project, and Fundação de Amparo à Ciencia e Tecnologia de Pernambuco (FACEPE). We also acknowledge the National Laboratory of Nanotechnology (LME/LNNano/CNPEM), Laboratório de Microscopia Avançada (LMA-IQ/UNESP) and Laboratório de Espectroscopia de Fotoelétrons (LEFE-IQ/UNESP) for the technical support during the electron microscopy data collection and XPS analysis. R. R. Silva thanks to the Fundação de Amparo à Pesquisa do Estado de São Paulo (FAPESP) for the grant No. 2013/12367-6 and National Institute for Materials Science-Japan for internship award.
References
1. Joshi, R. K.; Schneider, J. J.; Chem. Soc. Rev.2012, 41, 5285.
Table 1. Nonlinear absorption coefficients of short and long Te nanowires at 532 nm as function of the laser intensity
S-Te NWs L-Te NWs
I0 /(GW cm-2) α2 / (cm GW-1) I0 /(GW cm-2) α2 / (cm GW-1)
0.23 −2.2 ± 0.3 0.32 −13 ± 2
0.57 9.4 ±1.4 6.09 0.81 ± 0.12
3.80 4.0 ± 0.6 7.9 1.0 ± 0.15
5.74 5.0 ± 0.8
S-Te NWs: short Te nanowires; L-Te NWs: long Te nanowires.
-15 -10 -5 0 5 10 15
0.7 0.8 0.9 1.0 1.1 1.2 1.3 Z (mm)
Ip = 0.23 GW/cm2 Ip = 0.57 GW/cm2 Ip = 3.8 GW/cm2 Ip = 5.7 GW/cm2
-15 -10 -5 0 5 10 15
0.7 0.8 0.9 1.0 1.1 1.2 1.3 N o rm a liz e d T ra n s m it ta n c e N o rm a liz e d T ra n s m it ta n c e Z (mm)
Ip = 0.33 GW/cm2 Ip = 6.09 GW/cm2 Ip = 7.85 GW/cm2 (a)
(b)
Figure 5. Open-aperture Z-scan profiles recorded at 532 nm as a function of laser intensity for (a) short; (b) long Te nanowires. The solid curves are the fitting results using a model that includes contributions from saturated absorption, two-photon absorption and reverse saturated absorption.
-15 -10 -5 0 5 10 15
0.7 0.8 0.9 1.0 1.1 1.2 1.3 Z (mm)
Ip = 0.23 GW/cm2
Ip = 0.57 GW/cm2
Ip = 3.8 GW/cm2
Ip = 5.7 GW/cm2
-15 -10 -5 0 5 10 15
0.7 0.8 0.9 1.0 1.1 1.2 1.3 N o rm a liz e d T ra n s m it ta n c e N o rm a liz e d T ra n s m it ta n c e Z (mm)
Ip = 0.33 GW/cm2
Ip = 6.09 GW/cm2
Ip = 7.85 GW/cm2
(a)
2. Fang, X.; Hu, L.; Ye, C.; Zhang, L.; Pure Appl. Chem.2010,
82, 2185.
3. Lieber, C. M.; MRS Bull.2011, 36, 1052.
4. Lieber, C. M.; Wang, Z. L.; MRS Bull.2011, 32, 99.
5. Zhai, T.; Li, L.; Ma, Y.; Liao, M.; Wang, X.; Fang, X.; Yao, J.; Bando, Y.; Golberg, D.; Chem. Soc. Rev.2011, 40, 2986. 6. Zhai, T.; Li, L.; Wang, X.; Fang, X.; Bando, Y.; Golberg, D.;
Adv. Funct. Mater.2010, 20, 4233.
7. Baca, A. J.; Ahn, J.-H.; Sun, Y.; Meitl, M. A.; Menard, E.; Kim, H.-S.; Choi, W. M.; Kim, D.-H.; Huang, Y.; Rogers, J. A.; Angew. Chem.2008, 47, 5524.
8. Piccione, B.; Cho, C.-H.; van Vugt, L. K.; Agarwal, R.; Nat. Nanotechnol.2012, 7, 640.
9. Nadarajah, A.; Word, R. C.; Meiss, J.; Könenkamp, R.; Nano Lett.2008, 8, 534.
10. Kim, D.-H.; Lu, N.; Ghaffari, R.; Rogers, J.; NPG Asia Mater.
2012, 4, e15.
11. Huang, M. H.; Mao, S.; Feick, H.; Yan, H.; Wu, Y.; Kind, H.; Weber, E.; Russo, R.; Yang, P.; Science2001, 292, 1897. 12. Johnson, J. C.; Choi, H.-J.; Knutsen, K. P.; Schaller, R. D.;
Yang, P.; Saykally, R. J.; Nat. Mater.2002, 1, 106.
13. Han, K.; Wang, J.; Sheng, Y.; Ju, F.; Sheng, X.; Wu, Y.; Tang, G.; Phys. Lett. A2012, 376, 1871.
14. Zhang, J.; Lutich, A.; Rodríguez-Fernández, J.; Susha, A.; Rogach, A.; Jäckel, F.; Feldmann, J.; Phys. Rev. B: Condens. Matter Mater. Phys.2010, 82, 1.
15. Wang, J.; Gudiksen, M. S.; Duan, X.; Cui, Y.; Lieber, C. M.;
Science2001, 293, 1455.
16. Muskens, O. L.; Borgström, M. T.; Bakkers, E. P. A. M.; Gómez Rivas, J.; Appl. Phys. Lett.2006, 89, 233117.
17. Woggon, U.; Optical Properties of Semiconductor Quantum Dots; Springer Berlin Heidelberg: Berlin, Heidelberg, 1997.
18. Liu, Z.; Hu, Z.; Xie, Q.; Yang, B.; Wu, J.; Qian, Y.; J. Mater. Chem.2003, 13, 159.
19. Song, J.; Lin, Y.; Zhan, Y.; Tian, Y.; Liu, G.; Yu, S.; Cryst. Growth Des.2008, 8, 1902.
20. Lin, Z. H.; Yang, Z.; Chang, H. T.; Cryst. Growth Des.2008,
8, 351.
21. She, G.; Shi, W.; Zhang, X.; Wong, T.; Cai, Y.; Wang, N.; Cryst. Growth Des.2009, 9, 663.
22. Zhang, B.; Hou, W.; Ye, X.; Fu, S.; Xie, Y.; Adv. Funct. Mater.
2007, 17, 486.
23. Webber, D. H.; Brutchey, R. L.; Chem. Commun.2009, 2, 5701. 24. Sen, S.; Bhatta, U. M.; Kumar, V.; Muthe, K. P.; Bhattacharya, S.; Gupta, S. K.; Yakhmi, J. V.; Cryst. Growth Des.2007, 8, 238. 25. Liu, J.-W.; Chen, F.; Zhang, M.; Qi, H.; Zhang, C.-L.; Yu, S.-H.;
Langmuir2010, 26, 11372.
26. Vasileiadis, T.; Dracopoulos, V.; Kollia, M.; Yannopoulos, S. N.; Sci. Rep.2013, 3, 1.
27. Xi, G.; Liu, Y.; Wang, X.; Liu, X.; Peng, Y.; Qian, Y.; Cryst. Growth Des.2006, 6, 2567.
28. Wei, G.; Deng, Y.; Lin, Y. H.; Nan, C. W.; Chem. Phys. Lett.
2003, 372, 590.
29. Liu, J.-W.; Xu, J.; Liang, H.-W.; Wang, K.; Yu, S.-H.; Angew. Chem.2012, 51, 7420.
30. Li, H. H.; Zhang, P.; Liang, C. L.; Yang, J.; Zhou, M.; Lu, X. H.; Hope, G. A.; Cryst. Res. Technol.2012, 6, 1.
31. Tsai, H.-Y.; Lin, Z.-H.; Chang, H.-T.; Biosens. Bioelectron.
2012, 35, 479.
32. Wang, Z.; Wang, L.; Huang, J.; Wang, H.; Pan, L.; Wei, X.;
J. Mater. Chem.2010, 20, 2457.
33. Sen, S.; Sharma, M.; Kumar, V.; Muthe, K.; Satyam, P.; Bhatta, U.; Roy, M.; Gaur, N.; Gupta, S.; Yakhmi, J.; Talanta
2009, 77, 1567.
34. Liang, H.-W.; Liu, J.-W.; Qian, H.-S.; Yu, S.-H.; Acc. Chem. Res.2013, 46, 1450.
35. Sandeep, C. S. S.; Samal, A. K.; Pradeep, T.; Philip, R.; Chem. Phys. Lett.2010, 485, 326.
36. Liao, K.-S.; Wang, J.; Dias, S.; Dewald, J.; Alley, N. J.; Baesman, S. M.; Oremland, R. S.; Blau, W. J.; Curran, S. A.;
Chem. Phys. Lett.2010, 484, 242.
37. Sheik-Bahae, M.; Said, A. A.; Wei, T.-H.; Hagan, D. J.; van Stryland, E. W.; IEEE J. Quantum Electron.1990, 26, 760. 38. Ma, H.; Gomes, A. S. L.; de Araujo, C. B.; Appl. Phys. Lett.
1991, 59, 2666.
39. Marshall, H.; Waitkins, G.; Shutt, R.; Heath, R. E. In Inorganic Syntheses; Fernelius, W. C., ed.; John Wiley & Sons: Hoboken,
1946, p. 188.
40. Vanysek, P. In CRC Handbook of Chemistry and Physics; Lide, D. R., ed.; Chemical Rubber Publishing Company: Boston, 1991, p. 8.
41. Johnson, R. A.; Anal. Chem.1953, 25, 1013.
42. Liu, J.-W.; Xu, J.; Hu, W.; Yang, J.-L.; Yu, S.-H.; ChemNanoMat
2016, 2, 167.
43. Mayers, B.; Xia, Y.; J. Mater. Chem.2002, 12, 1875. 44. Johnson, C. J.; Dujardin, E.; Davis, S. A.; Murphy, C. J.; Mann,
S.; J. Mater. Chem.2002, 12, 1765.
45. Rao, U. R. K.; Manohar, C.; Valaulikar, B. S.; Iyer, R. M.;
J. Phys. Chem.1987, 91, 3286.
46. Tóth, G.; Madarász, A.; Langmuir2006, 22, 590.
47. Pine, A.; Dresselhaus, G.; Phys. Rev. B: Condens. Matter Mater. Phys.1971, 4, 356.
48. Martin, R.; Lucovsky, G.; Helliwell, K.; Phys. Rev. B: Condens. Matter Mater. Phys.1976, 13.
49. Marini, C.; Chermisi, D.; Lavagnini, M.; di Castro, D.; Petrillo, C.; Degiorgi, L.; Scandolo, S.; Postorino, P.; Phys. Rev. B: Condens. Matter Mater. Phys.2012, 86, 064103. 50. Safdar, M.; Zhan, X.; Niu, M.; Mirza, M.; Zhao, Q.; Wang, Z.;
Zhang, J.; Sun, L.; He, J.; Nanotechnology 2013, 24, 185705.
51. Ikemoto, H.; Goyo, A.; Miyanaga, T.; J. Phys. Chem. C2011,
52. Bahl, M. K.; Watson, R. L.; Irgolic, K. J.; J. Chem. Phys.1977,
66, 5526.
53. Shioya, K.; Komatsu, T.; Kim, H. G.; Sato, R.; Matusita, K.; J. Non-Cryst. Solids1995, 189, 16.
54. Silva, M.; Messaddeq, Y.; J. Phys. Chem. Solids2001, 62, 1055. 55. Rai, V. K.; de S. Menezes, L.; de Araújo, C. B.; Appl. Phys. A:
Mater. Sci. Process.2008, 91, 441.
56. Isomaki, H. M.; von Boehm, J.; Phys. Scripta1982, 801. 57. Shirley, D.; Phys. Rev. B: Condens. Matter Mater. Phys.1972,
5, 4709.
58. Wang, J.; Yang, C.; Huang, Z.; Humphrey, M. G.; Jia, D.; You, T.; Chen, K.; Yang, Q.; Zhang, C.; J. Mater. Chem.2012, 22, 10009.
59. Zheng, C.; Du, Y.; Feng, M.; Zhan, H.; Appl. Phys. Lett.2008,
93, 143108.
60. Band, Y. B.; Harter, D.; Bavli, R.; Chem. Phys. Lett.1986, 126, 280.
61. Gao, Y.; Zhang, X.; Li, Y.; Liu, H.; Wang, Y.; Chang, Q.; Jiao, W.; Song, Y.; Opt. Commun.2005, 251, 429.
62. Lee, Y. H.; Yan, Y.; Polavarapu, L.; Xu, Q.-H.; Appl. Phys. Lett.
2009, 95, 023105.
Submitted: January 17, 2016
Published online: May 9, 2016