Quim. Nova, Vol. 37, No. 4, 745-747, 2014
E
d
u
c
a
ç
ã
o
http://dx.doi.org/10.5935/0100-4042.20140120
*e-mail: [email protected]
PREPARATION AND PROPERTIES OF PERICHROMIC DYE: AN UNDERGRADUATE LABORATORY
Priscilla Abarca, Patricia Silva, Iriux Almodovar and Marcos Caroli Rezende*
Facultad de Química y Biología, Universidad de Santiago, Av. Bernardo O’Higgins 3363, Santiago, Chile
Recebido em 03/10/2013; aceito em 18/12/2013; publicado na web em 03/04/2014
An undergraduate experiment that illustrates the phenomenon of perichromism—the sensitivity of a dye to its microenvironment, as assessed by color changes of its solutions—is described. An easily prepared perichromic imine is synthesized and characterized, and its solvatochromism, thermochromism, halochromism, and preferential solvation in binary solvent mixtures are demonstrated by visual inspection of its solutions. The results are rationalized by invoking solute–solvent interactions in the various media. Keywords: solvatochromism; thermochromism; halochromism; solute–solvent interactions.
INTRODUCTION
The term “perichromic” has been applied to dyes that are ca-pable of sensing their microenvironment by changing their color in solution.1 The most common example of perichromism is probably solvatochromism, i.e., color changes of a dye in distinct solvents, where the changes arise from its interactions with the solvating medium.2 However, other environmental perturbations can also affect the spectral response of a perichromic dye. The addition of an electrolyte may induce color changes through a phenomenon termed halochromism.3 Salts added to a solution of a halochromic dye can induce color changes that can be traced to interactions with the cation (cationic halochromism) or with the anion (anionic halochromism). Organic compounds, such as tetraalkylammonium or tetraalkylphosphonium salts, can also produce halochromic shifts that differ from those observed with alkali or alkaline-earth salts.4 Variations in the temperature (thermochromism)5 or in the pressure (piezochromism)6 of a solution of a perichromic dye can also induce color changes.
Despite such a variety of environmental changes, all spectral changes can ultimately be interpreted as arising from interactions between the dye and its environment; thus, these compounds are valuable indicators of the particular microenvironment that surrounds them. This indicating ability is especially true in solvent mixtures, where the observed spectral response of the dye does not reflect the bulk composition of the mixture but rather the composition of the solvating mixture in the cybotactic region of the molecule. By re-cording and comparing the colors of solutions of the dye in different solvent mixtures, we can deduce the dye’s preference for one of the cosolvents, or its “preferential solvation.”7
In the present communication, we describe the simple prepara-tion of a perichromic dye, 2, by condensation of an amine with an aldehyde followed by in situ treatment of various solutions of the obtained imine 1 with a base.
The imine precursor can be prepared by conventional refluxing of the two reagents in ethanol or by a microwave heating of a mixture of the solid reagents. The simplicity of these procedures allows an adequate illustration of the phenomenon of perichromism in an under-graduate laboratory through a “colorful” experiment that stimulates the student’s capacity for abstraction by demanding he or she interpret the results on the basis of solute–solvent interactions in a solution.
EXPERIMENTAL
The melting point of 1 was recorded with an electrothermal apparatus and was not corrected. UV–Vis absorption spectra of dye solutions were obtained with a Perkin–Elmer Lambda-35 spectro-photometer. An Anton Paar Microwave 300 synthesis reactor or a commercial Groven microwave oven were used for the preparation of imine 1.
4-Aminophenol, 4-nitrobenzaldehyde, and the 1.0-M methanolic solution of tetrabutylammonium hydroxide were purchased from Sigma-Aldrich.
Preparation of N-(4-hydroxyphenyl)-4-nitrobenzaldimine 1 – (a) A mixture of 4-aminophenol (0.4 g, 3.7 mmol) and 4-nitrobenzal-dehyde (0.4 g; 2.7 mmol) in ethanol (50 mL) was refluxed for 90 min. The solution was cooled, and the precipitated product was filtered and dried to give 0.35 g (44% yield) of imine 1. (b) Alternatively, a mixture of 4-aminophenol (0.4 g, 3.7 mmol) and 4-nitrobenzal-dehyde (0.4 g, 2.7 mmol) were thoroughly ground in a mortar and the resulting mixture was heated in a 100-mL Erlenmeyer flask in a conventional microwave oven for 3 min at high average power. The dark-red residue was triturated in ethanol and filtered to give 0.5 g of imine 1 (62% yield). (c) In addition, a mixture of 4-aminophenol (0.200 g; 1.83 mmol) and 4-nitrobenzaldehyde (0.200 g; 1.32 mmol) was heated in a microwave synthesis reactor for 1 min at 100 °C. The dark-red residue was triturated in ethanol and filtered to give 0.17 g of imine 1 (42% yield).
The imine was recrystallized in ethanol to give the pure product in the form of dark-red crystals; m.p. 172 °C, lit.8 176 °C.
Abarca et al.
746 Quim. Nova
a) Solvatochromism of 2 — Solutions of 1 in ethanol, 2-propanol, and dimethylformamide were prepared at a concentration of 2.0 × 10⁻⁴ mol L−1 (ca. 1.0 mg in 20 mL). To 3 mL of each of these solutions in a test tube were added 5 µL of a 1.0 mol L−1 methanolic solution of tetrabutylammonium hydroxide (5 × 10⁻⁶ mol). The resulting colored solutions were compared, and the λmax values of the solvatochromic band of the dye were recorded.
b) Preferential solvation of 2 in a binary solvent mixture — Solutions of 1 (2.0 × 10⁻⁴ mol L−1) in acetone and 2-propanol, prepared as previously described, were mixed in variable proportions to a final total volume of 3 mL. To each of these solvent mixtures was added 5 µL of a 1.0 mol L−1 methanolic solution of tetrabutylammonium hydroxide. The resulting colored solutions were compared, and the λ max values of their solvatochromic band were recorded.
c) Halochromism of 2 — To a 3-mL solution of 2 in acetone, as prepared in procedure (a), was added increasing amounts of dry sodium iodide (1 mg and 8 mg). The resulting colored solutions were compared, and the λmax values of their solvatochromic band were recorded.
d) Thermochromism of 2 — Two test tubes, each containing 3 mL of a solution of 2 in 2-propanol, as prepared in procedure (a), were immersed in ice water and in hot water (70–80 °C). After 2 min, the color of the two solutions was compared and the λmax values of their solvatochromic band were recorded.
RESULTS AND DISCUSSION
Solvatochromism of 2
The variation of the charge-transfer band of dye 2 with the solvent is readily visualized in Figure 1. The solvent polarity decreases in the order ethanol > 2-propanol > dimethylformamide such that the charge-transfer band of 2 exhibits a red or bathochromic shift as the polarity of the medium is reduced (i.e., negative solvatochromism).
The cause of this negative solvatochromic behavior can be attributed to the interactions between the dye and the solvent. A major factor that affects the internal charge transfer from the donor phenolate to the acceptor nitrophenyl group of 2 is the electronic availability of the donor group. In a protic solvent such as ethanol, which forms strong hydrogen bonds with the phenolate oxygen, this electronic availability is diminished, the highest occupied molecular orbital (HOMO) of the molecule is stabilized by this interaction with the solvent, and the corresponding electronic transition energy
to the lowest unoccupied molecular orbital (LUMO) of the dye increases (Figure 2).
Preferential solvation of 2 in a binary solvent mixture
Solutions of 2 in binary solvent mixture, such as acetone/2-pro-panol, exhibit different colors according to the mixture composition. The corresponding charge-transfer λmax values are listed in Table 1; these values indicate that a blue or hypsochromic shift of the band occurs as the proportion of 2-propanol is increased.
Notably, the variation of the λmax value does not correlate linearly with the mixture composition. For the dye in a 50:50 mixture of acetone and 2-propanol, for example, the observed λmax value (511 nm) is closer to the value for the dye in pure 2-propanol (494 nm) than to that for the dye in pure acetone (554 nm), indicating that the dye “sees” more alcohol molecules than acetone molecules in its im-mediate environment (i.e., the cybotactic region), or is preferentially solvated by 2-propanol.
Halochromism of 2
When increasing amounts of a salt such as dry sodium iodide are added to a solution of dye 2 in acetone, significant color changes are observed (Figure 3), thereby indicating halochromic behavior.
The halochromic effect is quantified by recording the spectra of these solutions. The λmax value of the halochromic band shifts bathochromically (red shift) from λmax = 537 nm in the case of 1 mg of NaI in acetone to λmax = 514 nm in the case of 8 mg of NaI. These spectral changes can be rationalized by invoking an ion-pair asso-ciation between the Na+ cation and the phenolate group of the dye; this spectral shift is therefore an example of cationic halochromism. Table 1. Variations of the charge-transfer λmax value of 2 in mixtures of
acetone/2-propanol of variable composition
Acetone/2-Propanol composition (v/v) λmax value / nm
100: 0 554
80:20 519
50:50 511
20:80 508
0:100 494
Figure 1. Color variation of solutions of 2 in solvents with decreasing po-larity. From left to right: ethanol (λmax 466 nm), 2-propanol (λmax 494 nm),
dimethylformamide (λmax 587 nm)
Preparation and properties of perichromic dye: an undergraduate laboratory 747
Vol. 37, No. 4
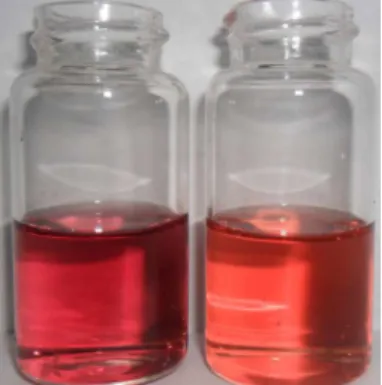
Figure 3. Cationic halochromism of dye 2 in acetone when increasing amounts of NaI are added to a 3-mL solution of the dye. From left to right: 1 mg (λmax
537 nm) and 8 mg (λmax 514 nm) of NaI added
Figure 4. Color change of a solution of 2 in 2-propanol when cooled in ice water (left) and when placed in a hot-water (70–80°C) bath (right) Thermochromism of 2
The variation in color of two solutions of 2 in 2-propanol at di-fferent temperatures is shown in Figure 4 as a demonstration of the thermochromism of the dye.
In ice water (ca. 0 °C), the solution absorbs at 491 nm, whereas it absorbs at 497 nm at 70–80 °C. The student might conclude that
colder solutions are more “polar.” In fact, heat disrupts the hydrogen bonds between the protic solvent and the phenolate oxygen, which results in a bathochromic (red) shift of the charge-transfer band of the dye when the solution is heated.
CONCLUSIONS
The described experiment involves the simple and fast preparation of a perichromic dye and subsequent characterization of its behavior as an environmental sensor. Variations of the solvent (solvatochro-mism), the solvent composition in binary mixtures (preferential solvation), the temperature (thermochromism), or the ionic compo-sition of the solvent by the addition of salts (halochromism) induce substantial color changes of its solutions, which are readily perceived by the student. The rationalization of these “colorful” results will lead the student to a deeper understanding of molecular solute–solvent interactions and their effect on electronic transition energies.
ACKNOWLEDGMENTS
This work was financed by Fondecyt project 1100022.
REFERENCES
1. Reichardt, C.; Pure Appl. Chem. 2008, 80, 1415.
2. Reichardt, C.; Welton T.; Solvent and Solvent Effects in Organic Che-mistry, 4th ed., Wiley –VCH: Weinheim, 2011, p. 360-380.
3. Reichardt, C.; Chem. Rev. 1994, 94, 2319; Machado, V. G.; Machado, C.; Nascimento, M. G.; Rezende, M. C.; Quim. Nova 1996, 19, 523. 4. Rezende, M. C.; Domínguez, M.; Aracena, A.; Spectrochim. Acta A
2012, 87, 61.
5. Silva, P. L.; Bastos, E. L.; El Seoud, O. A.; J. Phys. Chem. B 2007, 111, 6173; Aliaga, C.; Briones, L.; Rezende, M. C.; Tirapegui, C.; J. Colloid Interface Sci. 2010, 349, 56.
6. Hammack, W. S.; Hendrickson, D. N.; Drickamer, H. G.; J. Phys. Chem.
1989, 93, 3483.
7. Marcus, Y.; Solvent Mixtures, Properties and Selective Solvation. Marcel Dekker: New York, 2002, p. 6-11.