*Correspondence: M. V. M. Ribeiro. Instituto de Química. Universidade Es-tadual Paulista – UNESP. Rua Prof. Francisco Degni 55 - Jardim Quitandinha - 14800-060 – Araraquara - SP, Brasil. E-mail: [email protected]
A
vol. 52, n. 4, oct./dec., 2016 http://dx.doi.org/10.1590/S1984-82502016000400019
Development and validation of a method for the determination of
folic acid in different pharmaceutical formulations using derivative
spectrophotometry
Marcos Vinícius de Moura Ribeiro
1,2,*, Ingrid da Silva Melo
2, Francisco das Chagas da Costa
Lopes
2, Graziella Ciaramella Moita
21Institute of Chemistry, São Paulo State University “Júlio de Mesquita Filho”, UNESP, Araraquara, SP, Brazil, 2Department of Chemistry, Natural Science Center, Federal University of Piauí, Teresina, PI, Brazil
Folic acid is a B complex water-soluble vitamin that is essential to humans, and its deiciency can cause problems including congenital malformations in the fetus as well as heart disease. Most countries afected by diseases associated with a lack of folic acid now supplement foods with the vitamin. There is therefore a need for the development of new analytical procedures able to determine folic acid present in diferent matrices. This work describes the development of zero order and irst order derivative spectrophotometric methods for the determination of folic acid in diferent pharmaceutical formulations, using 0.1 mol L-1 NaOH as solvent. The methods are shown to be simple, selective, and robust. Good linearity was achieved, with correction coeicients ≥0.9996 and limits of detection and quantiication ranging from 0.64 to 0.75 and from 1.80 to 2.85 mg L-1, respectively. Recoveries of 98-104% were obtained in accuracy tests, and precision (as RSD) was between 0.2 and 4.8%. The methods can be used in routine analyses for quality control purposes, ofering an alternative to the procedures already reported in the literature.
Uniterms: Folic acid/pharmaceutical formulations. Folic acid/pharmaceutical formulations/validation
method. Folic acid/formulations/derivative spectrophotometry.
INTRODUCTION
Vitamins are a group of compounds essential for the normal development and growth of living beings.
Folic acid (FA) and folates, which are diferent chemical
forms of vitamin B9, belong to the water-soluble B-group vitamins (Zare, Shishehbore, Nematollahi, 2011;
Catharino, Godoy, Lima-Pallone, 2006; Nasser et al., 2005). Folate is a generic term for compounds possessing
vitamin activity similar to that of pteroylglutamic acid, and is the form of the vitamin naturally present in foods (Krishnaswamy, Nair, 2001). Folic acid is a synthetic form of folate, found in vitamin supplements and fortiied foods (Bailey, 2000). The main dietary sources of folic acid are spinach, white beans, asparagus, dark-leaved vegetables, Brussels sprouts, soybean and its derivatives, oranges, and
melons, amongst others (Nasser et al., 2005; Deconinck
et al., 2011). An important feature of vitamins is that they
are generally not synthesized by mammalian cells and must therefore be supplied in suicient amounts in the diet
(Aurora-Prado et al., 2004).
At present, vitamin deficiency results mainly from poverty, food preferences, drug use, and chronic alcoholism, amongst other causes. If vitamin intake is
insufficient, multivitamin preparations can be used in
order to prevent vitamin deficiency and the associated physiological problems (Deconinck et al., 2011; Aurora-Prado et al., 2004).
The chemical name of FA is
N-[4-[[(2-amino-3,4- dihydro-4-oxo-6-pteridinyl)methyl]amino]benzoyl]-L-glutamic acid (Deconinck et al., 2011; Flores et al., 2005; Nagaraja, Vasantha, Yathirajan, 2002). Its structure is shown in Figure 1. It is essential for the formation of red blood cells and is important for growth and the prevention of anemia (Zhao et al., 2006). FA deiciency can lead to congenital malformations in the fetus (spina
biida, encephalocele, cleft palate, and hydrocephalus),
Dudas, 1992; Oakley, Erickson, Adams, 1995; Santos,
Pereira, 2007).
To date, FA is the most important risk factor identiied for neural tube defects (Santos, Pereira, 2007). The severity of these defects means that it is important to undertake genetic counseling, supplement diets with
folic acid, and perform prenatal diagnosis of neural tube defects (Pacheco et al., 2009). FA is required for normal growth, reproduction (during gestation and lactation),
and antibody formation. It acts as a coenzyme in the metabolism of amino acids (glycine) and the synthesis of purines, pyrimidines, DNA, and RNA, and is vital for cell division and protein synthesis. Its deiciency can alter DNA synthesis and induce chromosomal changes (Santos,
Pereira, 2007).
Folic acid is nontoxic, although there is some concern
that high doses may mask pernicious anemia. This efect is only likely following ingestion of quantities greater than
5 mg. Medicines containing levels of folic acid above the recommended values can be harmful to consumers
(Cozzolino, 2009). There is therefore a continuing need for the development of new analytical procedures
for the determination of FA present in pharmaceutical formulations (Zhao et al., 2006). In most countries afected
by FA deiciency, foods are supplemented with the vitamin (Catharino, Godoy, 2001; Catharino, Visentainer, Godoy, 2003; Caselunghe, Lindeberg, 2000).
According to the Brazilian Pharmacopoeia (ANVISA, 2010), high performance liquid chromatography (HPLC) is recommended for the identiication and quantiication of FA in pharmaceutical formulations. Although HPLC is a well-established technology in the pharmaceutical ield, ofering sensitivity and speciicity, its disadvantages
include high operating costs, the need for large amounts
of samples and solvents, and the generation of hazardous
wastes such as organic solvents that are expensive to
dispose of and can have signiicant environmental impacts (Deconinck et al., 2011).
M e t h o d s r e p o r t e d i n t h e l i t e r a t u r e f o r t h e
determination of folic acid include HPLC with diferent
detectors (Aurora-Prado et al., 2004; Nelson, Sharpless,
Sander, 2006; Chaudhary, Wang, Prabhu, 2010),
electrophoresis (Zhao et al., 2006), electrochemical
methods (Vaze, Srivastava, 2007; Prasad et al., 2010;
Ensai, Karimi-Maleh, 2010), low injection analysis (Nie, He, Lu, 2000), and spectrophotometric methods (Pesce, Bodourian, 1986; Rao, Kanjilal, Mohan, 1978). The use of low injection analysis and zero order spectrophotometry
is problematic for the determination of folic acid in complex samples containing large amounts of interferents, because both techniques require prior extraction of the
analyte, hence increasing the costs of routine analysis. However, the use of derivative spectrophotometry ofers
a simple and inexpensive solution for the determination of drugs in pharmaceutical formulations (Rêgo, Moura, Moita, 2010; Moura, Moita, 2012).
Derivative spectrophotometry has been widely used as a tool for the quality control of medicines, enabling
the simultaneous determination of different drugs in multicomponent media. Derivation of the spectra enables the separation of superimposed signals and eliminates the
background signal caused by the presence of other species in the sample. This technique can improve sensitivity and selectivity in the analysis of mixtures. Furthermore, it is
accessible to most laboratories, since the procedure is simple, fast, and does not require prior extraction of the
analyte from the sample (Donato et al., 2010; Vidotti, Rollemberg, 2006).
According to the criteria of the Brazilian National Health Surveillance Agency (ANVISA, 2003), a method must be validated experimentally in order to ensure that it meets the requirements of the analytical applications, hence ensuring the reliability of the results. The parameters considered include specificity, linear range, precision, sensitivity, quantiication limit, and accuracy (ICH, 2000; INMETRO, 2011). The objective of the present work
was therefore to develop and validate a method for the
quantiication of folic acid in pharmaceutical formulations by derivative spectrophotometry, comparing the technique
to existing methods described in the literature.
MATERIAL AND METHODS
Reagents
Standards and pharmaceuticals
A reference standard of folic acid (99.77%) was
obtained from Pharmanostra®. Samples of folic acid
were studied in the form of tablets (5 mg) (Folacin®, lot #12097614), solution (400 mg L-1) (Folacin®, lot #1106225), and capsules (5 mg) (lot #019239). The
samples were purchased in drugstores and prescription pharmacies.
Evaluation of interferents employed excipients used in commercial pharmaceutical formulations. These were:
lactose (Pharmanostra®), talc (Henrifarma®), magnesium
stearate (Valdequímica®), microcrystalline cellulose
(Pharmanostra®), silicon dioxide (Henrifarma®), titanium
dioxide (Deg®), methylparaben (Fagron®), propylparaben
(Pharmanostra®), and ascorbic acid (Impex).
Reagents
Evaluation of the solvents used employed three different brands of sodium hydroxide (Synth, 97.0%; Impex, 99.0%; and Vetec, 99.0%), sodium carbonate (Dinâmica, 99.5%), and hydrochloric acid (Merck, 37.0%). The solvent solutions were prepared using deionized water. All reagents used were analytical grade.
Instrumentation and treatment of the data
The spectrophotometric analyses were performed
with a double beam Hitachi U-3000 spectrophotometer
itted with deuterium and tungsten lamps, using a scan range of 190-750 nm, scan speed of 300 nm min-1, and slit width of 2.0 nm. Quartz cuvettes with optical path length of 1 cm were used. The samples were centrifuged using a
New Instrument NI 1812 centrifuge. Mass measurements
were made with a Denver Instrument APX 200 analytical
balance.
Origin 7.5 software (OriginLab) was used for
statistical treatment of the data and the construction of graphs. Derivation of the spectra was performed with
Hitachi UV00 spectrophotometry software.
Analytical validation
Robustness
The robustness of the method was evaluated using the following parameters: stability of the folic acid solutions, brand of sodium hydroxide, and concentration
of the solvent.
For evaluation of the stability of the solutions, stock solutions of 100 mg L-1 folic acid were prepared in 0.1 mol L-1 sodium hydroxide and 0.27 mol L-1 sodium carbonate. The stock solutions were divided into three 250 mL lasks, one of which was transparent (allowing
the passage of light) and the others amber (preventing the
entry of light). The solution contained in the transparent
bottle was kept on the laboratory bench and was exposed to ambient light during the daytime, and the others were
wrapped in aluminum foil. One of the two solutions
that were protected from light was kept at an average
ambient temperature of 27.0 ± 4.0 °C, while the other was refrigerated at an average temperature of 3.0 ± 2.0 °C. For
the analyses, the stock solutions were diluted to 10 mg L-1 and spectra were acquired daily during a period of 4 days, and subsequently every 5 days up to 30 days. The analysis
of variance (ANOVA, p = 0.05) was used to evaluate the data obtained at the wavelength of maximum absorption, in the range studied, and at a further 14 points located
around λmax.
The study of diferent brands of sodium hydroxide was carried out using solutions of 10 mg L-1 folic acid in 0.1 mol L-1 solutions of sodium hydroxide obtained from the diferent manufacturers (Synth, Vetec, and Impex). All spectra were acquired in triplicate and the analysis of
variance (ANOVA, p = 0.05) was used to evaluate the data obtained at the wavelength of maximum absorption and at
a further 14 points located around λmax.
The influence of the solvent concentration was evaluated using solutions of 10 mg L-1 folic acid in diferent concentrations of sodium hydroxide: 0.05, 0.1, and 0.2 mol L-1. All solutions were prepared in triplicate and then submitted to spectrophotometric analysis. The results were evaluated using the analysis of variance
(ANOVA, p = 0.05), as described above.
Linearity
Analytical curves were constructed using six folic acid concentrations between 5 and 50 mg L-1, prepared from a stock 100 mg L-1 solution. Spectral scanning of the solutions was then performed to obtain the zero order spectra. The 1st, 2nd, 3rd, and 4th order derivatives of the
spectra were obtained, with Δλ varied between 1 and 10 nm, using the UV00 spectrophotometer software.
Detection and quantification limits
The limits of detection and quantification were calculated using the expressions LOD = 3 s/a and LOQ = 10 s/a, respectively, where s is the standard deviation of
the blank signal and a is the slope (or angular coeicient)
of the calibration curve (Moura, Moita, 2012). These calculations were performed using 21 blank spectra.
Selectivity
The selectivity of the method was assessed by analysis of the spectra of the excipients used in the
pharmaceutical products prepared as tablets, capsules,
L-1), talc (50 to 250 mg L-1), magnesium stearate (50 to 250 mg L-1), microcrystalline cellulose (50 to 250 mg L-1), silicon dioxide (50 to 250 mg L-1), titanium dioxide (50 to 150 mg L-1), methylparaben (10 mg L-1), propylparaben (10 mg L-1), and ascorbic acid (100 mg L-1). The spectra obtained were compared with the spectrum of a 10 mg L-1
folic acid standard solution.
Accuracy
Accuracy was assessed by addition and recovery
tests using standards at three concentration levels (50,
100, and 150%). In the case of the Folacin® solution, a 100 mg L-1 standard solution of folic acid was prepared, and 0.5, 1.0, and 1.5 mL aliquots were transferred to three 10 mL volumetric flasks. The drug solution was then used to prepare a solution containing 200 mg L-1 of folic acid, and 0.5 mL aliquots were transferred to the lasks
containing the folic acid standard solutions, prepared
previously. The volumes were then completed with the solvent, resulting in inal concentrations of 0, 5.0, 10.0, and 15.0 mg L-1 of folic acid standard and 10 mg L-1 of folic acid
from the drug sample. All the procedures were performed
in triplicate, using 0.1 mol L-1 NaOH as the solvent.
For the Folacin® tablet product, ive tablets were
crushed, and masses corresponding to 2.5 mg of folic
acid were weighed out and transferred quantitatively to four 25 mL volumetric flasks, followed by addition of 2.5, 5.0, and 7.5 mL aliquots of a 500 mg L-1 folic acid standard solution. The volumes were then completed with
the solvent, and the samples were centrifuged for 30 min at
3500 rpm, and then iltered with a quantitative ilter paper to remove suspended material. Finally, 1 mL aliquots of each solution were transferred to 10 mL volumetric lasks and the volumes were completed with 0.1 mol L-1 NaOH to give inal concentrations of 0, 5.0, 10.0, and 15.0 mg L-1 of standard and 10 mg L-1 of folic acid from the sample. These solutions were prepared in triplicate, and the accuracy was expressed in terms of the percentage recovery. The same
procedure was used for the capsule form of the drug.
Precision
Evaluation was made of intra-day and inter-day precision. The drug samples were used to prepare 100 mg L-1 folic acid solutions, in triplicate. In the case of the
tablet and capsule samples, the solutions were centrifuged
for 30 min at 3500 rpm, and then iltered with quantitative ilter paper to remove suspended material. The solutions were diluted to 10 mL in volumetric lasks to obtain (in
triplicate) folic acid concentrations of 15.0, 25.0, and 35.0
mg L-1. The results obtained were expressed in terms of
relative standard deviations (RSD).
RESULTS AND DISCUSSION
According to the Brazilian Pharmacopoeia (BRASIL, 2010), folic acid is insoluble in water and organic solvents, but exhibits good solubility in hydroxides, carbonates, and hot hydrochloric acid. The literature reports methods using sodium hydroxide and
sodium carbonate as solvents, with folic acid showing
good solubility under these conditions (Flores et al., 2005; Zhao et al., 2006). This is due to reaction of the
bases with the carboxylic groups present in the folic
acid structure (Figure 1), resulting in the formation of
carboxylic salts that are highly soluble in aqueous media.
Under these conditions, the spectrum of the folic acid
solution showed three well-deined bands of maximum
absorption, at wavelengths of 255.5, 283.0, and 365.5 nm
(Figure 2). In the case of hydrochloric acid, a low intensity band was observed and poor dissolution was achieved using acid concentrations of 1.0 and 3.0 mol L-1.
Robustness of the method
Stability
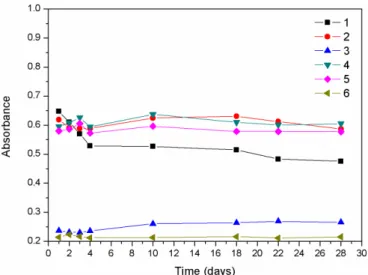
The stability tests showed that in the presence of sodium hydroxide, the standard solution of folic acid was stable for up to 28 days at ambient temperature, in both the presence and absence of light (Figures 3 and 4). The analysis of variance (ANOVA, p = 0.05) performed for the wavelength range around λmax showed that the absorbances
were statistically the same during this period. The same
behavior was observed for the refrigerated samples. In the case of the standard solutions of folic acid
in the presence of sodium carbonate, there was a marked
FIGURE 2 - Spectra obtained for 10 mg L-1 folic acid in the
decrease in the absorbance value at a wavelength of 255.5 nm (Figure 3), which was due to photochemical
degradation of the solution in the presence of light. This was also indicated by a progressive change in the color of the standard solution, from light yellow to dark yellow.
In the absence of light, the behavior was similar to that
observed using sodium hydroxide (Figure 4). These results were in agreement with the indings of other studies using HPLC (Catharino, Godoy, 2001; Catharino, Visentainer, Godoy, 2003). Sodium hydroxide was therefore selected
as the solvent in subsequent experiments.
Influence of brand of sodium hydroxide
Evaluation of the folic acid spectra obtained using
the different brands of sodium hydroxide showed that there was no signiicant diference (paired t-test, p = 0.05)
between the measured absorbances for the Impex and
Vetec brands, which could be explained by the fact that the degree of purity was 99.0% in both cases. However, when
these spectra were compared with those obtained using
sodium hydroxide from Synth, there was a diference in
absorbance (ANOVA, p = 0.05), due to the lower degree
of purity (97.0%) of the latter.
Influence of solvent concentration
No significant differences (ANOVA, p = 0.05) were observed between the folic acid absorbance spectra
acquired for the samples with three diferent concentrations of sodium hydroxide (0.05, 0.1, and 0.2 mol L-1). Since folic acid dissolved more rapidly in the presence of a
higher concentration of the base, it was decided to use 0.1
mol L-1 sodium hydroxide, which provided good stability
of the standard solution and lower consumption of the
reagent, compared to use of the 0.2 mol L-1 solution.
Evaluation of selectivity
The excipients used in the preparation of the capsules and tablets showed poor solubility in the solvent used. Talc was easily precipitated, while titanium dioxide
and magnesium stearate remained in suspension. At
higher concentrations, the turbidity of the suspensions increased, resulting in higher analytical signals
throughout the entire spectrum, due to scattering of the
radiation. This interference could afect the precision and accuracy of the method, and was therefore avoided using centrifugation and iltration. The excipients were tested at diferent concentrations, because the manufacturers did not provide any information concerning the quantities
used.
In the case of the excipients used in the solution
formulation, there was superimposition of the zero order
folic acid spectrum and the excipient spectra, because
the absorbance maxima of the latter were very close
to that of folic acid, which hindered its determination
(Figure 5). The zero crossing technique was therefore
used to eliminate this interference (Moura, Moita,
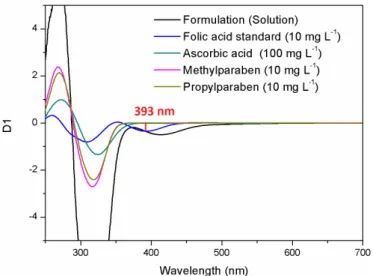
2012). The spectra of folic acid and the excipients were evaluated using four derivative orders and ten diferent Δλ. A signiicant folic acid signal was only obtained at a wavelength of 393.0 nm for the irst derivative (D1) and
for Δλ8, Δλ9, and Δλ10, with the excipients showing zero signals (Figure 6).
FIGURE 4 - Stability of 10 mg L-1 folic acid solutions in the
absence of light, using 0.1 mol L-1 Na
2CO3 (255.5 nm (1),
283.0 nm (2), 365.5 nm (3)) and 0.1 mol L-1 NaOH (255.5 nm (4),
283.0 nm (5), 365.5 nm (6)).
FIGURE 3 - Stability of 10 mg L-1 folic acid solutions in the
presence of light, using 0.27 mol L-1 Na
2CO3 (255.5 nm (1),
283.0 nm (2), 365.5 nm (3)) and 0.1 mol L-1 NaOH (255.5 nm
Linearity and limits of detection and quantification
Table I shows the parameters of the calibration
curves obtained for standard solutions of folic acid in 0.1
mol L-1 sodium hydroxide. The curves presented good slopes, intercepts near zero, and correlation coeicients that exceeded the values recommended by ANVISA (2003) (r = 0.99) and INMETRO (2011) (r = 0.9). The detection and quantiication limits were in the ranges 0.64-0.85 and 1.80-2.85 mg L-1, respectively, and were lower than the lowest concentration in the solutions analyzed (5 mg L-1). The developed method therefore provided satisfactory sensitivity and linearity. The results were similar to those obtained previously using chromatographic
(Aurora-Prado et al., 2004; Zhao et al., 2006; Nelson, Sharpless, Sander, 2006) and electrochemical techniques (Zare,
Shishehbore, Nematollahi, 2011; Vaze, Srivastava, 2007; Ensai, Karimi-Maleh, 2010) for the analysis of folic acid in diferent matrices.
Evaluation was made of diferences in the analytical parameters at diferent Δλ, using the wavelength of 393.0
nm (D1), since in the case of the Folacin® solution, only the irst derivative gave satisfactory results. It can be seen from the data provided in Table I that the results obtained
for Δλ10 were similar to those found for Δλ8 and Δλ9, with
only slight diferences, since the increase of Δλ provided better signal resolution by decreasing the noise present in
the spectrum.
Accuracy of the method
The results of the accuracy tests (Table II), performed
in triplicate using three concentration levels, showed that
in most cases the recoveries ranged from 98 to 105%, within the limits established by ANVISA (80-120%). In
FIGURE 6 - Comparison of Δλ10 irst derivative spectra for
10 mg L-1 folic acid and the main excipients used in the solution
formulation.
FIGURE 5 - Comparison of zero order spectra for 10 mg L-1 folic
acid and the main excipients used in the solution formulation.
TABLE I - Analytical parameters for the quantiication of folic acid
Method λ (nm) Linear equation r LOD (mg L-1) LOQ (mg L-1) LOL (mg L-1)
ZO 255.5 A=0.041+0.054C 0.9996 0.75 2.51 50
ZO 283.0 A=0.035+0.053C 0.9996 0.81 2.71 50
ZO 365.5 A=0.020+0.019C 0.9988 0.85 2.85 50
D1 (∆λ8) 393.0 D1=-0.004-0.032C 0.9998 0.67 1.80 50
D1 (∆λ9) 393.0 D1=-0.005-0.034C 0.9998 0.65 1.80 50
D1 (∆λ10) 393.0 D1=-0.005-0.035C 0.9998 0.64 1.78 50
tests with the Folacin® solution, the values obtained using the ZO method (365.5 nm) were in the range 90-94%, with RSD of up to 10.3%, due to the spectral overlap associated
with the excipients used in the formulation (Figure 5).
This diiculty was resolved using method D1 (393.0 nm) at diferent Δλ, resulting in recovery values in the range 100-104% (Table II).
Similar recoveries were obtained in previous studies
using HPLC (94.3-105.8% and ≥95%) (Zhao et al., 2006; Nelson, Sharpless, Sander, 2006), electrochemical
methods (97.7-103.6%) (Beitollahi, Sheikhshoaie, 2011), and flow injection analysis (>95.3%) (Nie, He, Lu,
2000).
Precision of the method
Intra-day and inter-day precisions (Table III) were determined using three concentration levels. The data
showed that the method provided high levels of precision
when used by the same analyst on the same day and by
TABLE II – Results of accuracy tests for the samples at three concentration levels
Formulation Method
(λ, nm) (mg LAdded -1)
Recovered (mg L-1)
Recovery
(%) RSD (%)
Folacin®
(solution)
ZO (365.5)
5.0 4.5 90 3.9
10.0 9.4 94 10.3
15.0 13.9 92 7.2
D1 (393.0)
∆λ10
5.0 4.9 98 3.1
10.0 10.5 105 0.5
15.0 15.2 101 2.0
D1 (393.0)
∆λ9
5.0 5.2 103 2.2
10.0 10.5 105 3.2
15.0 15.5 103 1.9
D1 (393.0)
∆λ8
5.0 5.0 100 3.5
10.0 10.4 104 3.2
15.0 15.3 102 2.0
Folacin®
(tablet)
ZO (255.5)
5.0 5.1 103 4.8
10.0 10.2 102 2.4
15.0 15.0 100 1.2
ZO (283.0)
5.0 5.1 102 4.9
10.0 10.1 101 2.5
15.0 14.9 99 1.4
ZO (365.5)
5.0 5.0 100 5.0
10.0 10.0 100 2.6
15.0 14.7 98 2.6
D1 (393.0)
∆λ10
5.0 5.1 102 4.4
10.0 10.1 101 1.6
15.0 15.0 100 0.5
Capsules ZO
(255.5)
5.0 5.1 102 0.7
10.0 10.4 104 1.5
15.0 14.7 98 0.4
ZO (283.0)
5.0 5.0 100 1.2
10.0 10.4 104 1.5
15.0 14.7 98 0.3
ZO (365.5)
5.0 5.0 101 2.7
10.0 10.4 104 1.4
15.0 14.8 99 1.1
D1 (393.0)
∆λ10
5.0 5.2 104 1.2
10.0 10.4 104 1.0
15.0 14.7 98 0.9
different analysts on different days, with RSD values ranging from 0.2 to 4.8%, which were lower than the maximum allowed by ANVISA (5.0%). The lowest values were found for method D1 (393.0 nm), showing that use
of the derivative improved the signal and eliminated interference.
The intra- and inter-day precisions were assessed by
application of the F-test and the paired t-test (p = 0.05).
The results revealed that for the three concentration levels
studied, there were no statistically signiicant diferences
between the results obtained.
CONCLUSIONS
The methods developed for the determination of
folic acid in pharmaceutical formulations were shown
to be simple, selective, and robust in terms of stability and the efects of diferent brands of sodium hydroxide
TABLE III - Intra-day and inter-day precisions for the proposed methods
Formulation Method (λ, nm)
Concentration level (mg L-1)
Intra-day precision Inter-day precision
RSD
(%) RSD (%) RSD (%)
Folacin®
(solution)
ZO (365.5)
15.0 1.3 4.7 4.1
25.0 1.5 1.6 1.8
35.0 4.3 0.4 2.7
D1 (393.0)
∆λ10
15.0 1.0 3.8 4.4
25.0 0.4 2.4 0.5
35.0 4.0 0.9 2.4
D1 (393.0)
∆λ9
15.0 1.9 4.3 4.7
25.0 0.5 2.2 0.6
35.0 3.4 0.8 1.1
D1 (393.0)
∆λ8
15.0 1.2 4.6 3.9
25.0 1.0 2.2 0.8
35.0 2.5 0.8 0.3
Folacin®
(tablet)
ZO (255.5)
15.0 1.7 0.3 4.0
25.0 1.3 0.6 0.8
35.0 1.4 0.1 1.5
ZO (283.0)
15.0 1.6 0.2 4.1
25.0 1.4 0.5 0.9
35.0 1.3 0.1 1.5
ZO (365.5)
15.0 2.3 0.9 4.8
25.0 1.8 1.6 2.5
35.0 1.1 0.4 2.3
D1 (393.0)
∆λ10
15.0 1.5 0.6 3.8
25.0 1.3 0.7 0.2
35.0 1.5 0.1 0.7
Capsules ZO
(255.5)
15.0 1.4 0.9 1.4
25.0 2.5 1.4 2.6
35.0 1.2 1.7 2.7
ZO (283.0)
15.0 1.2 0.7 1.4
25.0 2.4 1.5 2.6
35.0 1.2 1.7 2.7
ZO (365.5)
15.0 1.8 1.5 1.3
25.0 2.6 1.1 2.5
35.0 1.3 1.9 2.6
D1 (393.0)
∆λ10
15.0 1.0 0.4 1.6
25.0 2.3 1.6 2.9
35.0 1.1 1.4 2.6
and diferent solvent concentrations. Good linearity was
achieved in the concentration range studied, together
with satisfactory accuracy and precision. The proposed methods ofer an alternative for use in the quality control
of pharmaceutical formulations, being less complex and requiring smaller amounts of toxic reagents, compared
to HPLC.
ACKNOWLEDGMENTS
The authors are grateful to CNPq and UFPI for the
provision of Master’s and undergraduate scholarships, and
to Galeno Pharmacies (especially A. K. M. F. Lustosa) for supplying the samples used in this work.
REFERENCES
AGÊNCIA NACIONAL DE VIGILÂNCIA SANITÁRIA. ANVISA. Resolução no. 899 de 29 de maio de 2003. Determina a publicação do “Guia para validação de métodos analíticos e bioanalíticos”. Diário Oficial da União, Brasília, 02 jun. 2003.
AGÊNCIA NACIONAL DE VIGILÂNCIA SANITÁRIA. ANVISA. Farmacopeia Brasileira. 5. ed. Brasília: Editora FIOCRUZ, 2010.
AURORA-PRADO, M.S.; SILVA, C.A.; TAVARES, M.F.; ALTRIA, K.D. Determination of folic acid in tablets by microemulsion electrokinetic chromatography. J. Chromatogr. A, v.1051, n.1, p.291-296, 2004.
BAILEY, L.B. New standard for dietary folate intake in pregnant women. Am. J. Clin. Nutr., v.71, n.5, p.1304-1307, 2000.
BEITOLLAHI, H.; SHEIKHSHOAIE, I. Electrocatalytic and simultaneous determination of isoproterenol, uric acid and folic acid at molybdenum (VI) complex-carbon nanotube paste electrode. Electrochim. Acta, v.56, n.27,
p.10259-10263, 2011.
CASELUNGHE, M.B.; LINDEBERG, J. Biosensor-based determination of folic acid in fortiied food. Food Chem., v.70, n.4, p.523-532, 2000.
CATHARINO, R.R.; GODOY, H.T. Otimização da determinação de ácido fólico em leites enriquecidos através da análise de superfície de resposta. Cienc. Tec. Aliment., v.21, n.3, p.326-329, 2001.
CATHARINO, R.R.; GODOY, H.T.; LIMA-PALLONE, J.A. Metodologia analítica para determinação de folatos e ácido fólico em alimentos. Quím. Nova, v.29, n.5, p.972, 2006.
CATHARINO, R.R.; VISENTAINER, J.V.; GODOY, H.T. Avaliação das condições experimentais de CLAE na determinação de ácido fólico em leites enriquecidos. Cienc. Tec. Aliment., v.23, n.3, p.389-395, 2003.
CHAUDHARY, A.; WANG, J.; PRABHU, S. Development and validation of a high‐performance liquid chromatography method for the simultaneous determination of aspirin and folic acid from nano‐particulate systems. Biomed. Chromatogr., v.24, n.9, p.919-925, 2010.
COZZOLINO, S.M.F. Biodisponibilidade de nutrientes. 3. ed. Barueri, SP: Manole, 2009.
CRANE, N.T.; WILSON, D.B.; COOK, D.A.; LEWIS, C.J.; YETLEY, E.A.; RADER, J.I. Evaluating food fortiication options: general principles revisited with folic acid. Am J. Publ. Health, v.85, n.5, p.660-666, 1995.
CZEIZE, A.E.; DUDAS, I. Prevention of the irst occurrence of neural tube defects by perioconceptional vitamin supplementation. New Engl. J. Med., v.327, n.226, p.1832-1835, 1992.
DECONINCK, E.; CREVITS, S.; BATEN, P.; COURSELLE, P.; DE BEER, J. A validated ultra high pressure liquid chromatographic method for qualiication and quantiication of folic acid in pharmaceutical preparations. J. Pharmac. Biomed., v.54, n.5, p.995-1000, 2011.
DONATO, E.; CANEDO, N.A.P.; ADAMS, A.I.H.; FROEHLICH, P.E.; BERGOLD, A. Espectrofotometria derivada: uma contribuição prática para o desenvolvimento de métodos.Rev. Ciênc. Farm. Básica Apl., v.31, n.2, p.125-130, 2010.
ENSAFI, A.A.; KARIMI-MALEH, H. Modified multiwall carbon nanotubes paste electrode as a sensor for simultaneous determination of 6-thioguanine and folic acid using ferrocenedicarboxylic acid as a mediator. J. Electroanal. Chem., v.640, n.1, p.75-83, 2010.
INSTITUTO NACIONAL DE METROLOGIA. INMETRO.
Orientações sobre validação de métodos analíticos. DOQ-CGCRE-008, revisão 04, Jul. 2011.
INTERNATIONAL CONFERENCE ON HARMONIZATION. ICH. Guideline Q7: Good manufacturing practice guide
for active pharmaceutical ingredients. [S.l.]: International
Conference on Harmonization, 2000.
KRISHNASWAMY, K; NAIR, K.M. Importance of folate in human nutrition. Br. J. Nutr., v.85, n.2, p.115-124, 2001.
MOURA, J.I.; MOITA, G.C. Determinação simultânea de olanzapina e cloridrato de fluoxetina em formulações farmacêuticas por espectrofotometria derivativa. Quím. Nova, v.35, n.3, p.627-633, 2012.
NAGARAJA, P.; VASANTHA, R.A.; YATHIRAJAN, H.S. Spectrophotometric determination of folic acid in pharmaceutical preparations by coupling reactions with iminodibenzyl or 3-aminophenol or sodium molybdate– pyrocatechol. Anal. Biochem., v.307, n.2, p.316-321, 2002.
NASSER, C.; NOBRE, C.; MESQUITA, S.; RUIZ, J.G.; CARLOS, H.R.; PROUVOT, L.; YACUBIAN, M.T. Semana da conscientização sobre a importância do ácido fólico.J. Epilepsy Clin. Neurophysiol., v.11, n.4,
p.199-203, 2005.
NELSON, B.C.; SHARPLESS, K.E.; SANDER, L.C. Quantitative determination of folic acid in multivitamin/ multielement tablets using liquid chromatography/tandem mass spectrometry.J. Chromatogr. A, v.1135, n.2, p.203-211, 2006.
NIE, F.; HE, Y.; LU, J. An investigation of the chemiluminescence reaction in the sodium hypochlorite-folic acid-emicarbazide hydrochloride system. J. Microchem., v.65, n.3, p.319-323,
2000.
OAKLEY, G.P.; ERICKSON, J.D.; ADAMS, M.J. Urgent need to increase folic acid consumption. J. Am. Med. Assoc., v.274, n.21, p.1717-1718, 1995.
PACHECO, S.S.; BRAGA, C.; SOUZA, A.I.D.; FIGUEIRO, J.N. Efects of folic acid fortiication on the prevalence of neural tube defects. Rev. Saúde Públ., v.43, n.4, p.565-571, 2009.
PESCE, M.A.; BODOURIAN, S.H. Evaluation of a luorescence polarization immunoassay procedure for quantitation of methotrexate. Ther. Drugs Monit., v.8, n.1, p.115, 1986.
PRASAD, B.B.; TIWARI, M.P.; MADHURI, R.; SHARMA, P.S. Development of a highly sensitive and selective hyphenated technique (molecularly imprinted micro-solid phase extraction iber–molecularly imprinted polymer iber sensor) for ultratrace analysis of folic acid. Anal. Chim. Acta, v.662, n.1, p.14-22, 2010.
RAO, G.R.; KANJILAL, G.; MOHAN, K.R. Extended application of folin-ciocalteu reagent in the determination of drugs. Analyst, v.103, n.1230, p.993-994, 1978.
RÊGO, J.F.; MOURA, J.I.M.; MOITA, G.C. Determinação de olanzapina em formulações farmacêuticas por espectrofotometria: desenvolvimento e validação. Quim. Nova, v.33, p.1-7, 2010.
SANTOS, L.M.P.; PEREIRA, M.Z. Efeito da fortiicação com ácido fólico na redução dos defeitos do tubo neural. Cad. Saúde Públ., v.23, n.1, p.17-24, 2007.
VAZE, V.D.; SRIVASTAVA, A.K. Electrochemical behavior of folic acid at calixarene based chemically modified electrodes and its determination by adsorptive stripping voltammetry. Electrochim. Acta, v.53, n.4, p.1713-1721, 2007.
VIDOTTI, E.C.; ROLLEMBERG, M.C.E. Derivative spectrophotometry: a simple strategy for simultaneous determination of food dyes. Quím. Nova, v.29, n.2,
p.230-233, 2006.
ZHAO, S.; YUAN, H.; XIE, C.; XIAO, D. Determination of folic acid by capillary electrophoresis with chemiluminescence detection. J. Chromatogr. A, v. 1107, n. 1, p. 290-293, 2006.
ZARE, H.R.; SHISHEHBORE, M.R.; NEMATOLLAHI, D. A highly sensitive and selective sensor on the basis of 4-hydroxy-2-(triphenylphosphonio) phenolate and multi-wall carbon nanotubes for electrocatalytic determination of folic acid in presence of ascorbic acid and uric acid. Electrochim. Acta, v.58, p.654-661, 2011.
Received for publication on 06th October 2015