J. Braz. Chem. Soc., Vol. 15, No. 5, 782-785, 2004. Printed in Brazil - ©2004 Sociedade Brasileira de Química 0103 - 5053 $6.00+0.00
Short Report
* e-mail: [email protected]
An Efficient Monitoring Technique for Solid-Phase Reactions by KBr Pellets/FT-IR Using
Methyl
p
-Aminobenzoate Synthesis Assisted by Microwave Radiation on Merrifield Resin
Dyeison Antonow, Cedric Stephan Graebin and Vera Lucia Eifler-Lima*
Faculdade de Farmácia, Universidade Federal do Rio Grande do Sul, Av. Ipiranga 2752, 90610-000 Porto Alegre - RS, Brazil
O uso de pastilhas de KBr em espectroscopia de infravermelho foi investigado para a monitori-zação de reações em fase sólida. A síntese do p-aminobenzoato de metila na Resina Merrifield (RM) é descrita como um modelo para esta técnica, a qual permite que o progresso das três etapas da síntese sejam monitoradas.
The use of KBr pellets in infrared spectroscopy has been investigated for monitoring solid-phase reactions. Synthesis of the methyl p-aminobenzoate on Merrifield resin (MR) is described as a model for this technique, which allows the progress of its three on-bead reaction steps to be monitored throughout their duration.
Keywords: Merrifield resin, infrared spectroscopy, solid phase organic synthesis, microwave-assisted reactions
Introduction
Solid Phase Organic Synthesis (SPOS)1 involves the
synthesis of molecules on chemically-inert insoluble polymers. Syntheses on solid support are generally quicker because unwanted side products are removed by simple filtration and washing at each stage. High yields are often obtained because each reaction step can be driven virtually to completion by use of excess reagents. Furthermore, purification need to be performed only once, following cleavage of the final product from the resin.
The ability to monitor solid-supported reactions is highly desirable when an ever-increasing diversity of chemical processes are becoming amenable to SPOS and, hence, the production of combinatorial libraries for the rapid discovery of novel drug candidates.
Even though the two classical approaches to control reactions, consisting of chromatography and NMR methodologies, work well in solution phase, some difficulties have been found to extending these methods to monitoring on-bead reactions. The main consequence is that solid-phase reactions are often left to run for longer than necessary (to ensure a complete reaction). Some methods have been employed in SPOS such as NMR
gel-phase spectroscopy or magic angle NMR spectroscopy,2–6
fluorescence spectroscopy,7 and Fourier Transform Infrared
Spectroscopy (FT-IR) including Raman FT-IR,8,9
Attenuated Total Reflection10 and FT-IR
microspectroscopy11 and KBr pellets by Infrared difference
spectra.12 Though invaluable, these techniques require
instrumentation that is often prohibitively expensive. The necessity for developing a new and accessible technique to monitor SPOS reactions allowed development of techniques to analyse reactions on the solid-phase. FT-IR is an useful technique applied by practitioners of SPOS, and infrared difference methodology is an useful alternative, but in this work, it is reported the use of
conventional FT-IR KBr pellet methodology13,14 to monitor
the reaction directly on the polymer-support during the course of a solid-phase synthesis. This is without the need to accurately weigh the sample, or by using a control sample (reference pellet of polystyrene bead) to obtain infrared difference spectra. The goal of this work is to report an adaptation of the use of FT-IR/KBr pellets spectroscopy to monitor SPOS reactions. We chose a simple, inexpensive, non-hazardous and classical synthesis: the SPOS of methyl
p-aminobenzoate from p-nitrobenzoic acid (Scheme 1).15
Results and Discussion
783 An Efficient Monitoring Technique for Solid-Phase Reactions by KBr Pellets/FT-IR
Vol. 15, No. 5, 2004
Pleasingly, all spectra were obtained with high quality, and the presence of a straight low-noise baseline allowed real-time detection of reaction intermediates. The methodology used for monitoring the reactions is based on the ratio of peak heights B/A (Figures 1 and 2) which minimizes the error associated with overlapping bands. Since the polymeric structure of the solid support remains unaltered during the entire reaction, it can be used as an internal reference, allowing the comparison of the additional and subtracted peaks. The equilibrium state is reached when this ratio becomes constant. At the beginning, any peak can be selected for this purpose, as long as it remains constant during the reaction. For our internal
standard we chose the stretching vibration at 1450 cm-1
for the C=C-C aromatic (defined as B on the Figures) from Merrifield resin (MR). For all spectra, the ratios were recorded comparing the different height values of the non-constant band (A). All the FT-IR spectra presented here are fully consistent with the synthetic pathway proposed.
The reported FT-IR results further confirmed that by employing both SPOS and microwave-assisted strategies, we can obtain the product in a very short time: 66 min as a total time, as observed in Scheme 1.
First step - anchoring of template 1 on a MR
The coupling reaction of p-nitrobenzoic acid 1 onto
MR was studied by the additional band appearance at 1740
cm-1 (Figure 1), corresponding to stretching vibration of
the C=O bond. The spectra displayed in Figure 1 clearly show the progress of the anchoring step. The classical coupling reaction between MR and a carboxylic group
generally requires several hours.16 However, the use of
microwave radiation drastically shortened the reaction time to 6 min, indicating the success of this technology
for polymer supported/solid phase reactions.17,18 Figure 3
displays the way in which the ratio B/A decreased with time and reached a plateau after approximately 6 min.
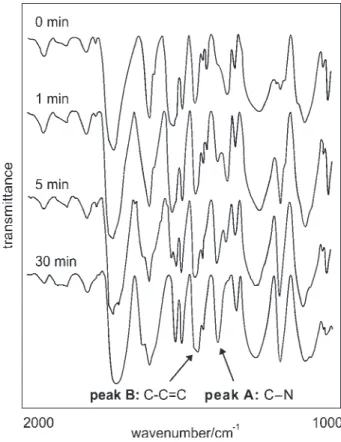
Figure 2. FT-IR spectra of 3 at various times of the reduction reac-tion.
Figure 1. FT-IR spectra of 2 at various times during the coupling reaction.
784 Antonow et al. J. Braz. Chem. Soc.
Second step – reduction of nitro group
The formation of the aromatic amino group by a classical solution-phase protocol has shown that the reduction of the
nitro group with the Sno/HCl mixture could be a convenient
method for application to solid-phase reactions in the presence of MR. In fact, this reductive condition allows formation of the amine in the same manner as solution chemistry, as can be observed in Figure 2 and in Figure 4.
The spectrum revealed a new band at 1373 cm-1 attributed
to C-N vibrations, and the disappearance of the band at
1310 cm-1, corresponding to NO
2 group stretching
frequencies.19 In order to monitor this reaction we chose the
following absorption bands (Figure 2): A = 1373 cm-1,
stretching of the phenyl C-N bond, and B = 1450 cm-1,
attributed to the polystyrene matrix.
The Figure 4 corresponds to a ratio of peak heights B/ A, and from that we can observe the reduction was complete after 30 min.
Third step – release of final product from MR
The release of the final product from MR with sodium methoxide was accomplished in 30 min, as monitored by
the disappearance of the ester absorption (1740 cm-1). At
the same time, the reaction was followed by TLC (EtOH/
CH2Cl2 1:4), and the methyl p-aminobenzoate was isolated
and characterized by 1H-NMR (overall yield: 35%).
Conclusions
In this paper we have demonstrated that the use of an FT-IR KBr pellet methodology could assist the monitoring of different reactions in SPOS, using MR. The qualitative analytical technique presented here is an uninterrupted and non-destructive method. The advantages also include low cost, availability, high resolution, accuracy, use of small amounts of samples, with easy and fast sample handling. Indeed, this technique proves that the synthetic pathway described in this paper is very fast and demonstrates that solid phase reactions can be carried out with short reaction times.
Experimental
Instrumental
All IR spectra were recorded on a Shimadzu DR 8001
FT-IR Spectrophotometer in transmittance mode, with 4 cm-1
resolution and with 40 accumulations. The frequency range
4000 to 600 cm-1 was covered. The samples were collected in
a syringe and washed, including a final wash with diethyl ether giving samples ready to be analyzed. The KBr (150 mg) pellets were prepared on a quartz mortar with about 4.5 mg
(ca. 3%) of sample (the amount of sample ensured that
absorbance values conformed to the Lambert-Beer law). The sample was then transferred to a metal container and pressed at 8 ton for 5 min to afford pellets of width 0.55 mm. The baseline correction is only required on troughs which will be
compared. The 1H NMR spectrum was recorded using a Varian
XL-200 at 200 MHz, and CDCl3 as solvent. Chemical shifts
are reported as d values (ppm) relative to TMS (0.0 ppm).
Synthetic procedures (Scheme 1)
p-Nitrobenzoic acid and other reagents were obtained
from commercial sources. All solvents were distilled prior to use. Abreviations: THF = tetrahydrofuran, DMF =
dimethylformamide, Et2O = diethyl ether, MeOH =
methanol. Merrifield resin (1% cross-linked, 2 – 2.5 mmol/ g, particle size: 200-400 mesh) was purchased from ACROS Organics, New Jersey, US.
Coupling reaction
A suspension of Merrifield resin (600 mg) in anhydrous
DMF (5 mL) was treated with p-nitrobenzoic acid (1, 1
785 An Efficient Monitoring Technique for Solid-Phase Reactions by KBr Pellets/FT-IR
Vol. 15, No. 5, 2004
equiv., 300.9 mg), Cs2CO3 (0.5 equiv., 293.4 mg) and KI
(1.1 equiv., 273.93 mg). The reaction was performed in a
domestic microwave oven (Sharp® Carrousel II, 900 W),
using 10% power for 15 min, to ensure the completion of the reaction. The samples were carefully removed with a
syringe, filtered, washed with MeOH, then Et2O, and the
spectra recorded.
Reduction of nitro group
A suspension of the resin-bound 2 (200 mg) in THF
was treated with Sno (3.3 equiv., 195.8 mg) and HCl (36%,
9.8 equiv.) and stirred for 30 min at reflux. The samples were carefully removed with a syringe, filtered, washed
with THF/water (1:1 v/v), then Et2O, and the spectra
recorded.
Cleavage step
To a suspension of 3 (200 mg) in THF was added 1.25
mL of sodium methoxide (0.2 mol L-1 in MeOH, 0.25 mmol,
0.5 equiv.) and refluxed for 30 minutes. The resin was filtered
off and washed with MeOH, then Et2O. The organic layer
was dried with Na2SO4 and evaporated under vacuum to
give 28.8 mg of 4, without additional purification (overall
yield = 35%). 1H NMR (CDCl
3, δ ppm): 3.8 (3H, s, CH3-O),
6.4 (2H, d, J 8.5 Hz, Ar-H), 7.8 (2H, d, J 8.5 Hz, Ar-H).
Acknowledgments
Fellowship to Dyeison Antonow and Cedric S. Graebin (CNPq/M&CT and PIBIC/Propesq/UFRGS, respectively). We wish to thank Dr. Pedro Fröelich for advice (LAPPS, UFRGS) and Dr. Valentim U. Costa and Joyce C. Espindola
for 1H NMR analyses (Instituto de Química/UFRGS).
References
1. Winter, M.; Warrass, R. In Combinatorial Chemistry. Practical
Approach; Fenniri, H., ed., Oxford University Press: Oxford,
2000, pp. 117-138 and references therein.
2. Lorgé, F.; Wagner, A.; Mioskowski, C.; J. Comb. Chem.1999,
1, 25.
3. Rousselot-Paillet, P.; Ede, N. J.; Lippens. J. Comb. Chem. 2001,
3, 559.
4. Seeberger, P. H.; Beebe, X.; Sukenick, G. D.; Pochapsky, S.; Danishefsky, S. J.; Angew. Chem. Int. Ed. Engl. 1996, 36, 491.
5. Manabe, S.; Ito, Y.; J. Am. Chem. Soc.2002, 124, 12638. 6. Grice, P.; Leach, A. G.; Ley, S. V.; A. Massi, A.; Mynett, D. M.;
J. Comb. Chem.2000, 2, 491.
7. Yan, B.; Li, W.; J. Org. Chem. 1997, 62, 9354.
8. Yan, B.; Gremlich, H.U.; Moss, S.; Coppola, G. M.; Sun, Q.; Liu, L.; J. Comb. Chem. 1999, 1, 46.
9. Larsen B. D.; Christensen, D. H.; Holm, A.; Zillmer, R.; Nielsen,
O. F.; J. Am. Chem. Soc.1993, 115, 6247.
10. Yan, B.; Fell, J. B.; Kumaravel, G.; J. Org. Chem.1996, 61, 7467.
11. Yan, B.; Kumaravel, G.; Anjaria, H.; Wu, A.; Petter, R. C.; Jewell Jr., C. F.; Wareing, J. R.; J. Org. Chem.1995, 60, 5736. 12. Crowley, J. I.; Rapoport, H.; J. Org. Chem.1980, 45, 3215. 13. Beebe, X.; Schore, N. E.; Kurth, M.; J. Org. Chem.1995, 60,
4196.
14. Beebe, X.; Chiappari, C. L.; Olmstead, M. M.; Kurth, M.; Schore, N. E.; J. Org. Chem.1995, 60, 4204.
15. Antonow, D.; Eifler-Lima, V. L. In Práctica de Química
Farmacêutica y Medicinal; Prado, M. A. F.; Barreiro, E.; ed.,
Cyted/RIIDDMED: Pamplona, 2002, pp.117-122.
16. Bennett, W. D. In Combinatorial Chemistry. Practical Approach; Fenniri, H.; ed., Oxford University Press: Oxford, 2000, pp. 139-262, and references therein.
17. Stadler, A. S.; Kappe, C. O.; Eur. J. Org. Chem.2001, 919. 18. Lew, A.; Krutzik, P. O.; Hart, M. E.; Chamberlin, A. R.; J.
Comb. Chem. 2002, 4, 95.
19. Colthup, N.B.; Daly, L. H.; Wiberley, S. E.; Introduction to
Infrared and Raman Spectroscopy, 3th ed., Academic Press:
San Diego, 1990.
Received: October 13, 2003